

Procurement Spend Intelligence Dashboard
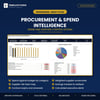
Procurement & Spend Intelligence Dashboard
Where the money actually goes, which suppliers are worth keeping, and what is about to expire — in one workbook.
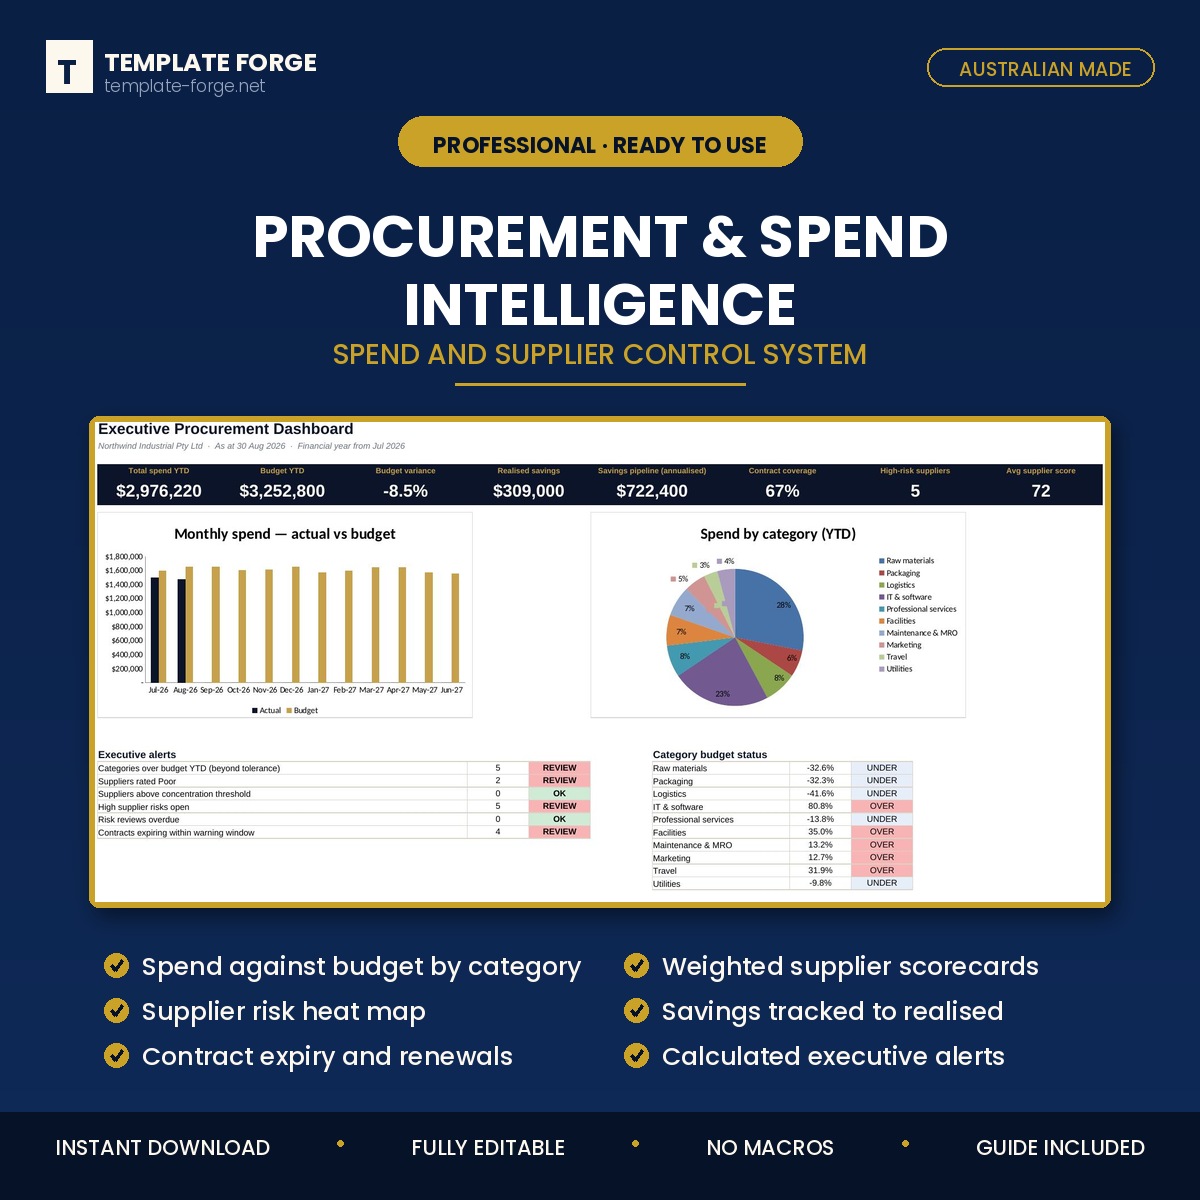
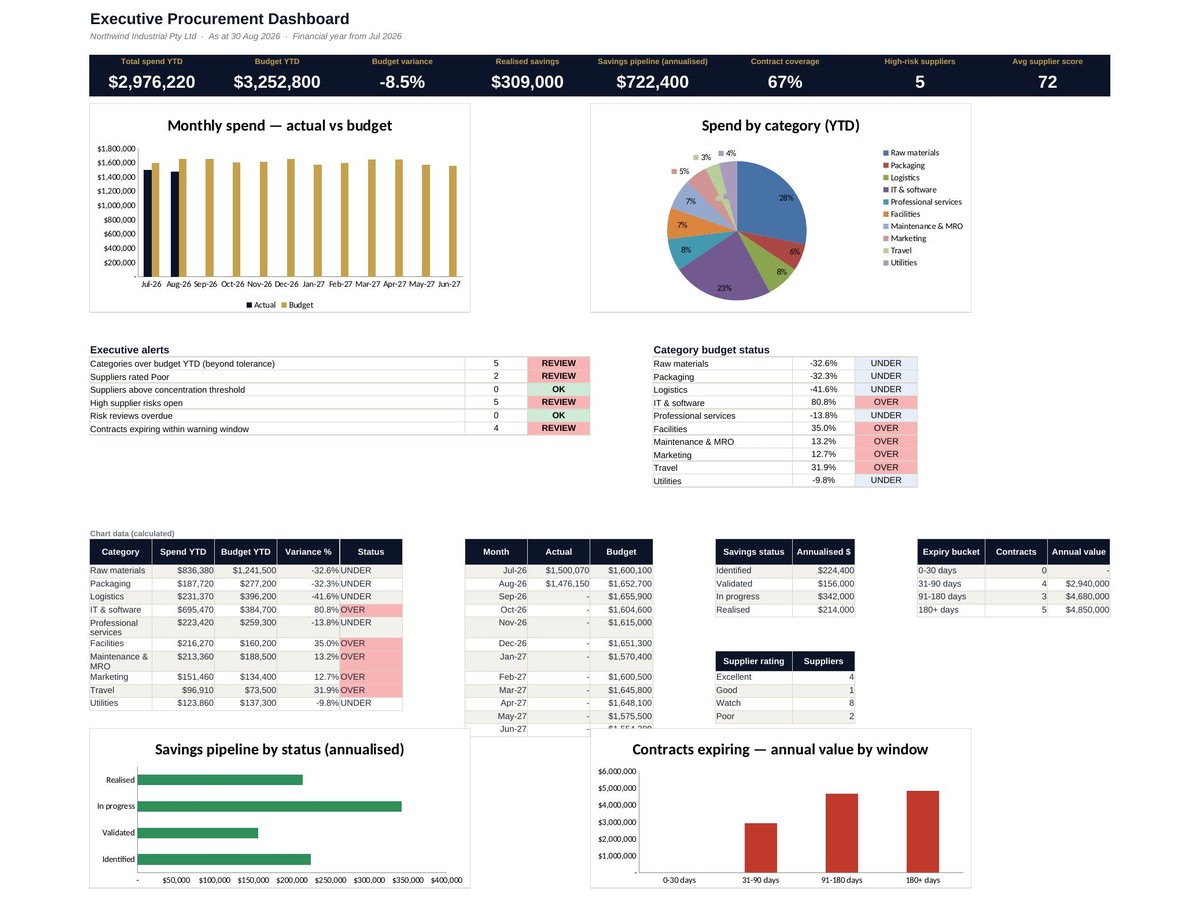
Procurement data usually sits in an accounts export nobody analyses. This turns it into a position: spend against budget by category, supplier performance scored consistently, savings actually realised rather than claimed, and contracts ranked by how soon they run out.
What's inside
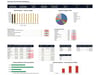
- Dashboard — spend and budget year to date, variance, realised savings, savings pipeline, contract coverage, high-risk suppliers and average supplier score, with executive alerts and category budget status
- Executive Actions — ten calculated REVIEW or OK alerts, each with the action it implies
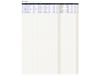
- Spend Register — 500 rows, with month, budget line, contract-backed flag and order ageing calculated
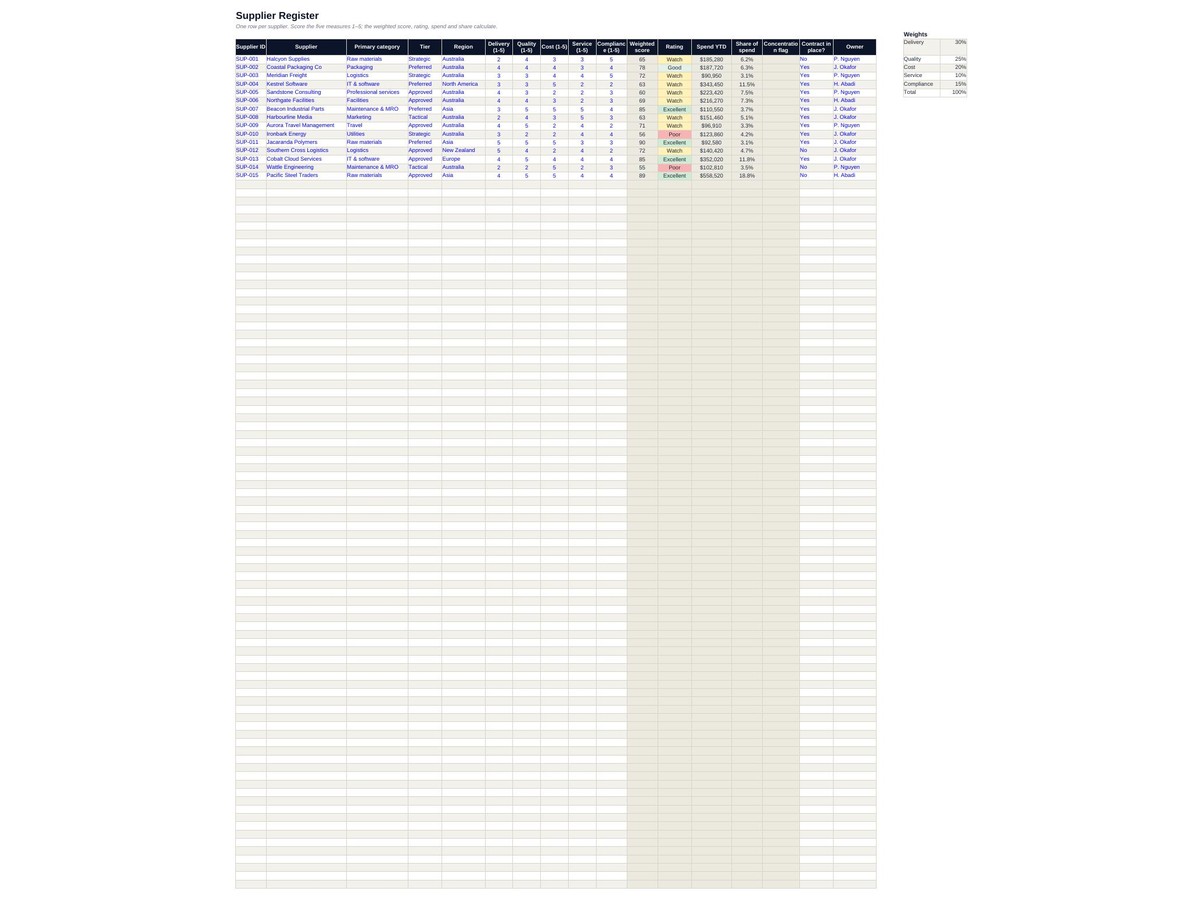
- Supplier Register — weighted five-measure scorecard with editable weights, rating, year-to-date spend, share of total, and a concentration flag when too much sits with one supplier
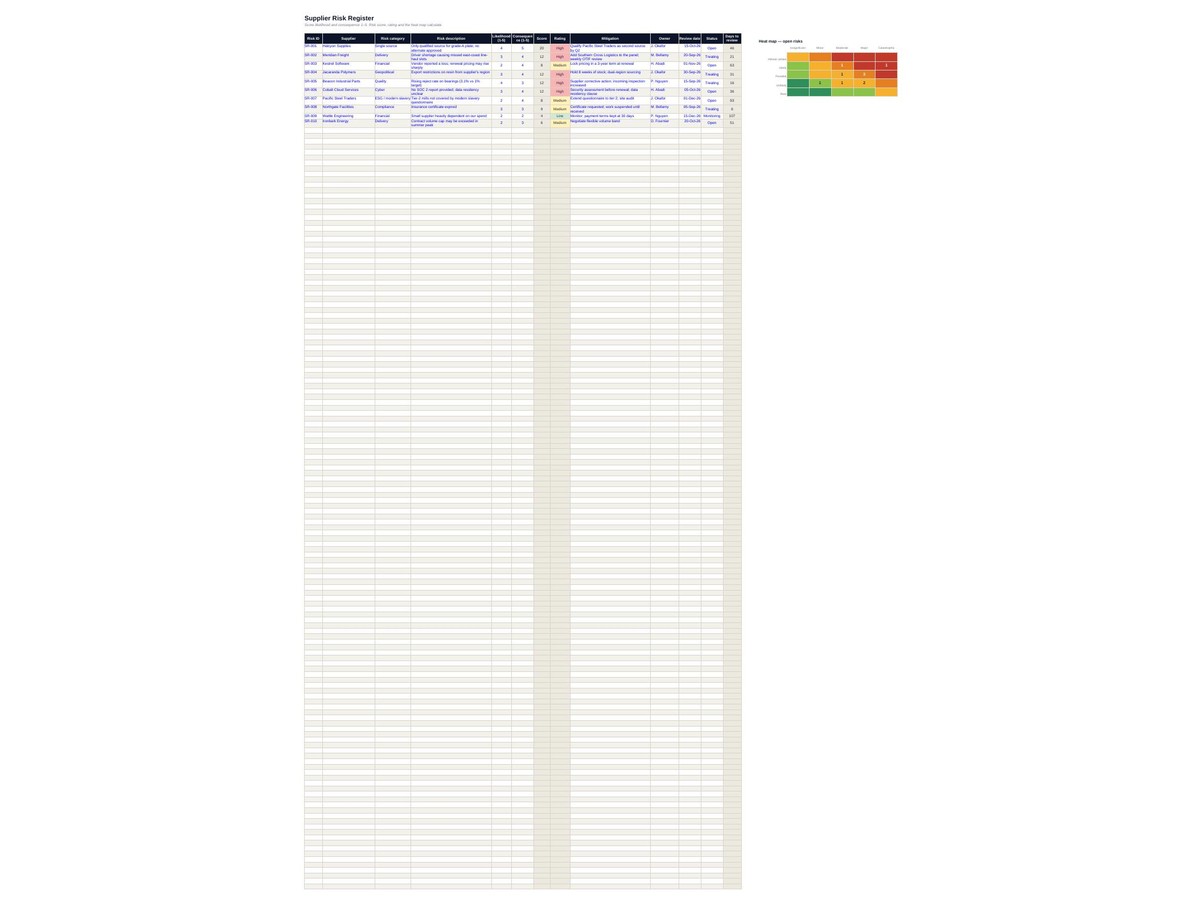
- Supplier Risk — likelihood by consequence, rated, on a live 5×5 heat map
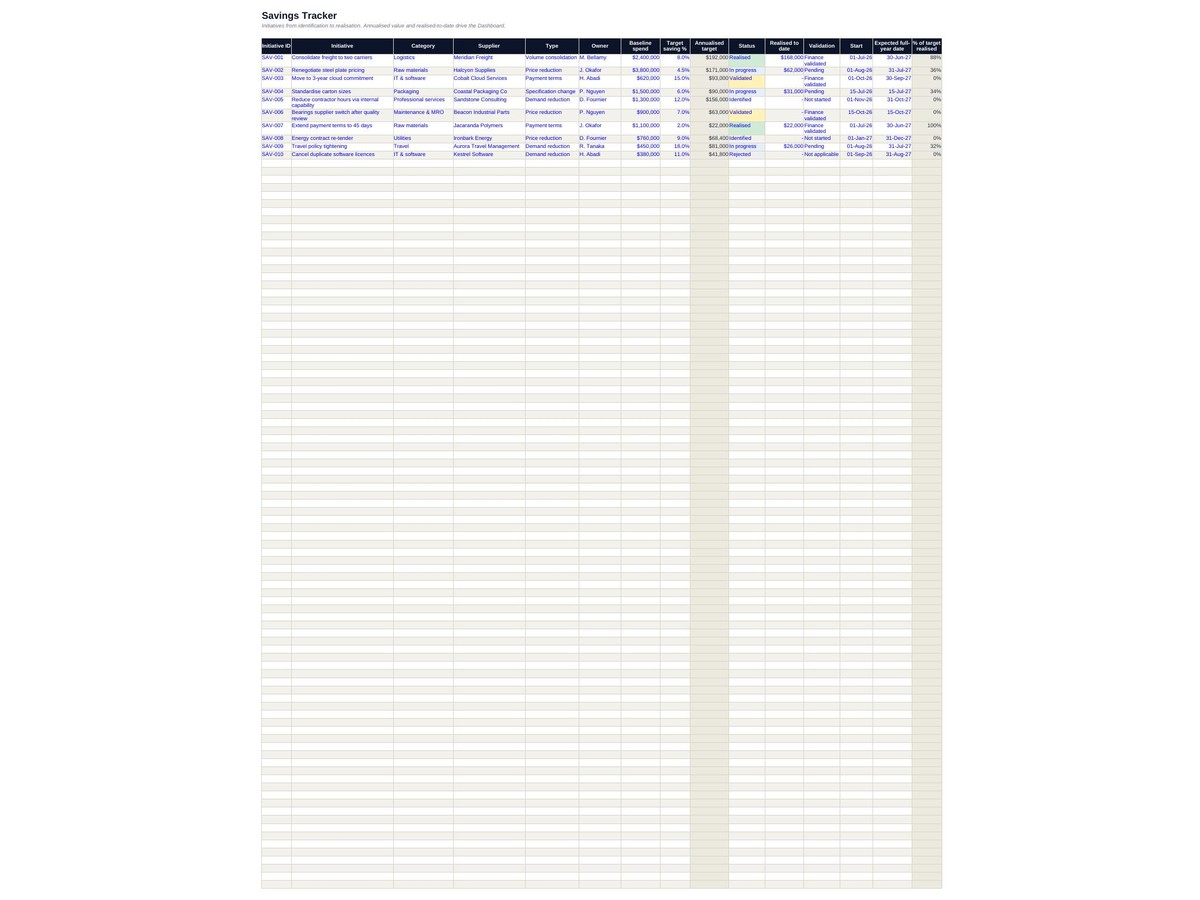
- Savings Tracker — annualised target against realised, with percentage achieved
- Contracts — annual value, days to expiry, expiry buckets and renewal decision
- Setup — budget by category and month, and your tolerances
Who it's for
Procurement managers, operations leads and business owners who need to answer "what are we spending, with whom, and is it under control" without a procurement platform.
How it works
Set your budget and tolerances on Setup, then keep the registers current. Every alert, rating, variance and heat map calculates itself — 3,800 formulas doing the work. No macros, no add-ins, no subscription; a normal Excel file that opens in any version of Excel and keeps working forever.
Built in Australia from more than twenty years of program delivery experience. Instant download, yours to keep, use it across as many categories and suppliers as you like.