


Incident Cost Analysis Dashboard V.2 - Excel Template
Stay ahead in workplace safety with our visually rich and insightful dashboard — designed to help organizations monitor, analyze, and reduce incident-related costs and risks effectively.
✨ Why You’ll Love It:
Our dashboard provides a complete snapshot of workplace incidents and their financial impact. Whether you're a Safety Officer, Manager, or Admin, this tool helps you make data-backed safety decisions in seconds.
🔍 What's Inside the Dashboard?
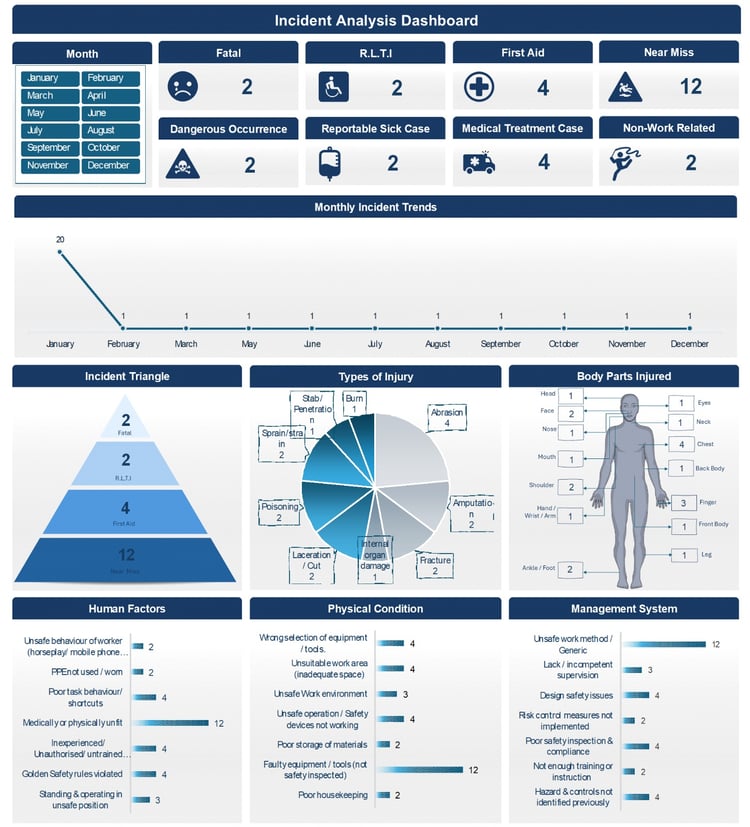
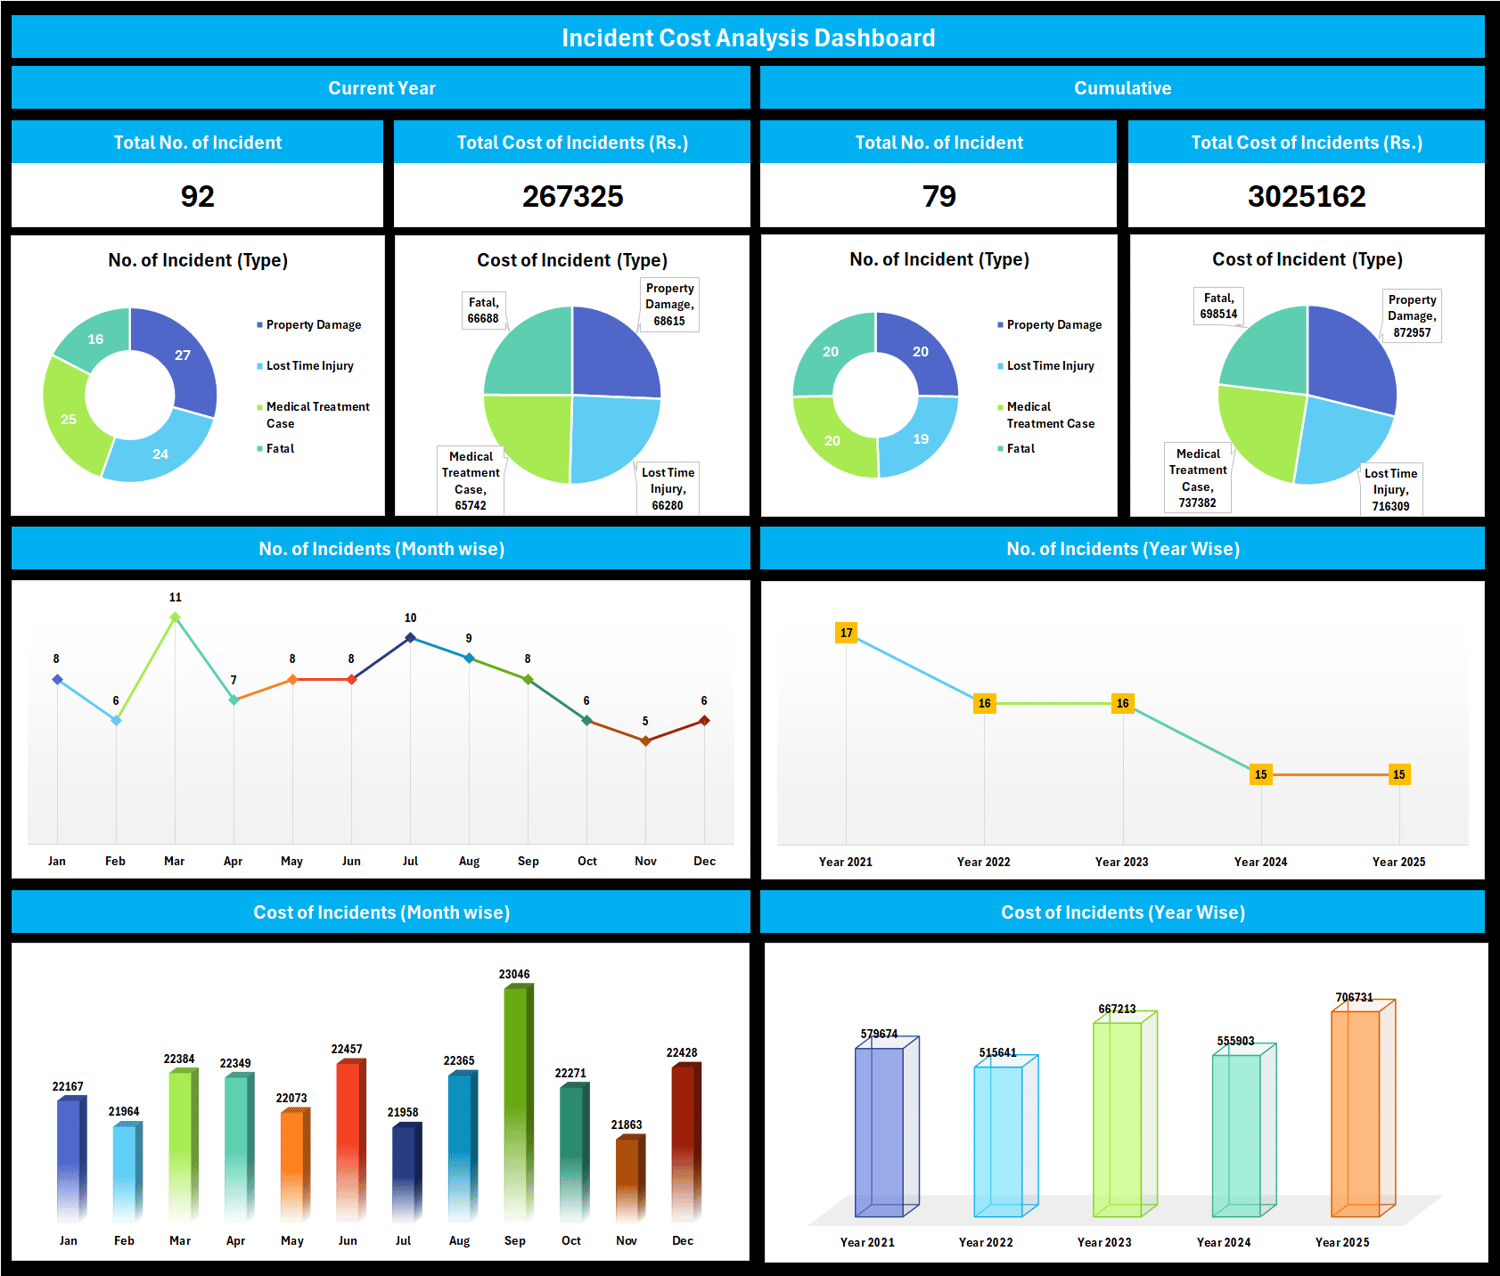
- 📌 Current Year Overview
- Get a clear summary of all incidents that occurred during the year
Instantly see the types of incidents like:
- 🏚️ Property Damage
- ⏱️ Lost Time Injury
- 💉 Medical Treatment Cases
- ⚠️ Fatal Incidents
Know how much each type of incident is costing your organization
Perfect for tracking immediate safety performance
📌 Cumulative Insights
- Understand the overall trend over several years
- Identify whether safety efforts are improving outcomes
- Spot recurring incident types and their long-term cost impact
- Great for management reporting and safety audits
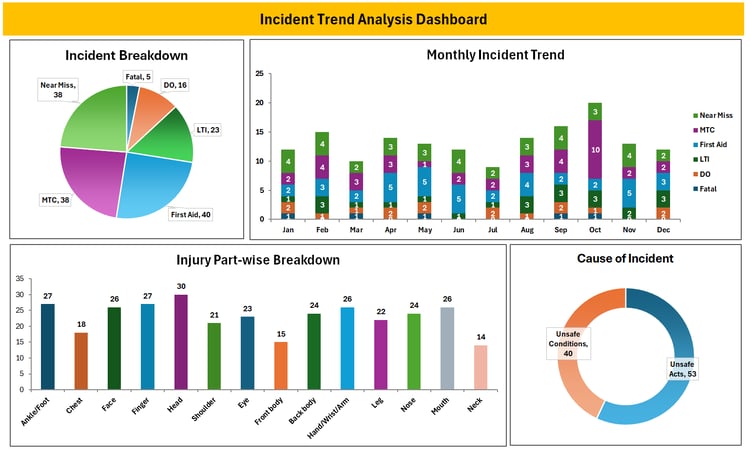
📊 Graphical Reports Included:
- 📅 Monthly Incident Trends – Know which months are risk-heavy
- 📆 Year-Wise Comparison – Visualize how each year performed
- 🧁 Pie Charts by Incident Type – Easy-to-read data slices
- 📊 Bar Graphs for Monthly/Yearly Costs – Quickly spot cost spikes
🚀 Benefits You Get:
✔️ Identify patterns and root causes
✔️ Strengthen your safety culture
✔️ Reduce future incidents and costs
✔️ Share insights easily with your team or leadership
✔️ Supports compliance and insurance reporting