


5S Audit Analysis Dashboard – Excel Template
On Sale
$19.00
(70% off)
$5.70
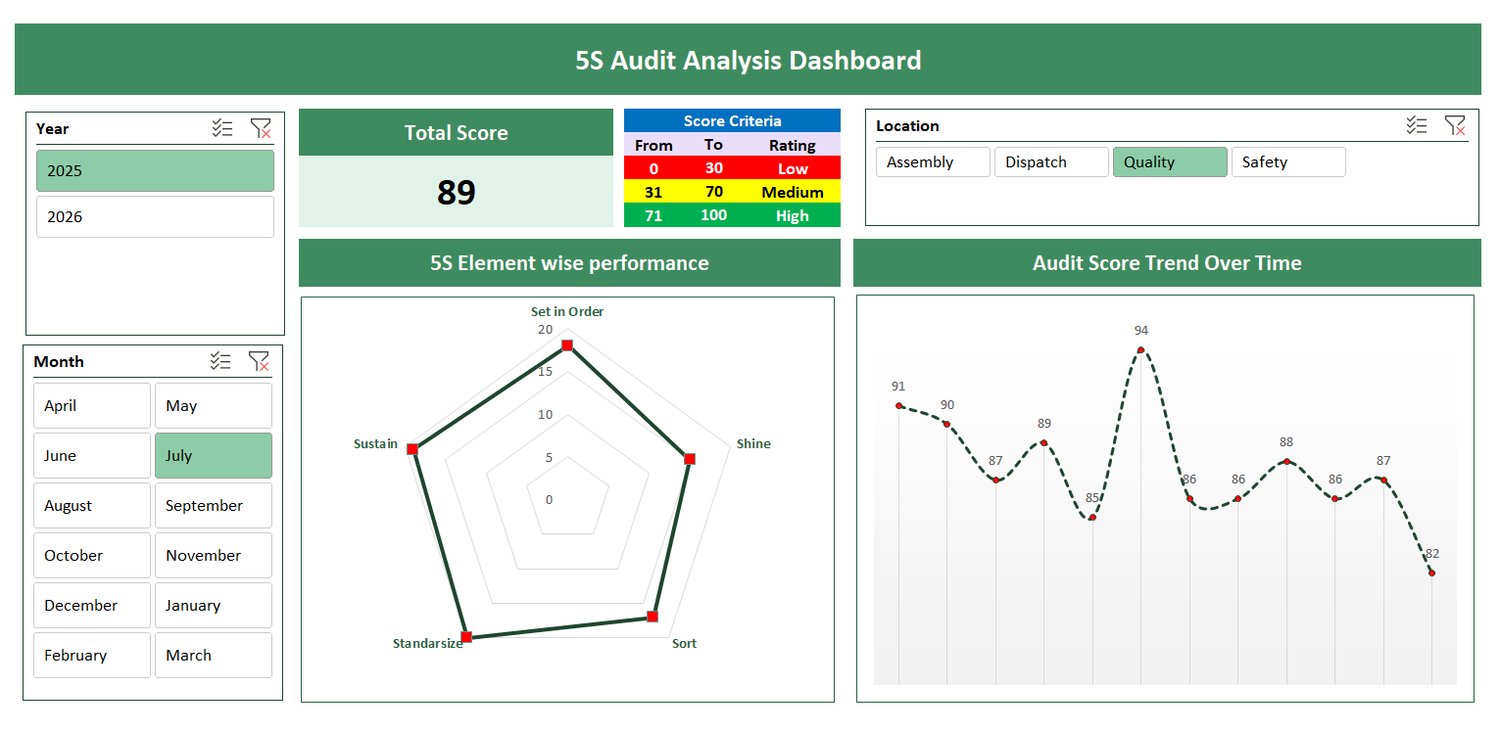
The 5S Audit Analysis Dashboard is a dynamic Excel-based tool designed to help organizations monitor and improve workplace organization and efficiency through the 5S methodology (Sort, Set in Order, Shine, Standardize, Sustain).
Key Features
- Interactive Filters
- Filter audit results by Year and Month to view and compare past performance.
- Choose specific Locations (Assembly, Dispatch, Quality, Safety) to analyze area-wise scores.
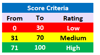
- Comprehensive Score Overview
- Displays the Total Audit Score for the selected period.
- Clear Score Criteria (Low, Medium, High) help quickly assess performance levels.
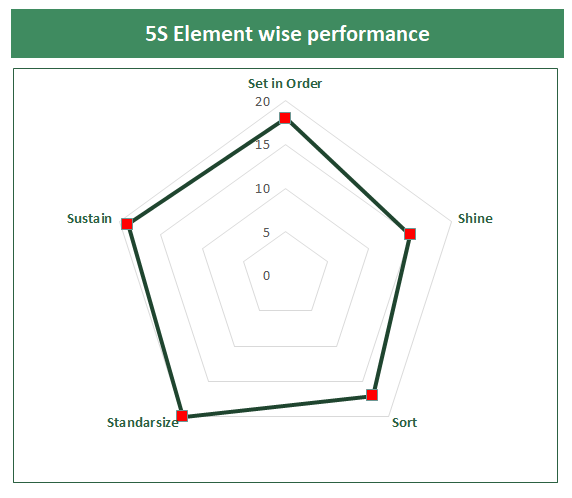
- 5S Element-Wise Performance
- A radar chart highlights strengths and improvement areas across all five 5S elements: Sort, Set in Order, Shine, Standardize, Sustain.
- Easily identify which elements need more focus.
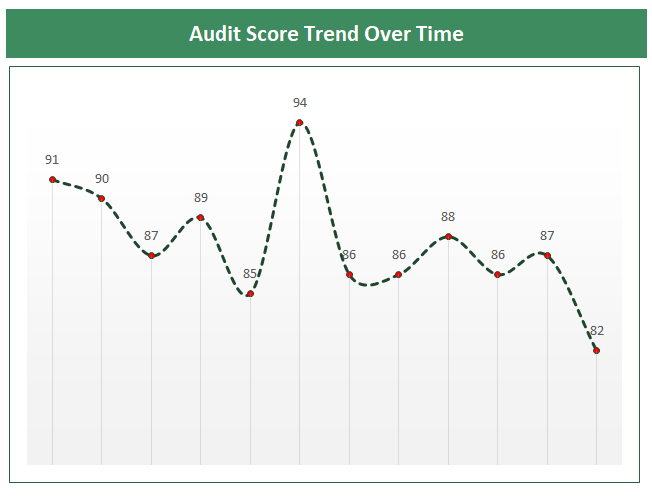
- Trend Analysis Over Time
- A line graph shows the Audit Score Trend month-by-month to track improvements or declines.
- Visual markers help pinpoint peaks and dips in performance.
Benefits
- Enables data-driven decision making for continuous improvement.
- Helps management teams track 5S implementation effectiveness over time.
- Provides a clear, visual snapshot of performance across locations and elements.
This dashboard is ideal for Quality Teams, Operations Managers, and Lean/5S Coordinators who want a ready-to-use, visually appealing, and customizable Excel tool to monitor their 5S audits.