Stop Work Authority Analysis Dashboard
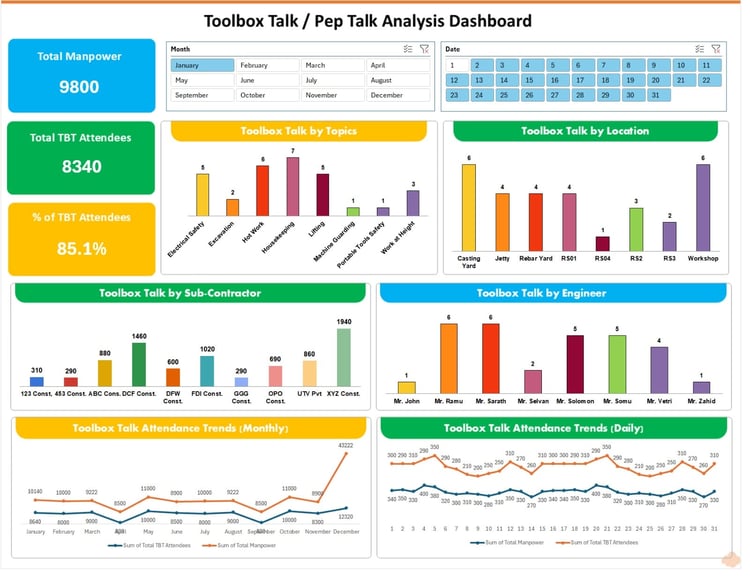
The Stop Work Authority Analysis Dashboard is a powerful, ready-to-use Excel-based tool designed to help organizations track, analyze, and manage workplace safety interventions effectively. Built with an interactive and visually appealing design, this dashboard provides real-time insights into safety stoppages, empowering management and safety teams to take data-driven decisions for a safer workplace.
Key Features:
✅ Interactive Dashboard – Easy-to-use filters by month to analyze trends over time.
✅ KPI Tracking – Instant view of total Stop Work cases, Open cases, and Closed cases.
✅ Detailed Analysis:
- SWA Issued To – Track employees who received Stop Work Authority.
- SWA Issued By – Identify supervisors/managers actively issuing stop work notices.
- Contractors – Monitor contractor performance in safety compliance.
- Departments – Visualize departmental safety trends.
- Activities – Understand high-risk activities such as hot work, scaffolding, or working at height.
- Locations – Spot critical areas with recurring safety concerns.
✅ Data Visualization – Professionally designed charts (bar, pie, line, and area graphs) for quick decision-making.
✅ No Complex Setup – Works directly in Excel, no additional software required.
Benefits:
- Improve safety performance monitoring with clear, real-time insights.
- Enable management accountability by highlighting frequent SWA issuers and receivers.
- Strengthen contractor safety compliance tracking.
- Identify high-risk departments and activities for focused interventions.
- Foster a proactive safety culture by turning data into actionable insights.
Ideal For:
- EHS (Environment, Health & Safety) Teams
- Safety Managers & Supervisors
- Contractors & Project Managers
- Organizations aiming to improve workplace safety compliance and reporting
⚡ Make safety data work for you – with this professional Stop Work Authority Analysis Dashboard, you can enhance visibility, accountability, and proactive safety management in your workplace.