



Head & Shoulders Explained — Measured (PDF Guide)
You learned the three peaks with the tall one in the middle, and it is the one pattern everybody can draw. Then you went looking and found them everywhere, or nowhere, depending on how hard you squinted. Both of those are the same problem: a head-and-shoulders is a shape in a smoothed line, and nobody ever told you there was a smoothing choice underneath it.
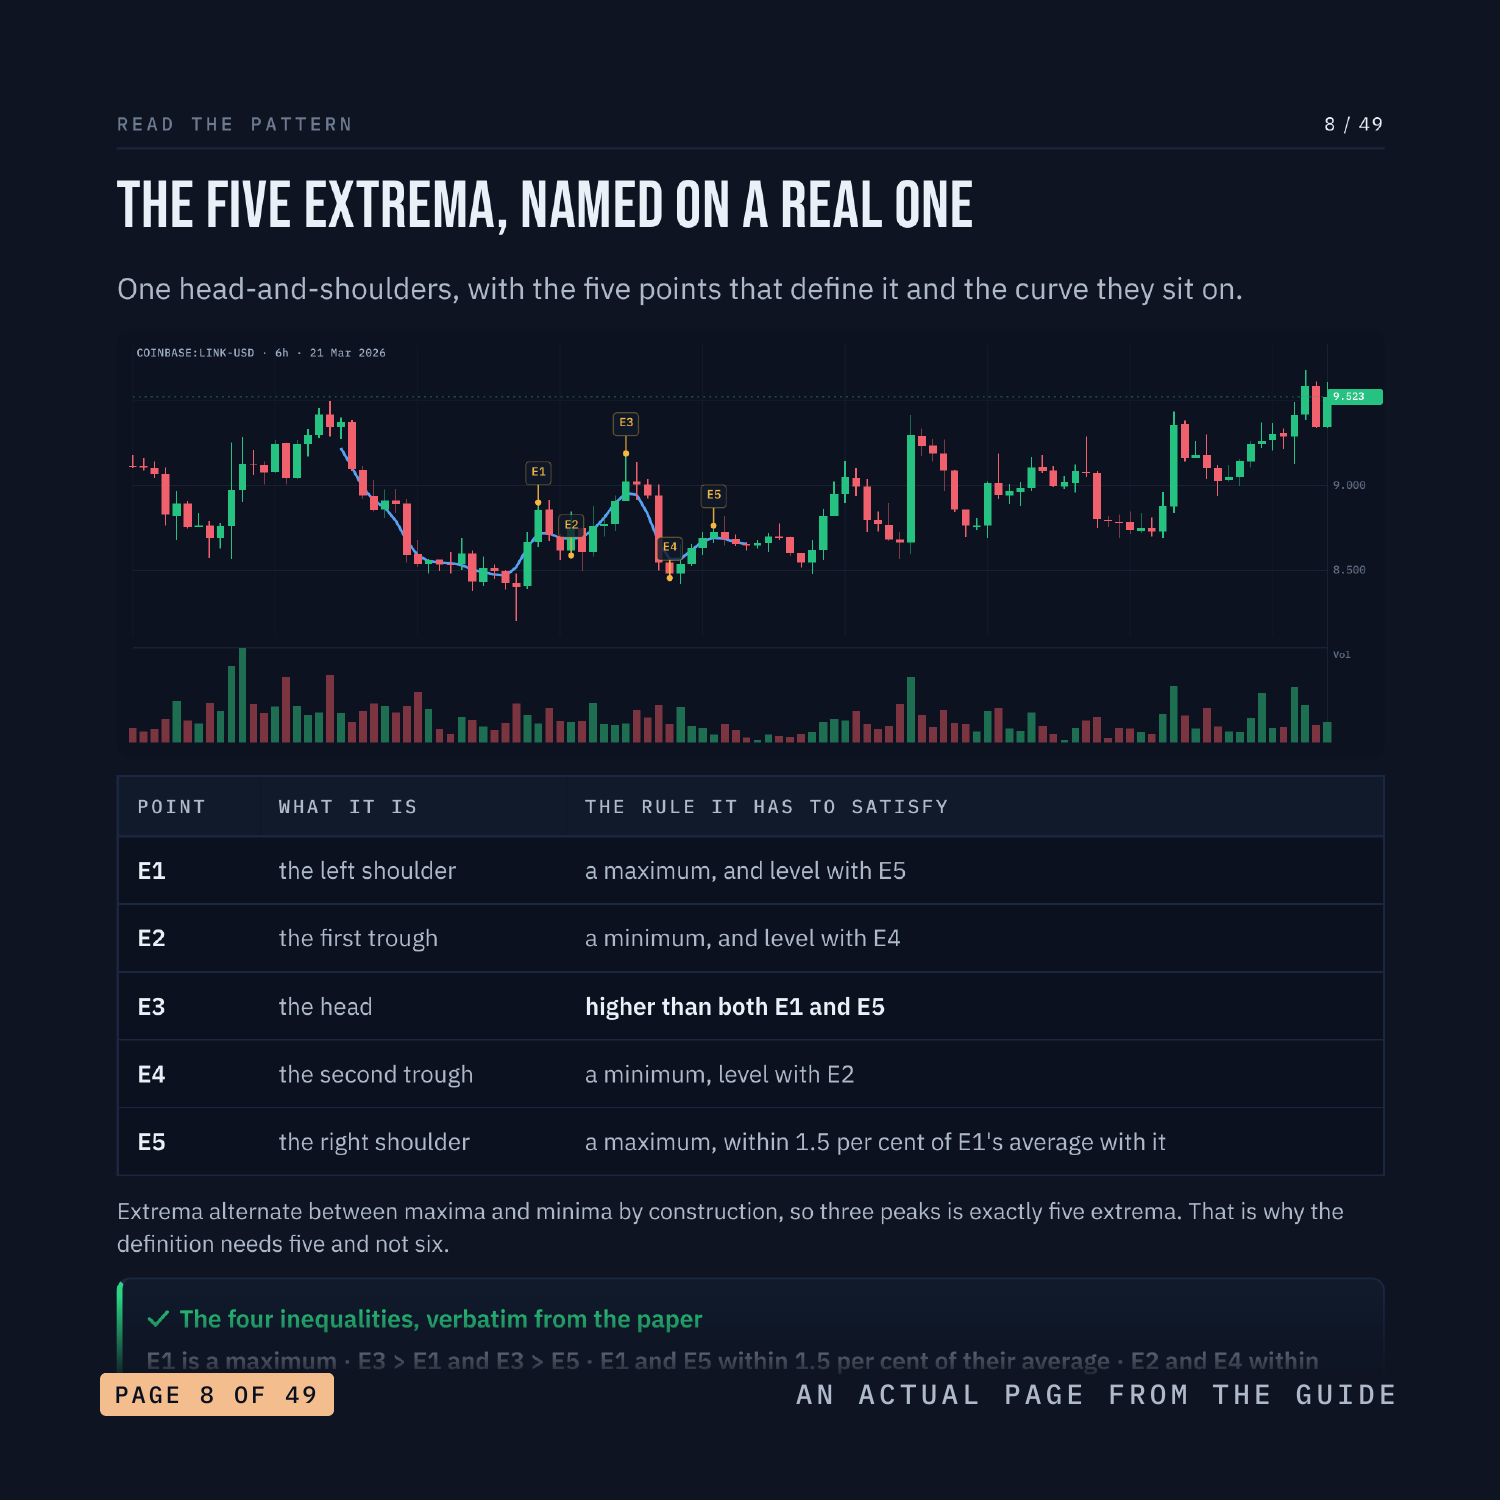
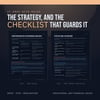
This guide uses the one algorithmic definition that exists - Lo, Mamaysky and Wang, Journal of Finance 2000 - with their inequalities printed as written. Five extrema, the middle peak highest, the shoulders within 1.5 per cent of their average. Across 35,944 bars that gives 464 head-and-shoulders and 441 inverse. Then it races them against a control, and prints what came back. This is a 49-page PDF that teaches Head & Shoulders from the first thing you see on the screen through to a written strategy with an entry, a stop and an explicit rule for when the trade is wrong.
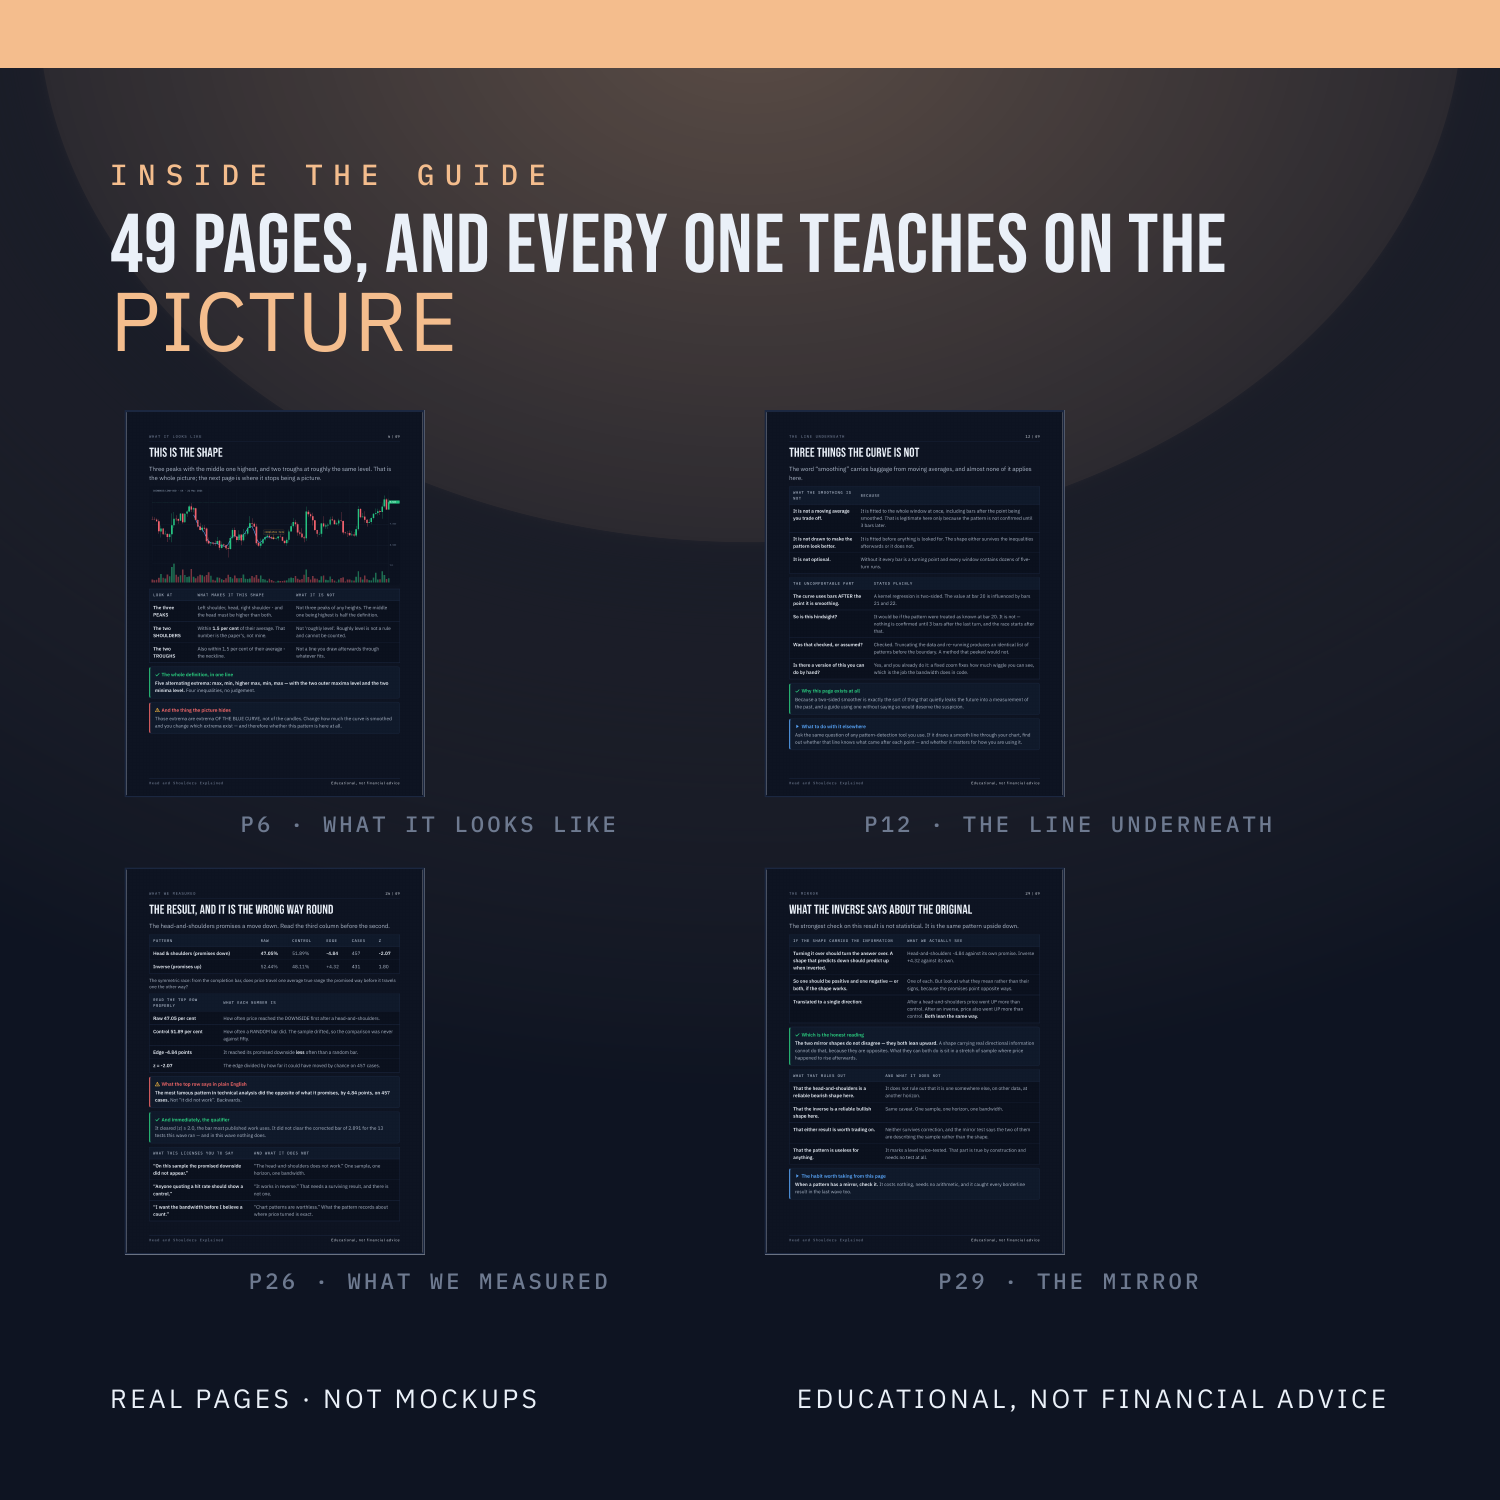
Nothing is taught underneath a chart. Every label sits on the candle, the line or the level it is describing, on real BTC, ETH, SOL and LINK charts, with the smoothed curve the detector actually saw drawn over the candles. There are three quizzes on real charts, each followed by the same chart re-shown annotated with the reasoning, plus faded practice pages where the first steps are filled in and you finish the rest.
WHAT'S INSIDE
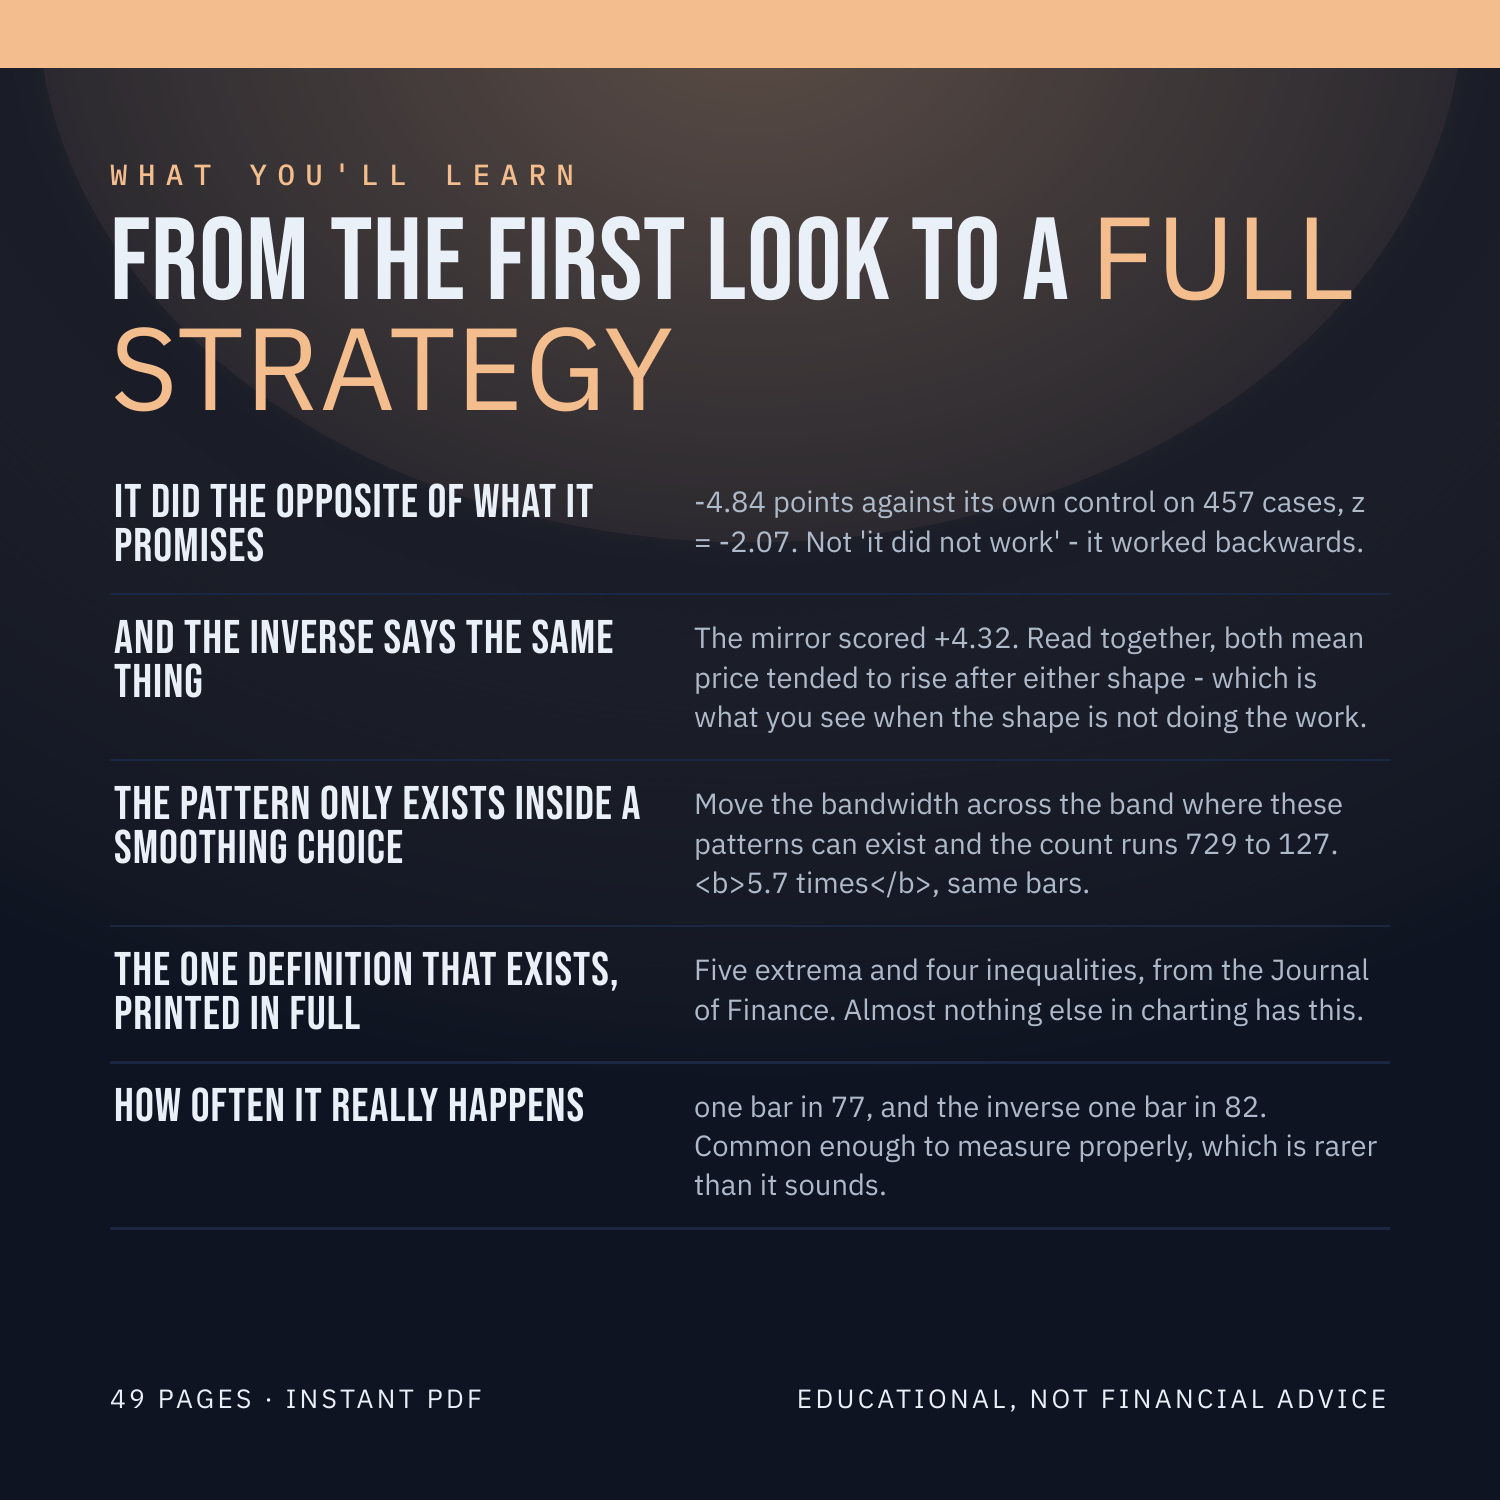
It did the opposite of what it promises - -4.84 points against its own control on 457 cases, z = -2.07. Not 'it did not work' - it worked backwards.
And the inverse says the same thing - the mirror scored +4.32. Read together, both mean price tended to rise after either shape, which is what you see when the shape is not doing the work.
The pattern only exists inside a smoothing choice - move the bandwidth across the band where these patterns can exist and the count runs 729 to 127. 5.7 times, same bars.
The one definition that exists, printed in full - five extrema and four inequalities, from the Journal of Finance. Almost nothing else in charting has this.
How often it really happens - one bar in 77, and the inverse one bar in 82. Common enough to measure properly, which is rarer than it sounds.
WHAT YOU'LL BE ABLE TO DO
Mark a head-and-shoulders by rule instead of by eye.
Say what smoothing you used, and what changing it costs.
Read the direction result without over-reading it.
Apply the mirror test to any pattern that has an opposite.
Explain why one result clearing z = 2 out of 13 tests is not a finding.
AN HONEST NOTE
Head & Shoulders is a clue, not a crystal ball. It describes what price has already done. This guide contains no win-rates, no backtest results and no promises about what you will make, because nobody can verify those and you should not trust anyone who prints them. What it hands you instead is a set of rules you can test yourself on TradingView in an afternoon. Educational, not financial advice.
Instant download. 49 pages, PDF.