





Drawdown Explained — Measured (PDF Guide)
You know a loss needs a larger gain to undo it, and you have probably never computed the curve. It bends far harder than intuition expects, and everything you decide during a losing run gets decided without it.
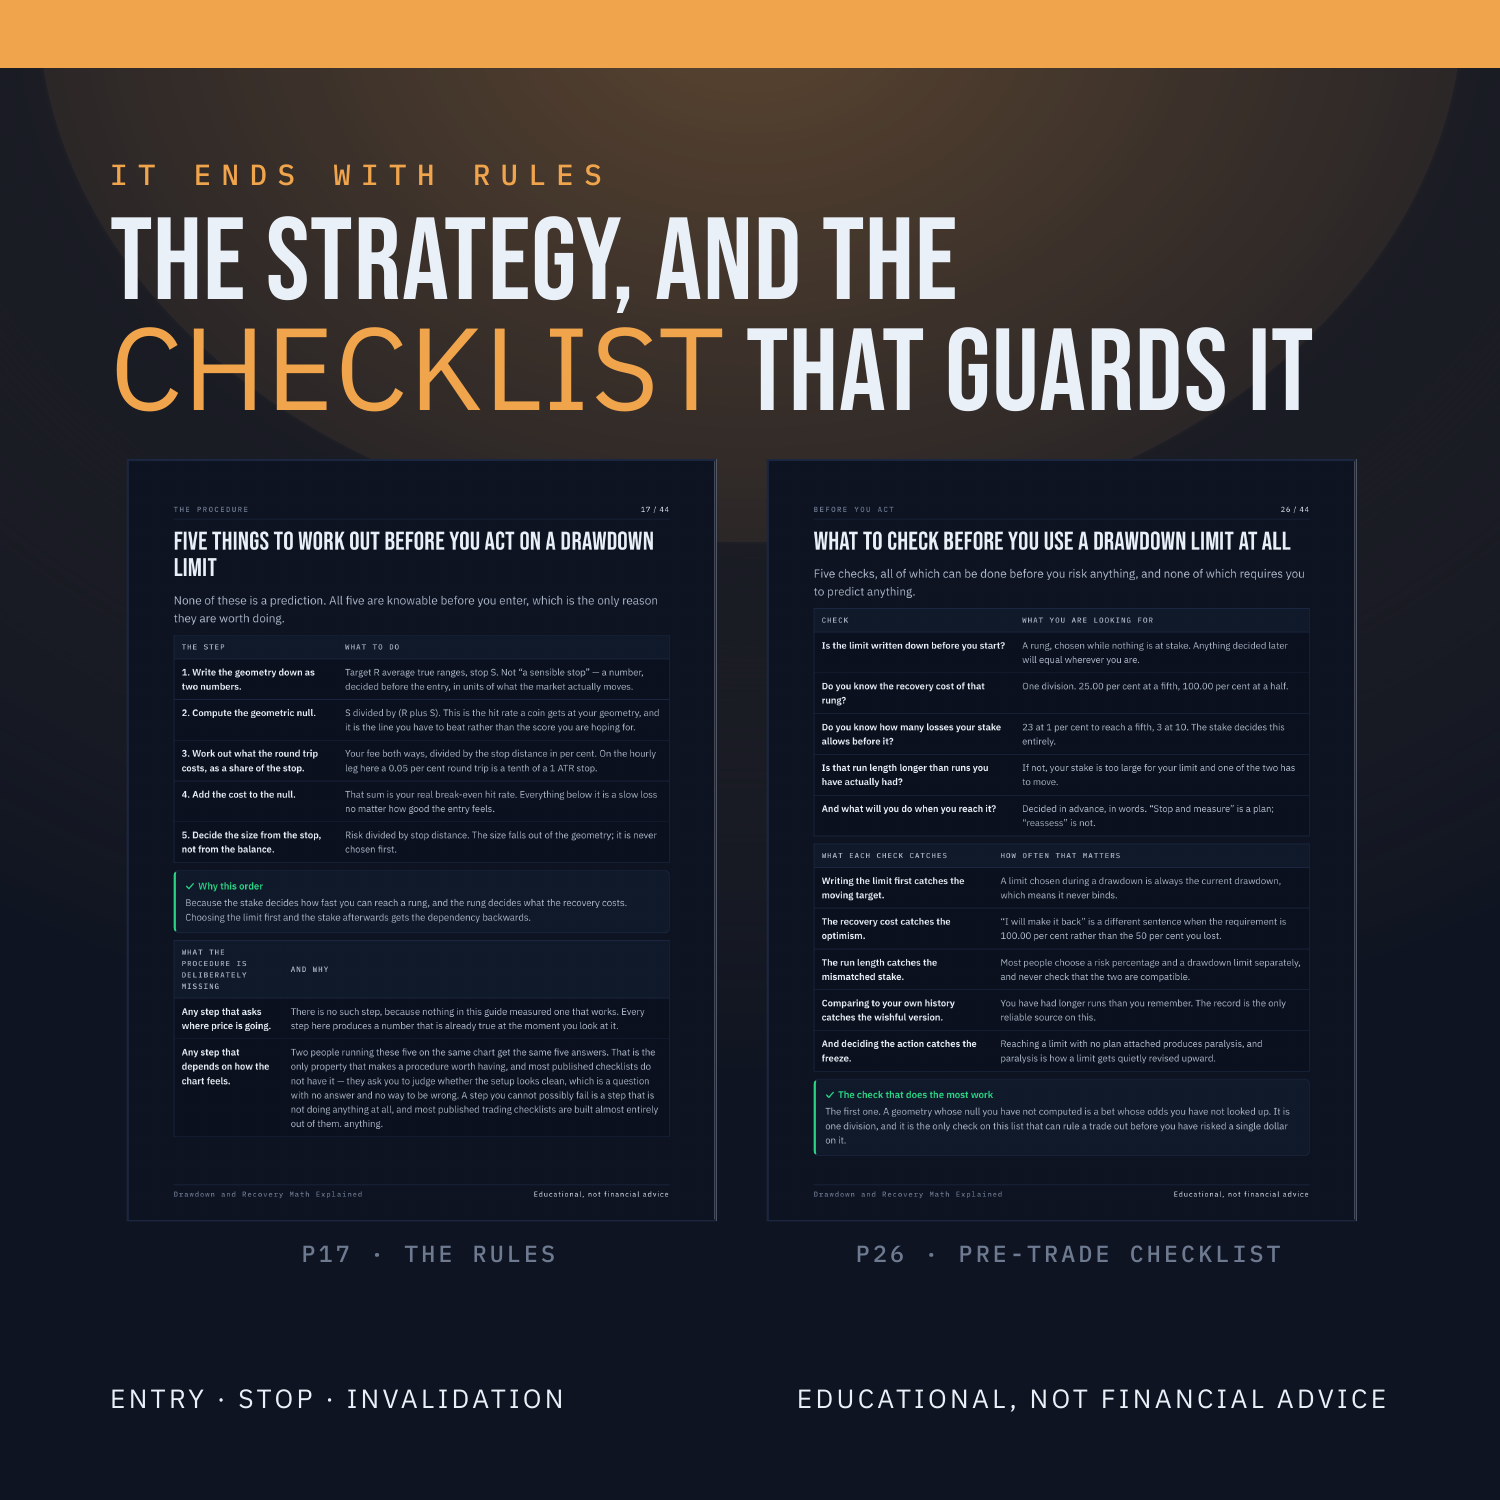
This guide prints the recovery requirement for every depth of loss, counts how many consecutive losses each risk setting can absorb before reaching it, and does it all in one division you can repeat. Nothing here is a forecast; it is arithmetic. This is a 44-page PDF that teaches Drawdown from the first thing you see on the screen through to a written strategy with an entry, a stop and an explicit rule for when the trade is wrong.
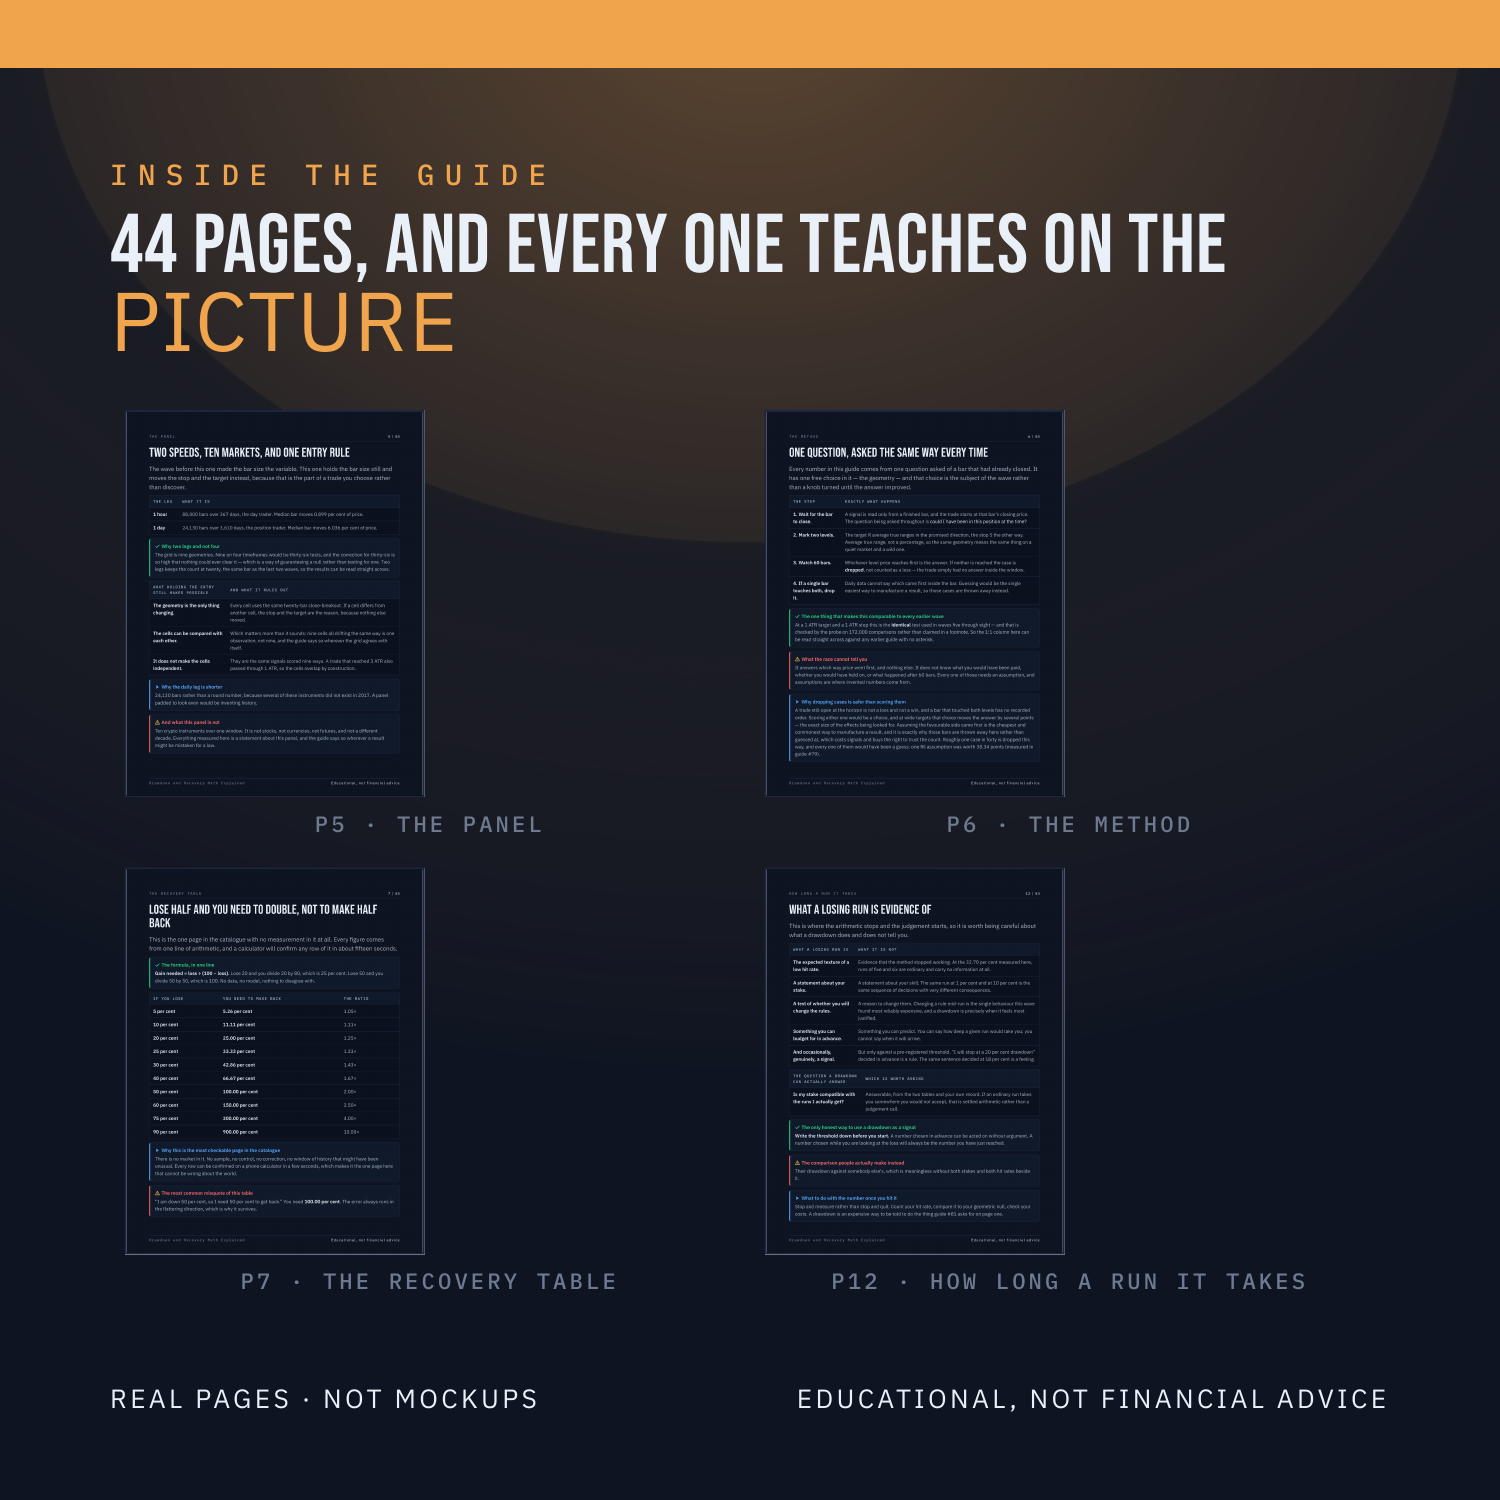
Nothing is taught underneath a chart. Every label sits on the candle, the line or the level it is describing, on real BTC, ETH, SOL and LINK charts. There are three quizzes on real charts, each followed by the same chart re-shown annotated with the reasoning, plus faded practice pages where the first steps are filled in and you finish the rest.
WHAT'S INSIDE
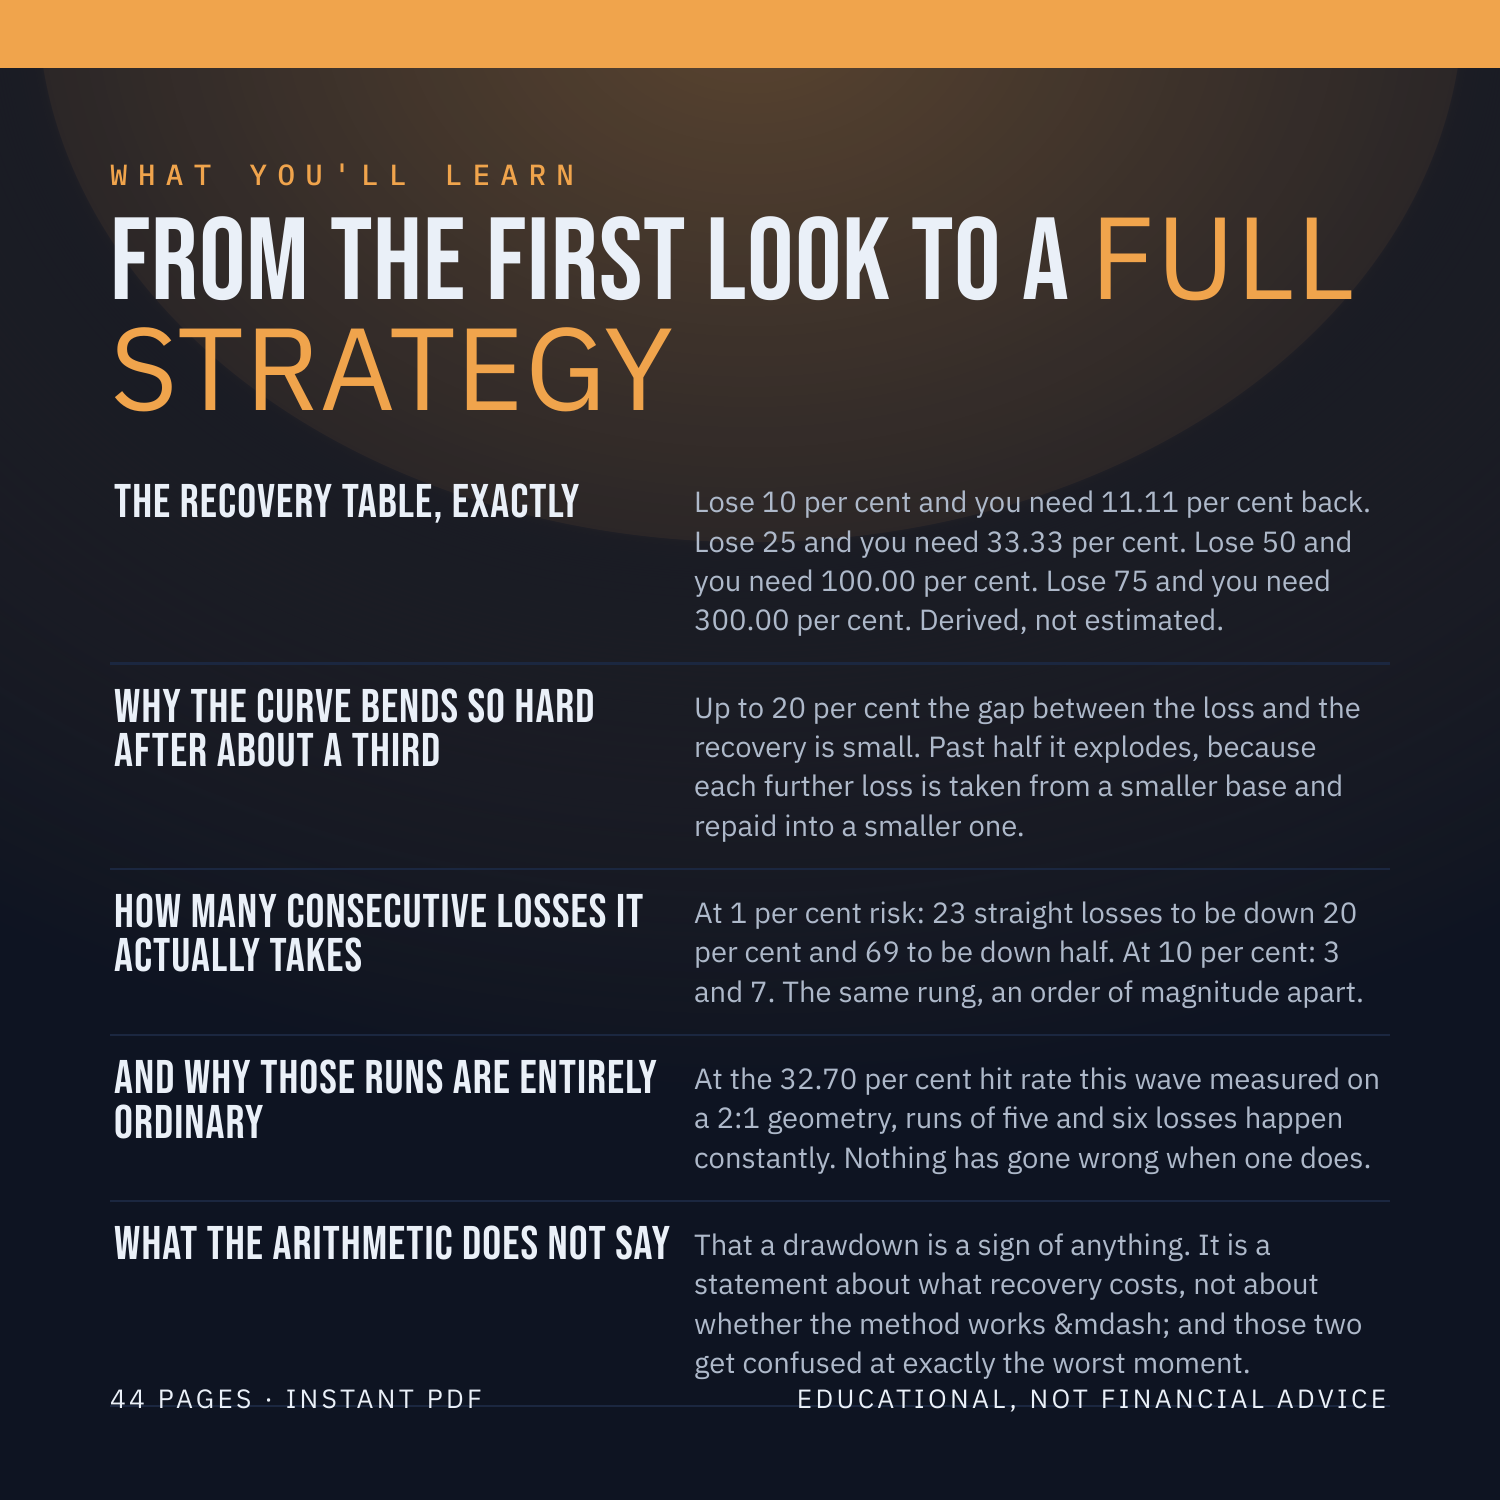
The recovery table, exactly -- Lose 10 per cent and you need 11.11 per cent back. Lose 25 and you need 33.33 per cent. Lose 50 and you need 100.00 per cent. Lose 75 and you need 300.00 per cent. Derived, not estimated.
Why the curve bends so hard after about a third -- Up to 20 per cent the gap between the loss and the recovery is small. Past half it explodes, because each further loss is taken from a smaller base and repaid into a smaller one.
How many consecutive losses it actually takes -- At 1 per cent risk: 23 straight losses to be down 20 per cent and 69 to be down half. At 10 per cent: 3 and 7. The same rung, an order of magnitude apart.
And why those runs are entirely ordinary -- At the 32.70 per cent hit rate this wave measured on a 2:1 geometry, runs of five and six losses happen constantly. Nothing has gone wrong when one does.
What the arithmetic does NOT say -- That a drawdown is a sign of anything. It is a statement about what recovery costs, not about whether the method works -- and those two get confused at exactly the worst moment.
WHAT YOU'LL BE ABLE TO DO
Compute the gain needed to recover any loss in one division.
Say how many consecutive losses your risk setting can absorb.
Tell an ordinary losing run from evidence of a broken method.
Explain why the recovery curve bends where it does.
Spot a performance claim that quotes a return without a drawdown.
AN HONEST NOTE
Drawdown is a clue, not a crystal ball. It describes what price has already done. This guide contains no win-rates, no backtest results and no promises about what you will make, because nobody can verify those and you should not trust anyone who prints them. What it hands you instead is a set of rules you can test yourself on TradingView in an afternoon. Educational, not financial advice.
Instant download. 44 pages, PDF.