Vsk Revolution Fleet Performance (Average Speeds / Leg Times)
User Manual for VSK Revolution™ Fleet Performance (Average Speeds / Leg Times)
Introduction
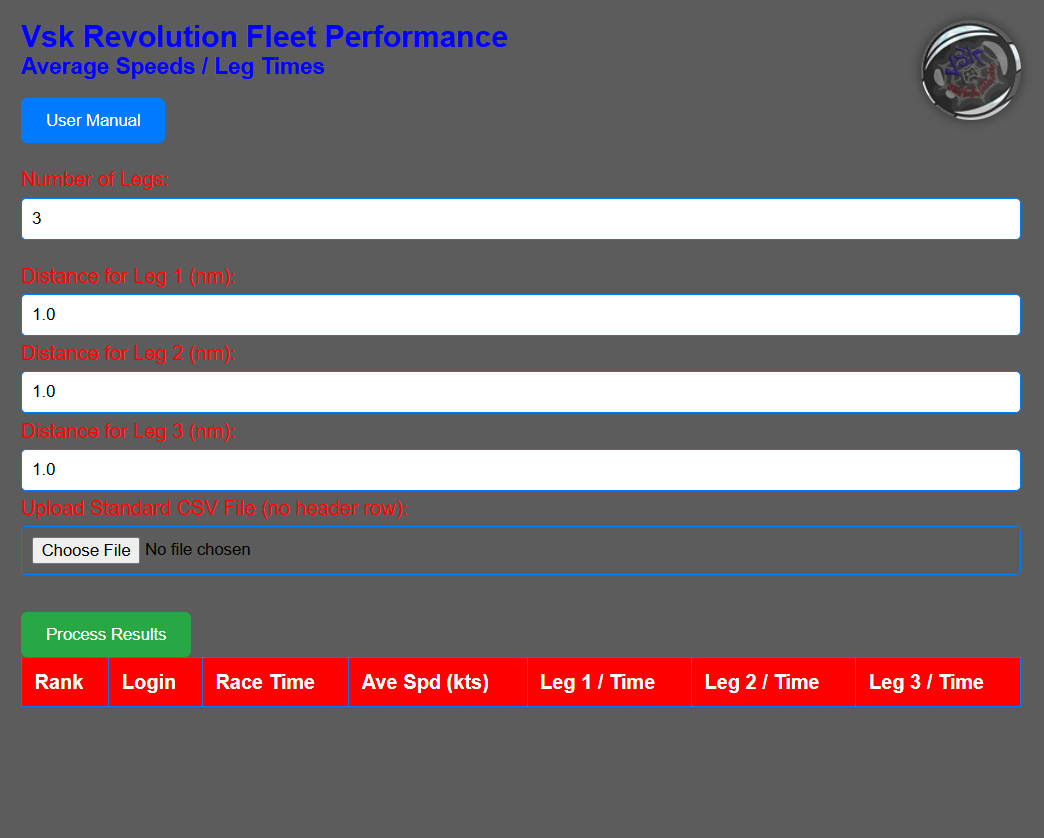
Welcome to the VSK Revolution™ Fleet Performance (Average Speeds / Leg Times) web application. This tool is designed to assist racers in evaluating and visualizing performance data for Vsk5Offline and Vsk Revolution. The application provides dynamic input fields for race leg distances, processes race results uploaded in CSV format, and displays performance metrics both in a table and through visual charts.
Features Overview
- Dynamic Leg Distance Inputs
- CSV File Upload for Race Results
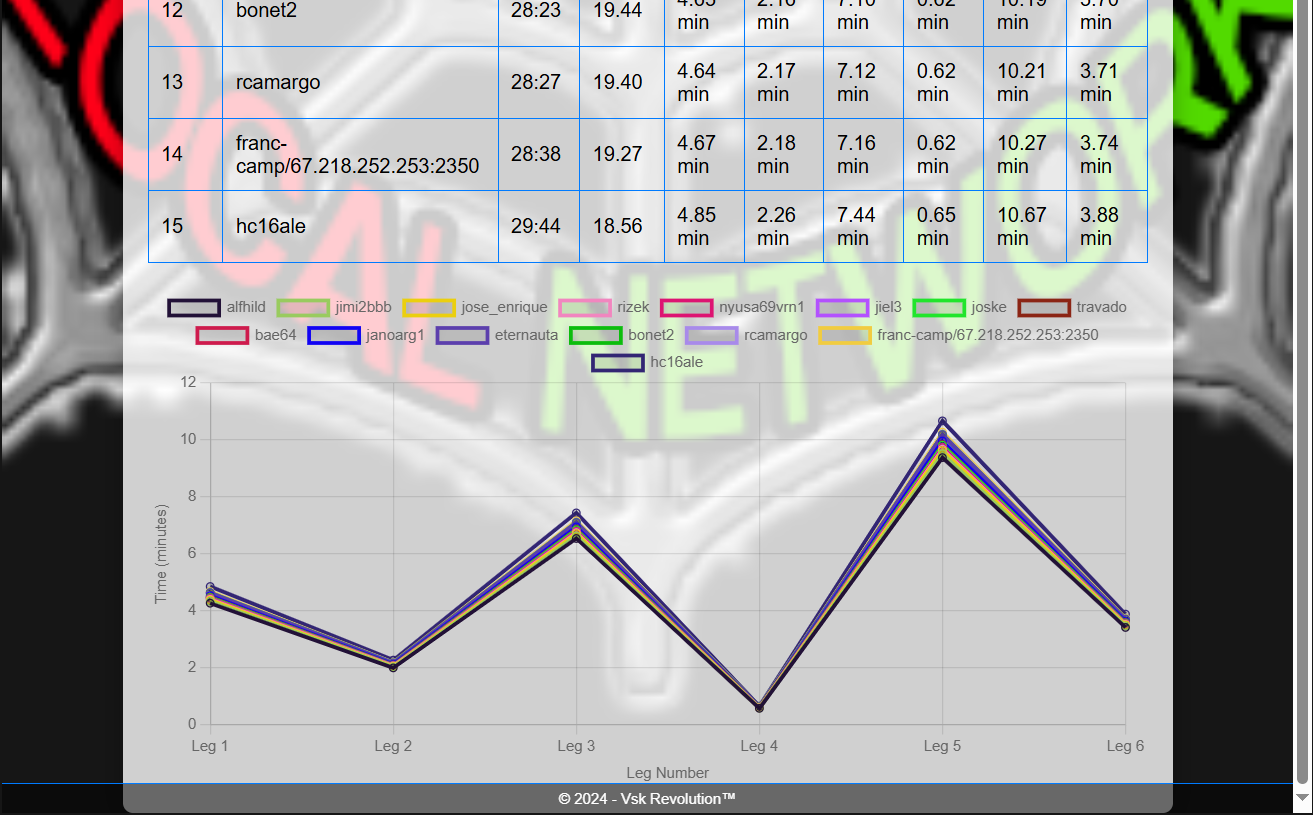
- Performance Metrics Table
- Performance Visualization Chart
Feature Details
1. Dynamic Leg Distance Inputs
- Description: Allows users to configure the number of legs in a race and input the distance for each leg dynamically.
- Components:
- Number of Legs Input:
- Location: In the input section, labeled “Number of Legs”.
- Function: This numeric input allows users to specify the number of legs in the race.
- Constraints: Minimum value is 1. The input is validated to accept integer values only.
- Leg Distance Inputs:
- Location: Below the Number of Legs input field.
- Function: Provides fields for users to enter the distance for each leg. These fields are dynamically generated based on the number of legs specified.
- Constraints: Each input field accepts decimal numbers, with a minimum value of 0 and a step of 0.1 nm.
- Behavior:
- When the number of legs is changed, the application recalculates and updates the distance inputs. Old fields are removed and new fields are added as necessary.
2. CSV File Upload for Race Results
- Description: Enables users to upload a CSV file containing race data for analysis.
- Components:
- File Upload Input:
- Location: In the inputs section, labeled “Upload Race Results CSV”.
- Function: Allows users to select a CSV file from their device.
- Constraints: The file must be in CSV format and should include specific columns for race data.
- Processing Button:
- Location: Below the file upload input, labeled “Process Results”.
- Function: Initiates the process of reading and analyzing the uploaded CSV file.
- Behavior: The application reads the file, parses the data, and updates the performance metrics table and chart.
3. Performance Metrics Table
- Description: Displays detailed performance metrics from the processed race data in a tabular format.
- Components:
- Table Headers:
- Columns:
- Rank: The position of the racer based on their finishing time.
- Player Login: Identifier for the racer.
- Total Race Time: The total time taken by the racer, formatted as MM
- .
- Total Average Speed: Average speed in knots (nm/h).
- Leg Times: Time taken for each leg of the race, displayed in minutes.
- Behavior:
- The table is dynamically updated based on the number of legs and data from the uploaded CSV file. Columns are added for each leg time according to the number of legs specified.
4. Performance Visualization Chart
- Description: Provides a graphical representation of performance data for each racer across the legs of the race.
- Components:
- Chart Type: Line chart.
- Axes:
- X-Axis: Represents the legs of the race, labeled “Leg 1”, “Leg 2”, etc.
- Y-Axis: Represents the time taken in minutes, with a title “Time (minutes)”.
- Dataset:
- Each racer's performance is represented by a line on the chart, with different colors for each racer.
- Behavior:
- The chart is updated whenever the CSV file is processed, reflecting the performance data for all racers.
User Interface Elements
- Header:
- Title: “VSK Revolution™ Performance Curves” displayed prominently at the top of the page.
- Subtitle: “Leg Times & Average Speeds” provides context for the data displayed.
- Container:
- Icon:
- Location: Top-right corner.
- Function: Serves as a branding element. Displays a background image related to the application.
- Inputs Section:
- Contains fields for entering the number of legs, leg distances, and uploading the CSV file.
- Process Button: Triggers the processing of the uploaded file and updates the results.
How to Use the Application
- Configure Leg Distances:
- Enter the number of legs in the “Number of Legs” field.
- Input the distance for each leg in the dynamically generated fields below. Ensure all distances are in nautical miles.
- Upload Race Results:
- Click on the “Upload Race Results CSV” button to select a CSV file.
- Make sure the CSV file contains the correct format with columns for rank, total race time, and player login.
- Process Results:
- Click the “Process Results” button to analyze the uploaded data.
- The application will parse the CSV file, compute necessary metrics, and update both the table and chart.
- View Performance Metrics:
- Check the performance metrics table for detailed information on each racer, including total race time, average speed, and leg-specific times.
- Analyze Performance Trends:
- Use the performance chart to visually compare the performance of different racers across the legs of the race.
Technical Specifications
- Browser Compatibility: Works with modern web browsers that support HTML5, CSS3, and JavaScript.
- File Size Limitations: Large CSV files may affect performance. It’s recommended to use files that are reasonably sized to ensure smooth operation.
- Data Validation: Input fields for leg distances must be valid numbers, and the CSV file must adhere to the expected format.
Troubleshooting
- No Data Displayed:
- Ensure the CSV file is properly formatted and contains the correct columns.
- Verify that the number of legs is set correctly and that distances are entered.
- Error Messages:
- If an error occurs during file processing, check the format of the CSV file and ensure it’s not corrupted.
- Chart Not Updating:
- Refresh the page and try re-uploading the file if the chart does not reflect recent data.


