



Personal Portfolio Dashboard
On Sale
$5.00
$5.00
Personal Portfolio Dashboard
Elevate your investment experience with the Personal Portfolio Dashboard, a sleek, all-in-one platform designed to give you real-time insights and total control over your holdings.
Key Features:
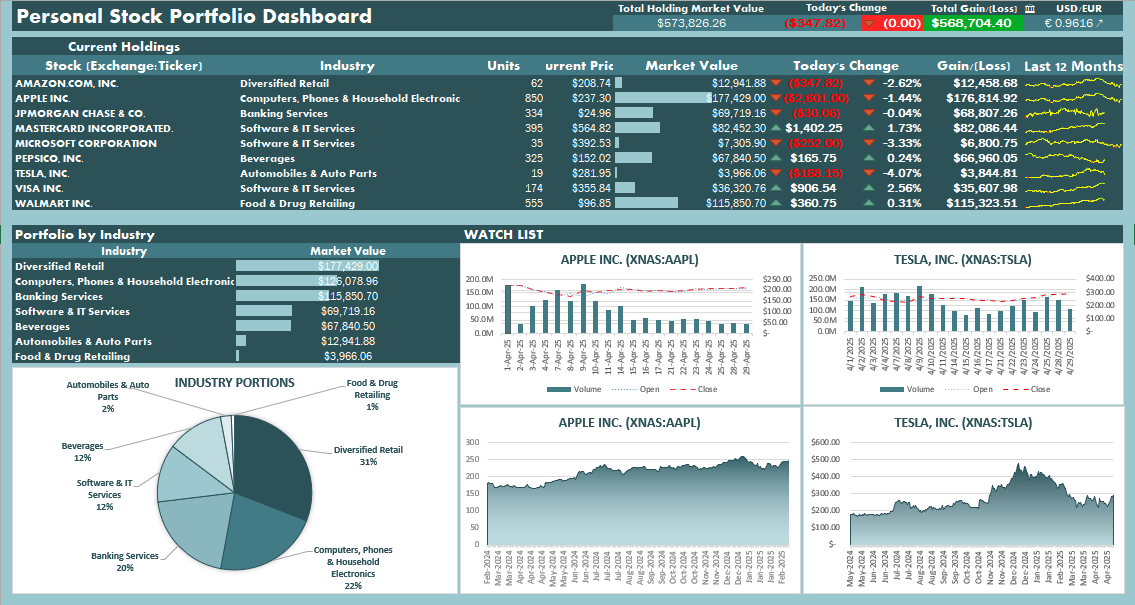
- Comprehensive Overview: View your current positions at a glance—stock tickers, industry classifications, unit counts, current price, market value, today’s gains/losses, and 12-month performance trends—all on one screen.
- Live Market Metrics: Track your total portfolio market value, daily change, and cumulative gain/loss in real time. Instantly spot performance shifts with intuitive color-coded indicators and sparklines.
- Industry Breakdown: Dive into detailed analytics with a dynamic bar chart and pie chart that reveal exactly how your capital is allocated across industries—from diversified retail and tech to banking services and consumer staples.
- Watch List Insights: Monitor potential buys with dedicated mini-dashboards for your watch-list tickers. Each card displays recent volume, open/close price trends, and daily bar charts so you can identify trading opportunities before they slip away.
- Historical Performance Charts: Analyze price evolution for key holdings like AAPL and TSLA with full-width area charts, tracking their journey from months past to present. Spot support/resistance levels and trend shifts to inform your buy, hold, or sell decisions.
- User-Friendly Interface: Easily switch between the Dashboard, Transactions, Watch List, and individual ticker tabs (AAPL, TSLA, etc.) for rapid deeper dives. Responsive design ensures seamless use on desktop or tablet.
Whether you’re a seasoned trader or building your first portfolio, the Personal Portfolio Dashboard combines clarity, speed, and depth to help you make smarter, data-driven investment choices.