
VarianceView — Budget vs Actual Variance Dashboard (Excel/Sheets)
See exactly where you're over budget, instantly.
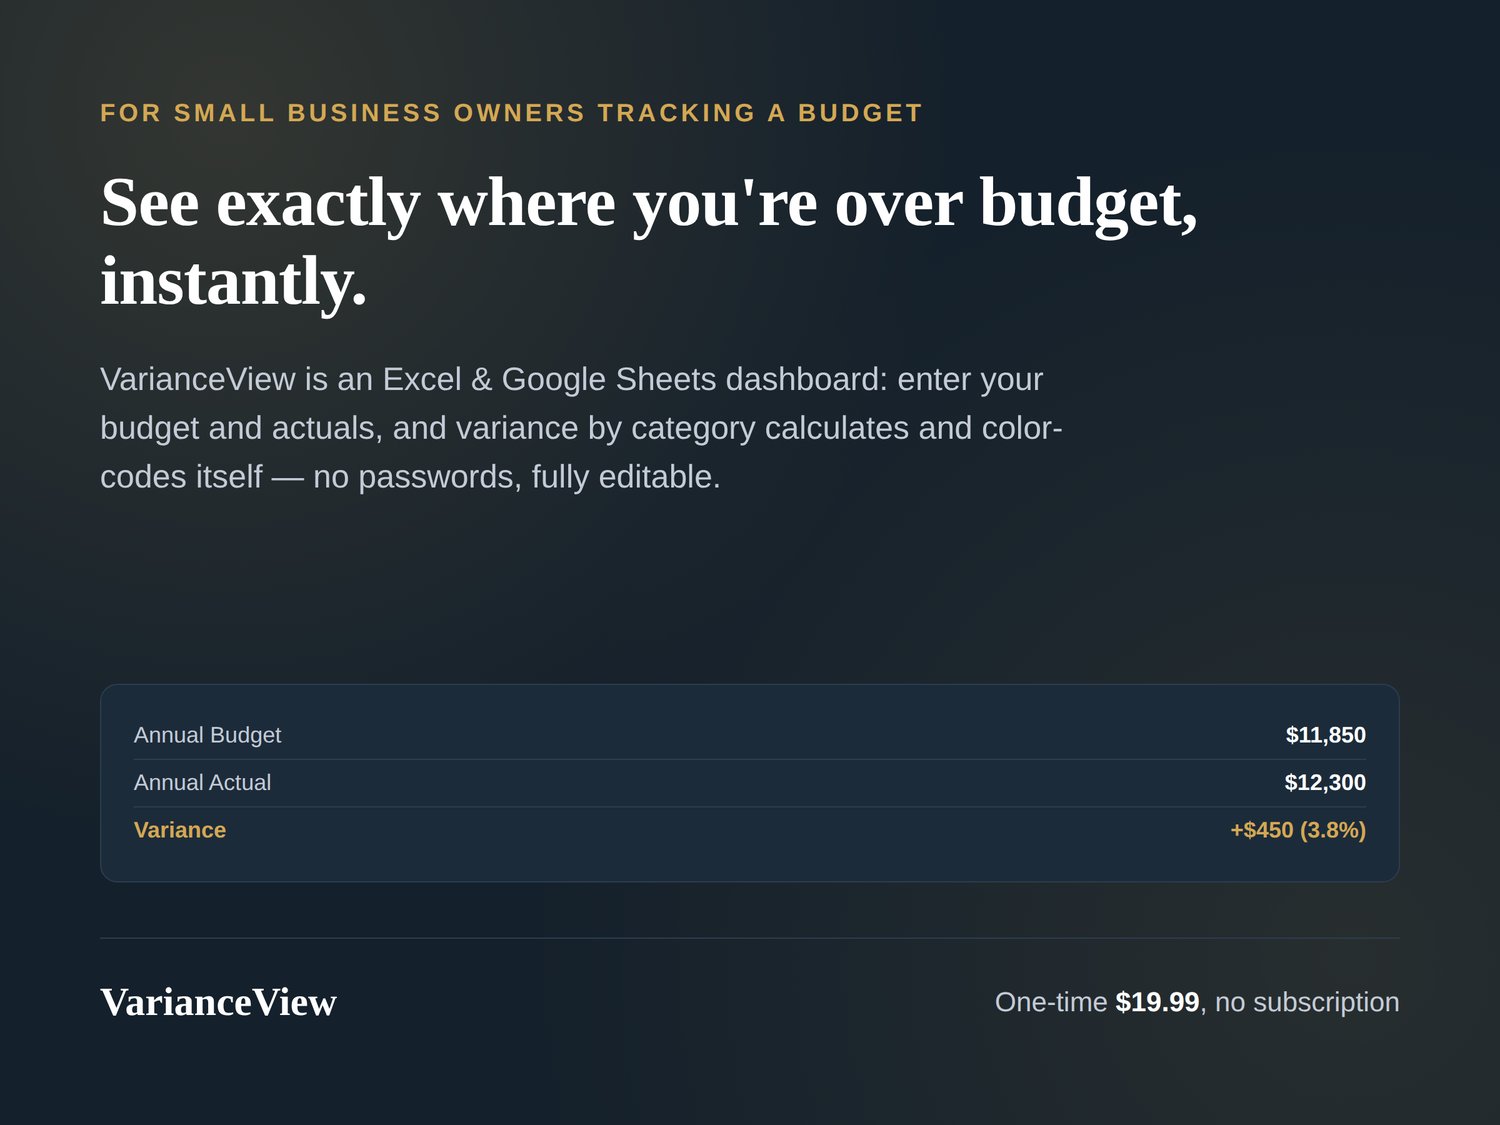
VarianceView is a simple Excel & Google Sheets workbook for small business owners tracking a budget: enter your planned budget and your actual spend by category and month, and the variance — in dollars and percent — calculates and color-codes itself.
What's inside:
Budget Input — your planned spend by category, by month
- Actuals Input — what you actually spent, by the same categories and months
- - Variance Dashboard — the difference between budget and actual, color-coded (green = at/under, red = over) and charted automatically
No account, no login, no subscription. Every formula is fully open and editable — no passwords, unlike some competing templates. Works in Excel, Google Sheets, and LibreOffice Calc.
Pairs naturally with DeptCompare: VarianceView tracks one entity's budget over time; DeptCompare compares multiple departments against each other.
Delivered instantly after checkout as an editable .xlsx workbook, along with a quick-start guide.
This is a budgeting convenience tool, not accounting or tax advice — for anything filed with a tax authority, please check with a qualified professional.