







Market Structure Explained — Measured (PDF Guide)
You learned that an uptrend is higher highs and higher lows, and it made immediate sense. Then you marked a live chart and the sequence kept breaking after two swings, so you started deciding which swings counted - and at that point you were no longer following a rule, you were drawing the answer you wanted.
This guide applies the definition without mercy across 35,944 bars of real market history and reports what came back. 7,077 swings, 1,755 runs of clean structure, and a median run of 3 swings. The rule is not wrong; it is just describing something far shorter-lived than the way it is taught suggests. This is a 40-page PDF that teaches Market Structure from the first thing you see on the screen through to a written strategy with an entry, a stop and an explicit rule for when the trade is wrong.
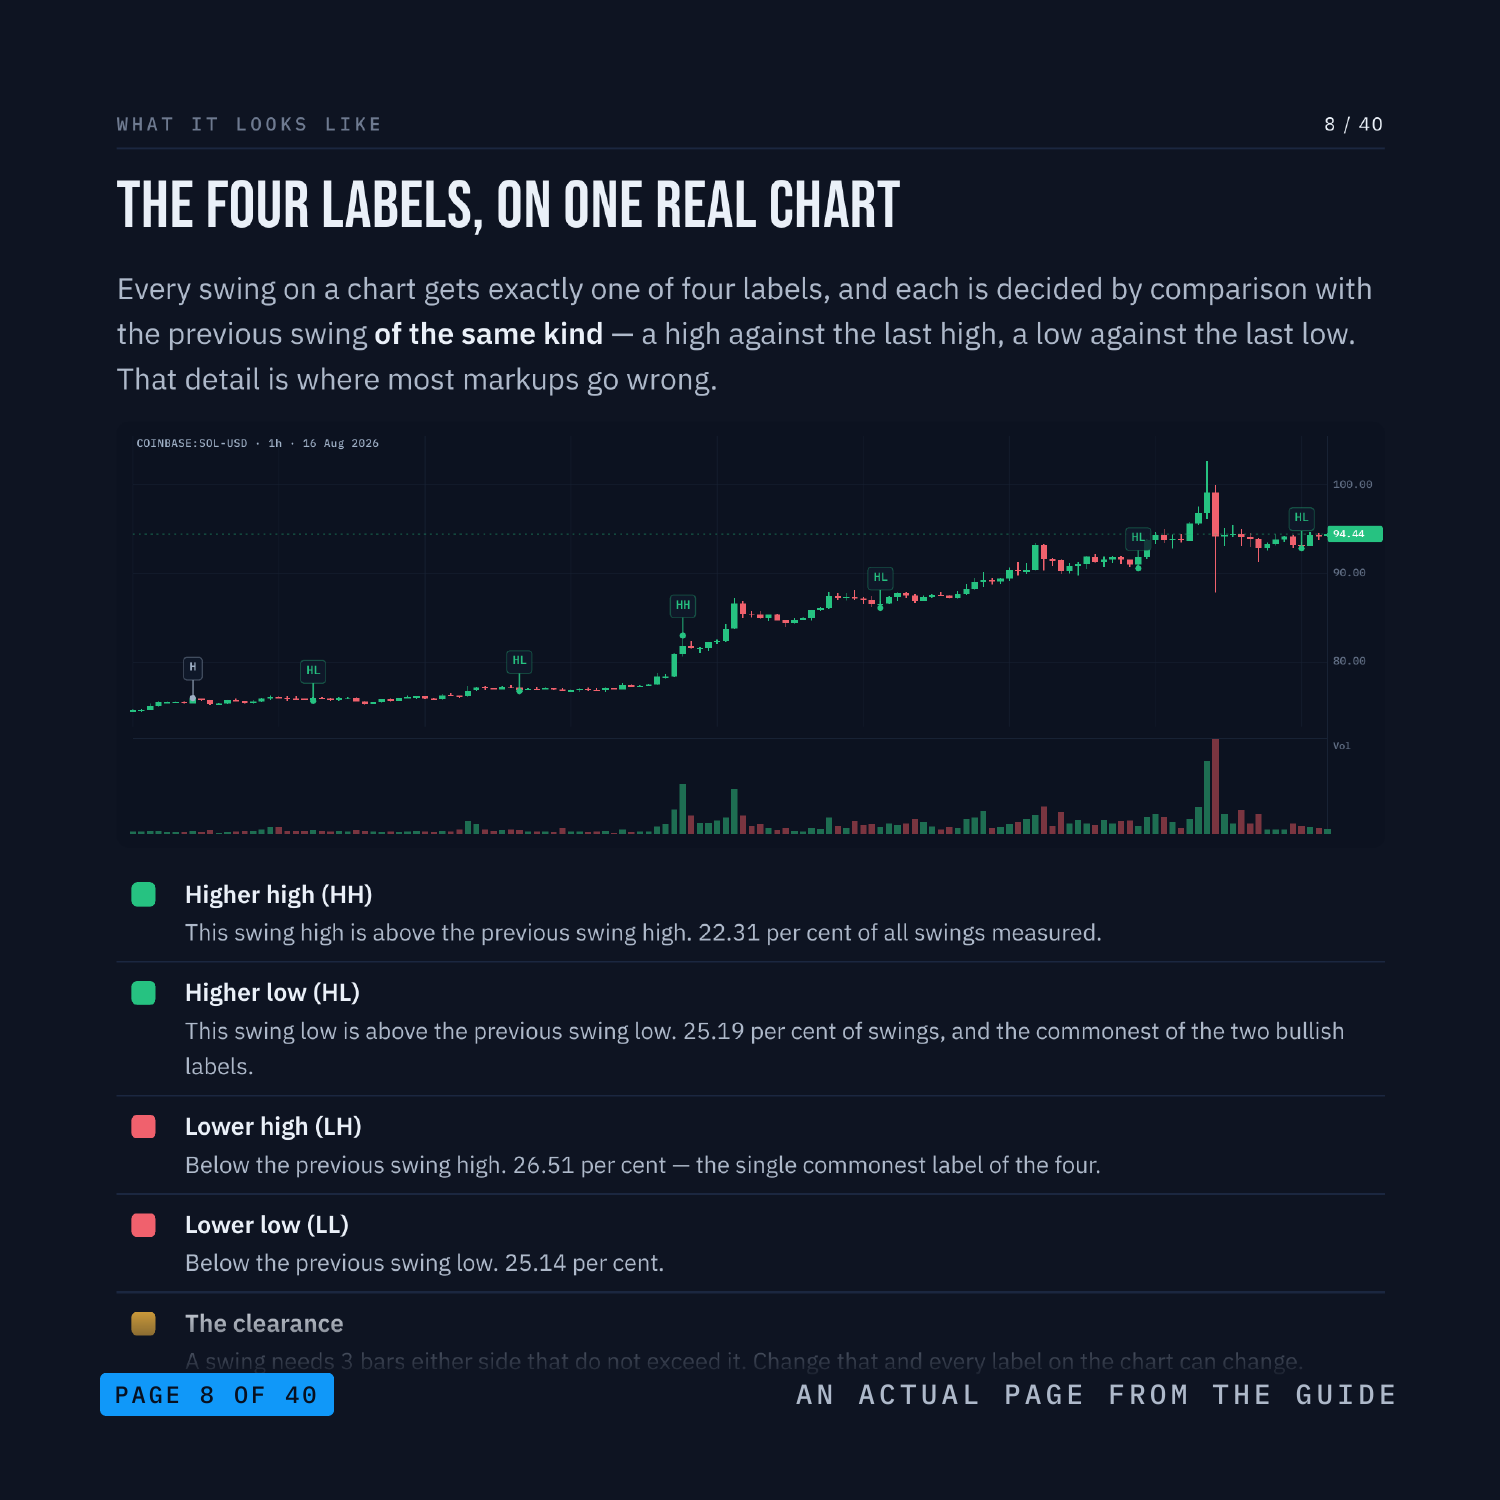
Nothing is taught underneath a chart. Every label sits on the candle, the line or the level it is describing, on real BTC, ETH, SOL and LINK charts. There are three quizzes on real charts, each followed by the same chart re-shown annotated with the reasoning, plus faded practice pages where the first steps are filled in and you finish the rest.
WHAT'S INSIDE
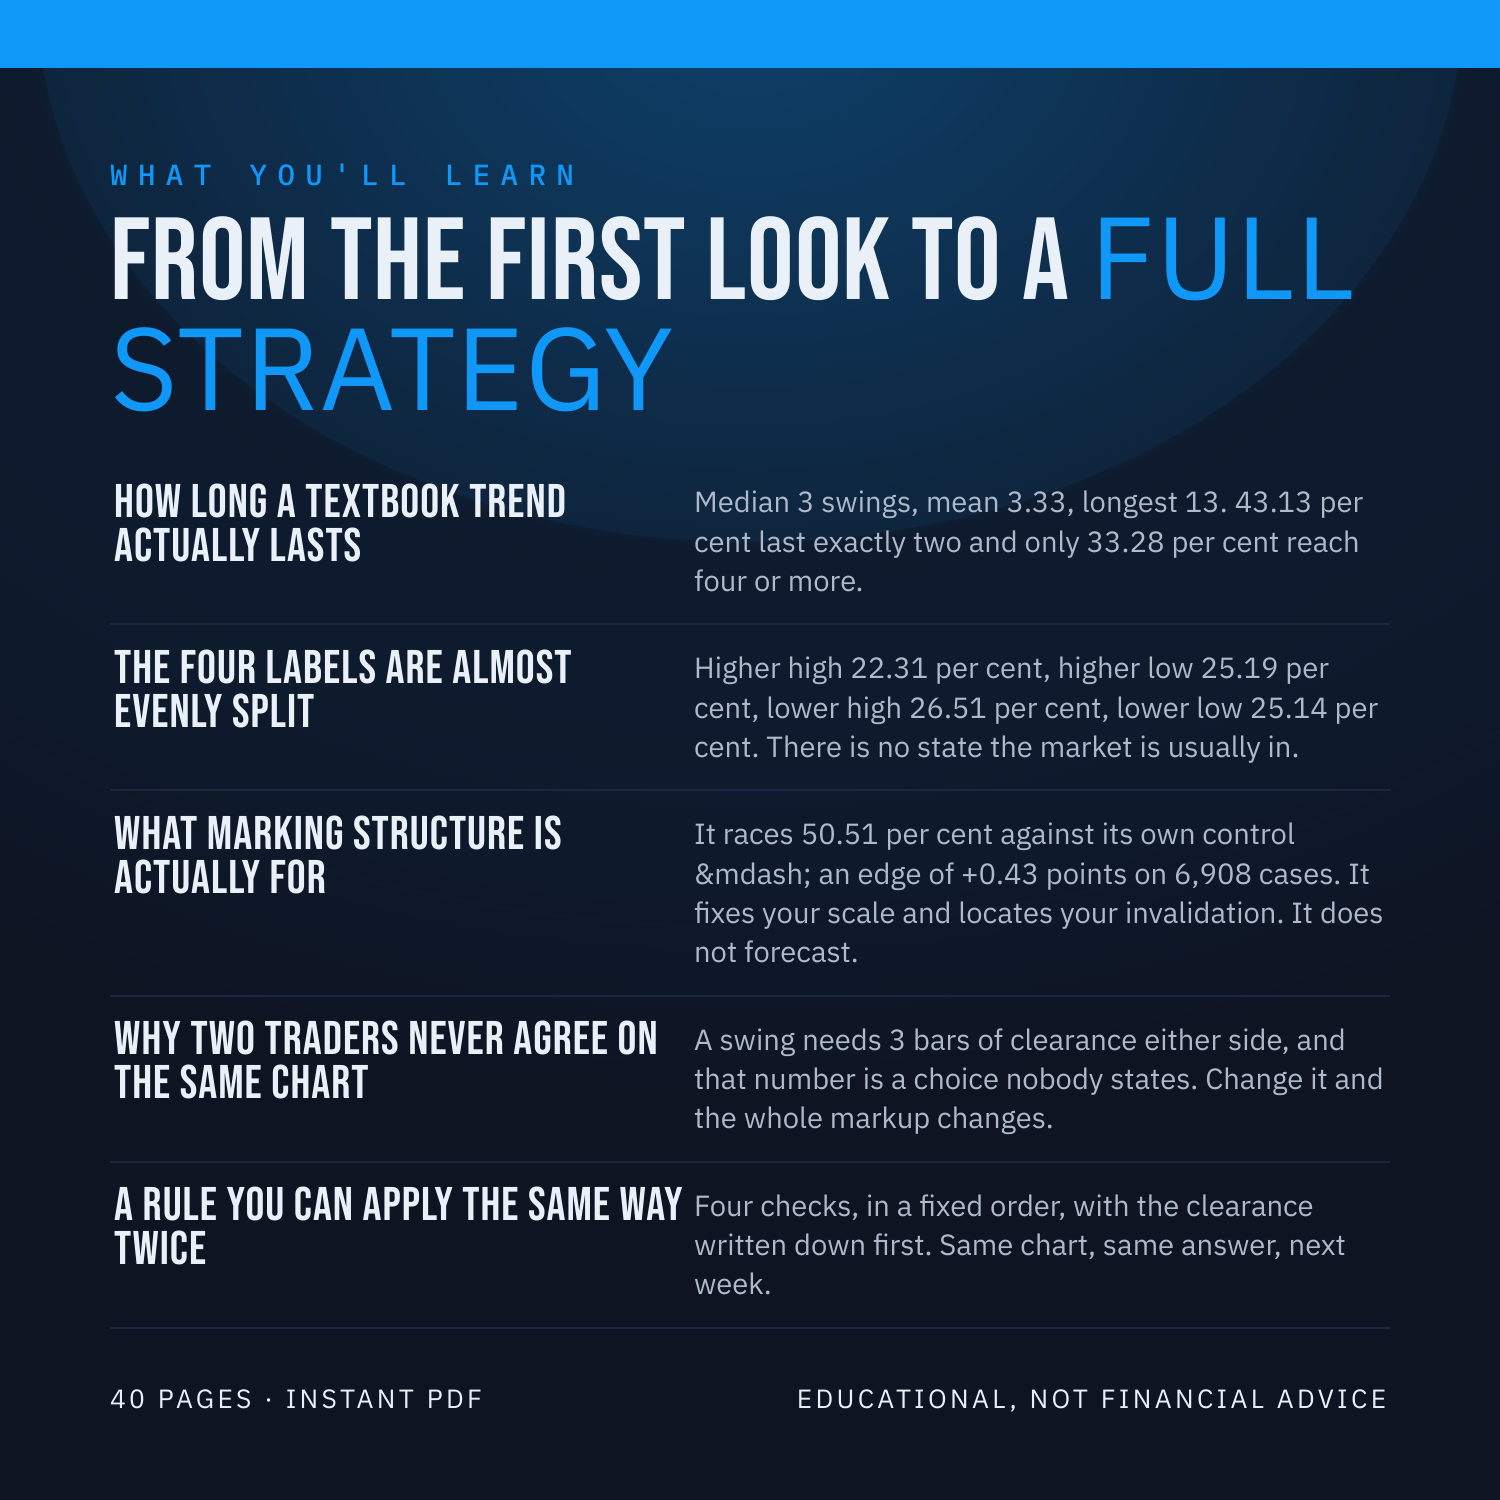
How long a textbook trend actually lasts - Median 3 swings, mean 3.33, longest 13. 43.13 per cent last exactly two and only 33.28 per cent reach four or more.
The four labels are almost evenly split - Higher high 22.31 per cent, higher low 25.19 per cent, lower high 26.51 per cent, lower low 25.14 per cent. There is no state the market is usually in.
What marking structure is actually for - It races 50.51 per cent against its own control, an edge of +0.43 points on 6,908 cases. It fixes your scale and locates your invalidation. It does not forecast.
Why two traders never agree on the same chart - A swing needs 3 bars of clearance either side, and that number is a choice nobody states. Change it and the whole markup changes.
A rule you can apply the same way twice - Four checks, in a fixed order, with the clearance written down first. Same chart, same answer, next week.
WHAT YOU'LL BE ABLE TO DO
Mark higher highs and lower lows by a written rule, not by eye.
State the clearance you used and why it matters.
Say how long a clean run of structure usually lasts.
Tell what structure is for from what it cannot do.
Read anyone else's markup and know what they chose.
AN HONEST NOTE
Market Structure is a clue, not a crystal ball. It describes what price has already done. This guide contains no win rates, no historical-test results and no promises about what you will make, because nobody can verify those and you should not trust anyone who prints them. What it hands you instead is a set of rules you can test yourself on TradingView in an afternoon. Educational, not financial advice.
Instant download. 40 pages, PDF.