


Cyclicality Analytics - MCX Index FTSE 250
On Sale
£0.00
Pay what you want:
£
Cyclicality Analytics for FTSE250 Stock Market Index.
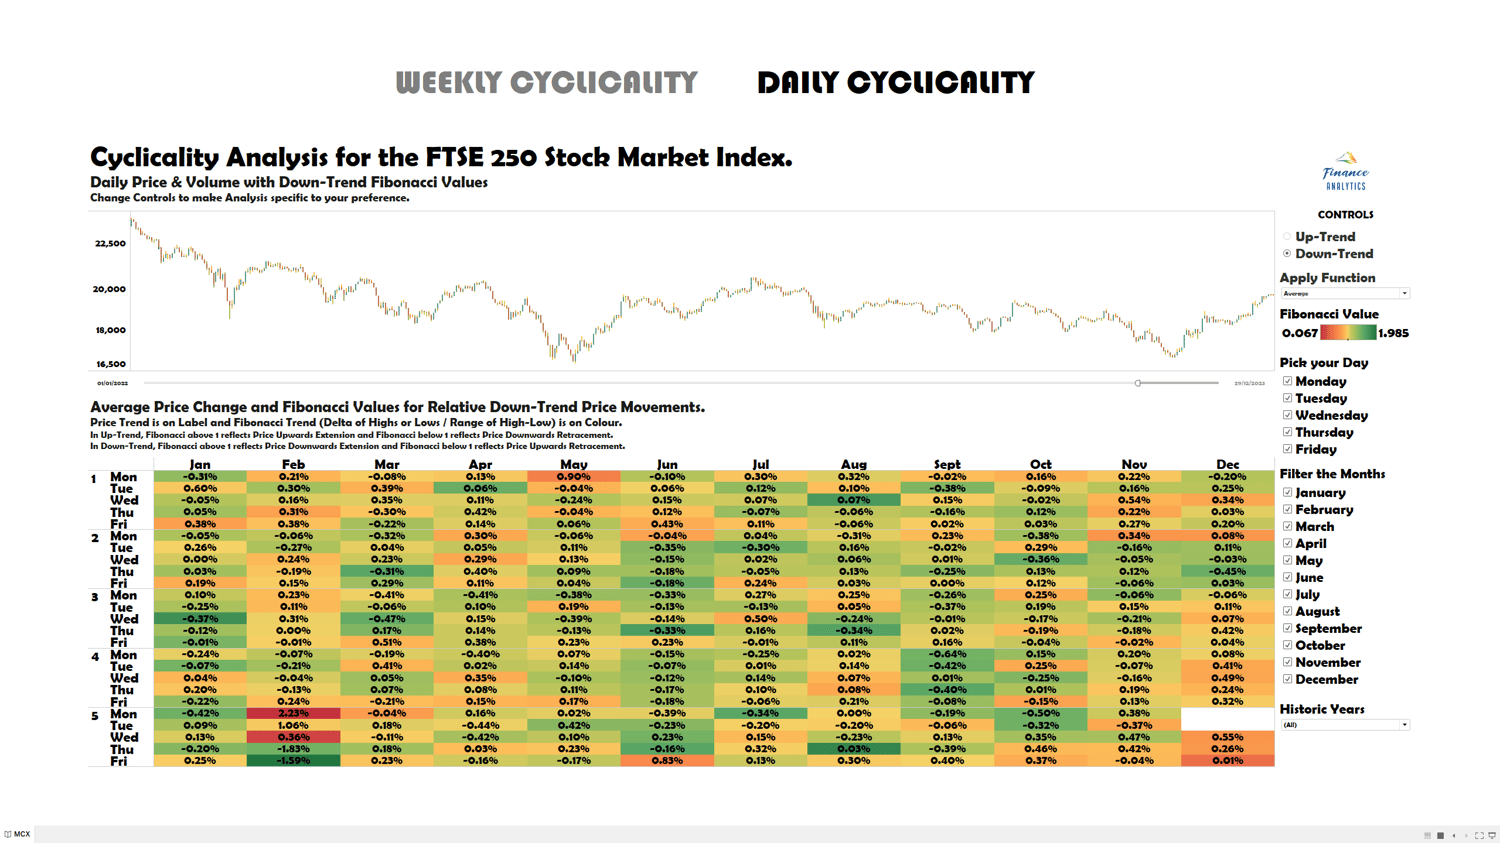
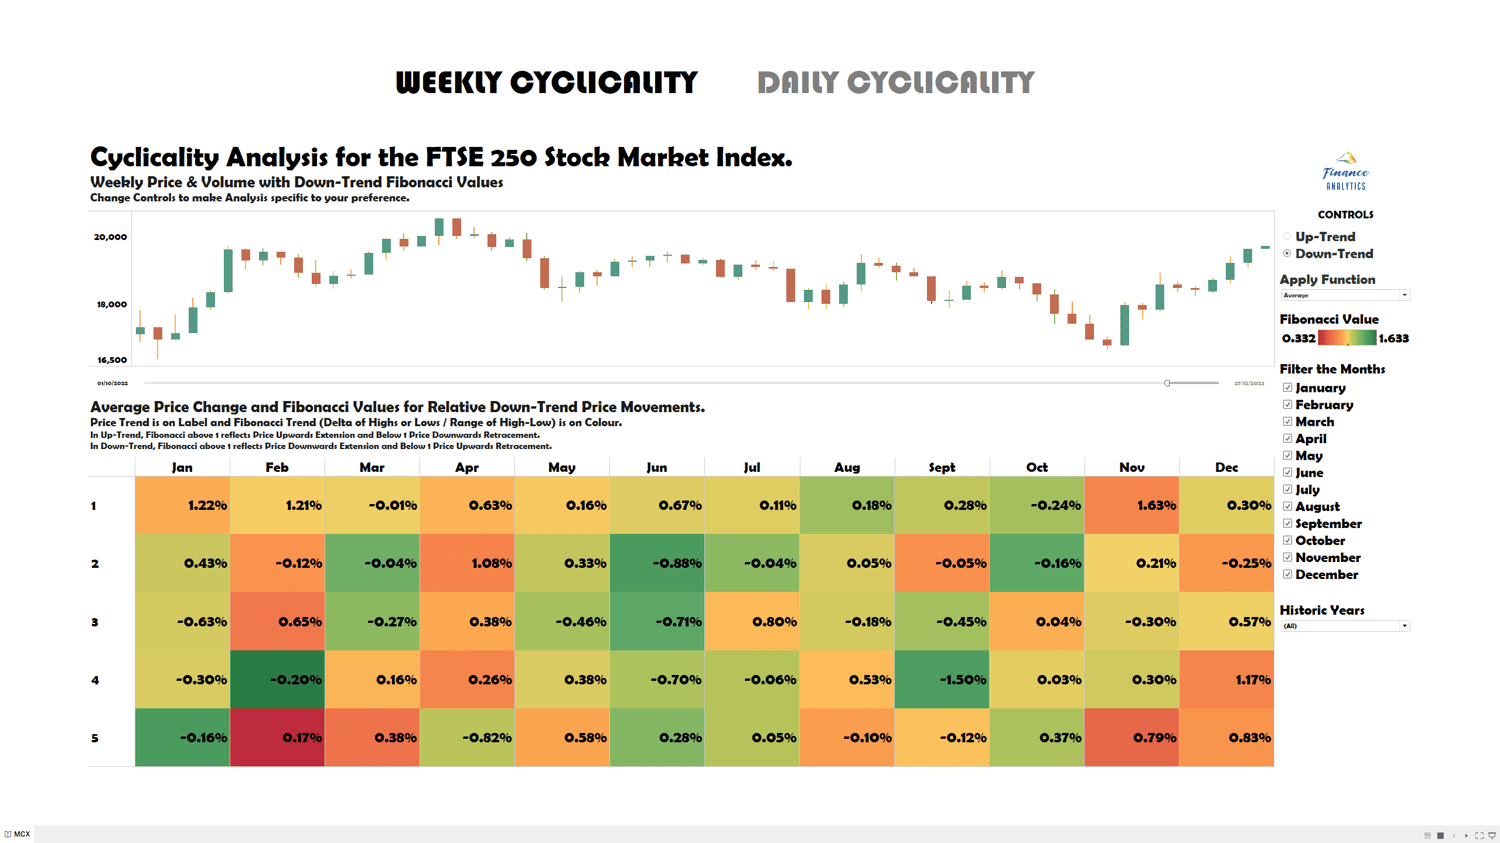
How to Interact with the Weekly and Daily Price-Volume Chart and investigate the Fibonacci Values?
The Heat-Map Labels Historical Price Performance, while presents favourable entry point periods with a Green Colour based on Fibonacci Values.
- Toggle Up-Trend | Down-Trend conditions depending on your market bias Long or Short
- In Uptrend/Long conditions, favourite periods where Fibonacci is Above 1 for Extension
- In Downtrend/Short conditions, favourite periods where Fibonacci is Above 1 for Extension
- Filter for Days, Weeks, Months and Years since Inception, to the latest records in Google Finance
- Apply 7 Mathematical Functions (Average, Median, Minimum, Maximum, Sample Size, Standard Deviation, Variance)
How Fibonacci is Calculated
During Up-Trend the Price needs to be BELOW Previous Day's HIGH for a Fibonacci Retracement and ABOVE Previous Day's HIGH for a Fibonacci Extension Value.
During Down-Trend the Price needs to be ABOVE Previous Day's LOW for a Fibonacci Retracement and BELOW Previous Day's LOW for a Fibonacci Extension Value.
In Up-Trend, Fibonacci above 1 reflects Price Upwards Extension and Below 1 Price Downwards Retracement.
In Down-Trend, Fibonacci above 1 reflects Price Downwards Extension and Below 1 Price Upwards Retracement.