




Shooting Star Explained — What it signals (PDF Guide)
You were taught the shooting star is a bearish reversal: a long upper wick after a rally, sellers rejecting the highs, the move is over. It is one of the most recognisable candles in the subject and one of the most confidently taught. Measured against a control on 35,944 bars, it does not do what it says.
One symmetric test, run identically on every pattern in the wave. The shooting star reached its promised downside 46.23 per cent of the time against a 51.89 control — -5.65 points on 703 cases, z = -3.00. It is the only one of 18 tests to survive correction, and this guide spends as much time on why that is not a trading signal as on the result itself. This is a 39-page PDF that teaches Shooting Star from the first thing you see on the screen through to a written strategy with an entry, a stop and an explicit rule for when the trade is wrong.
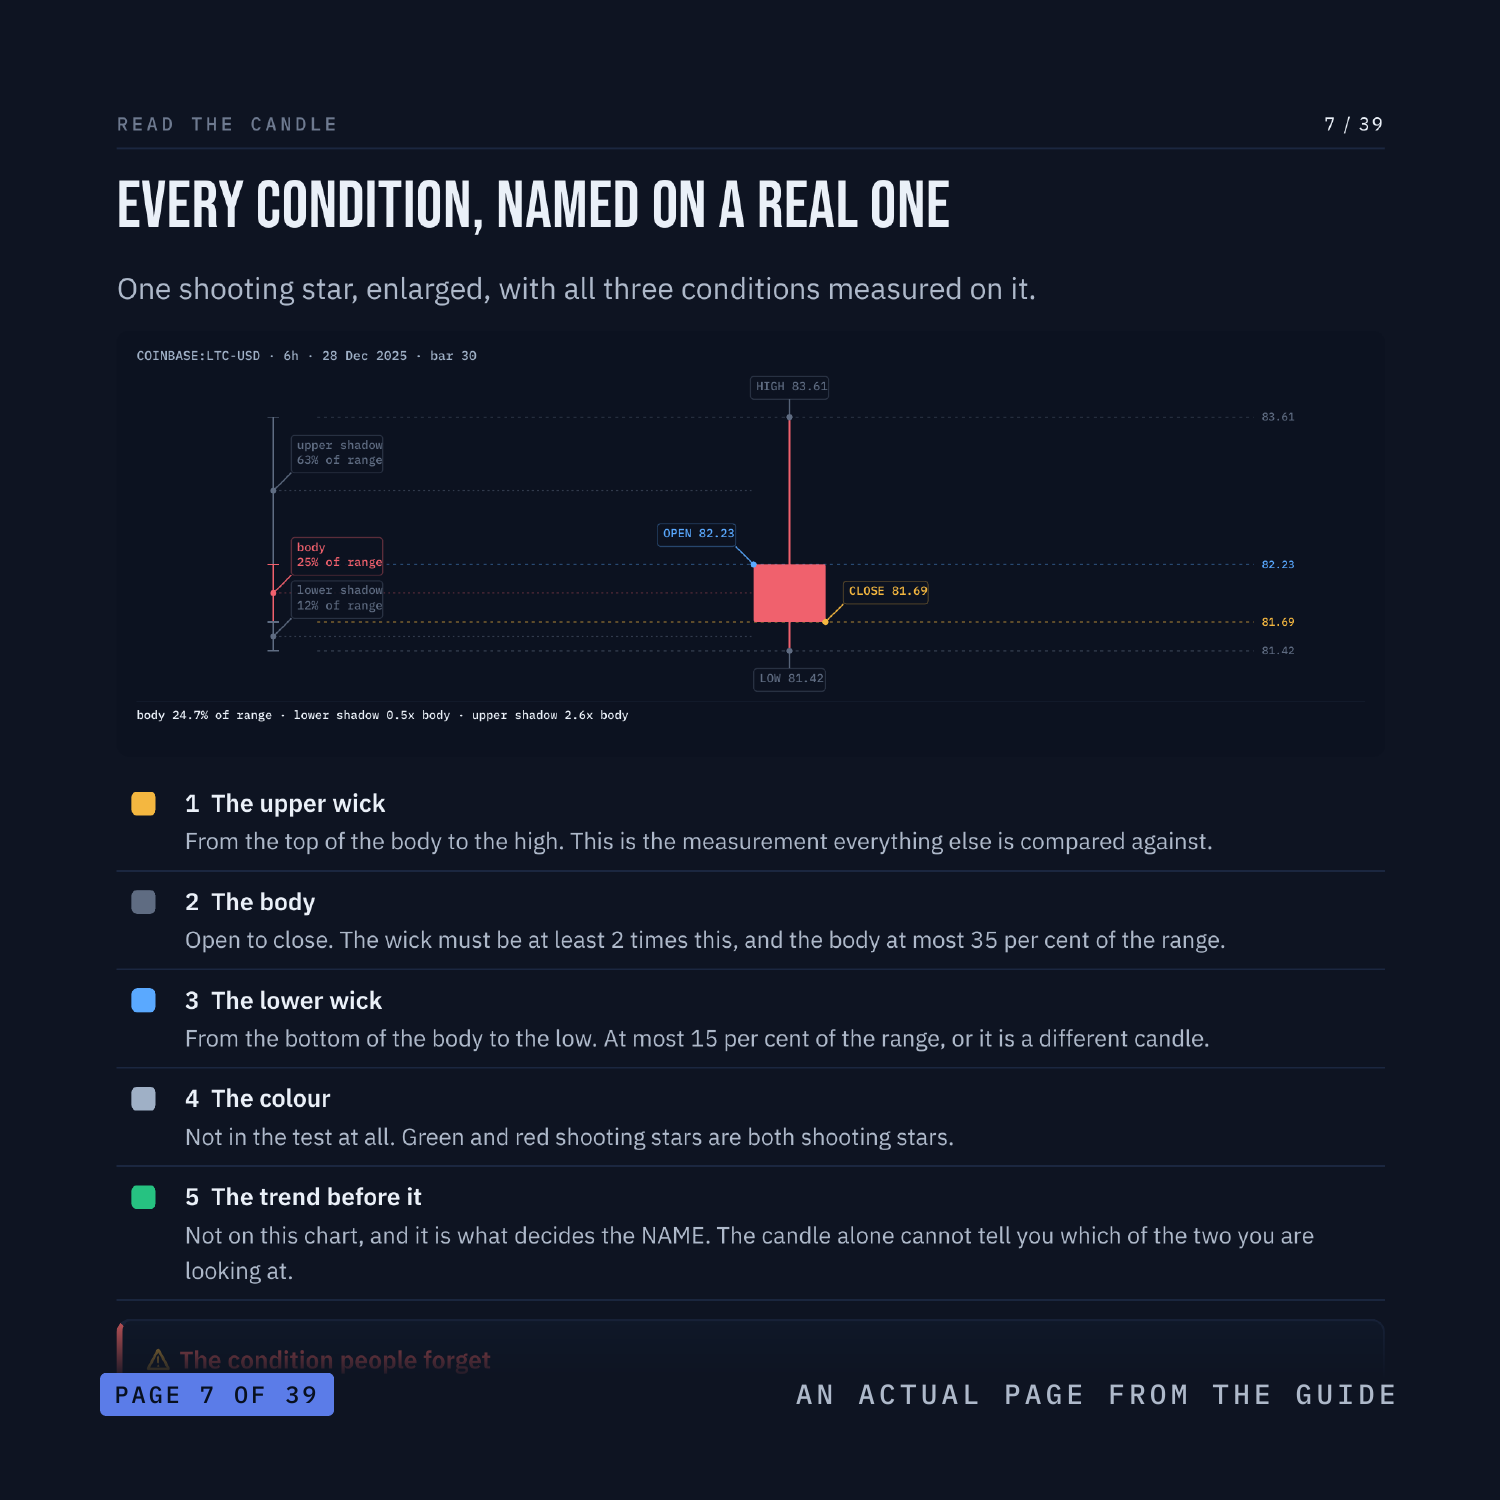
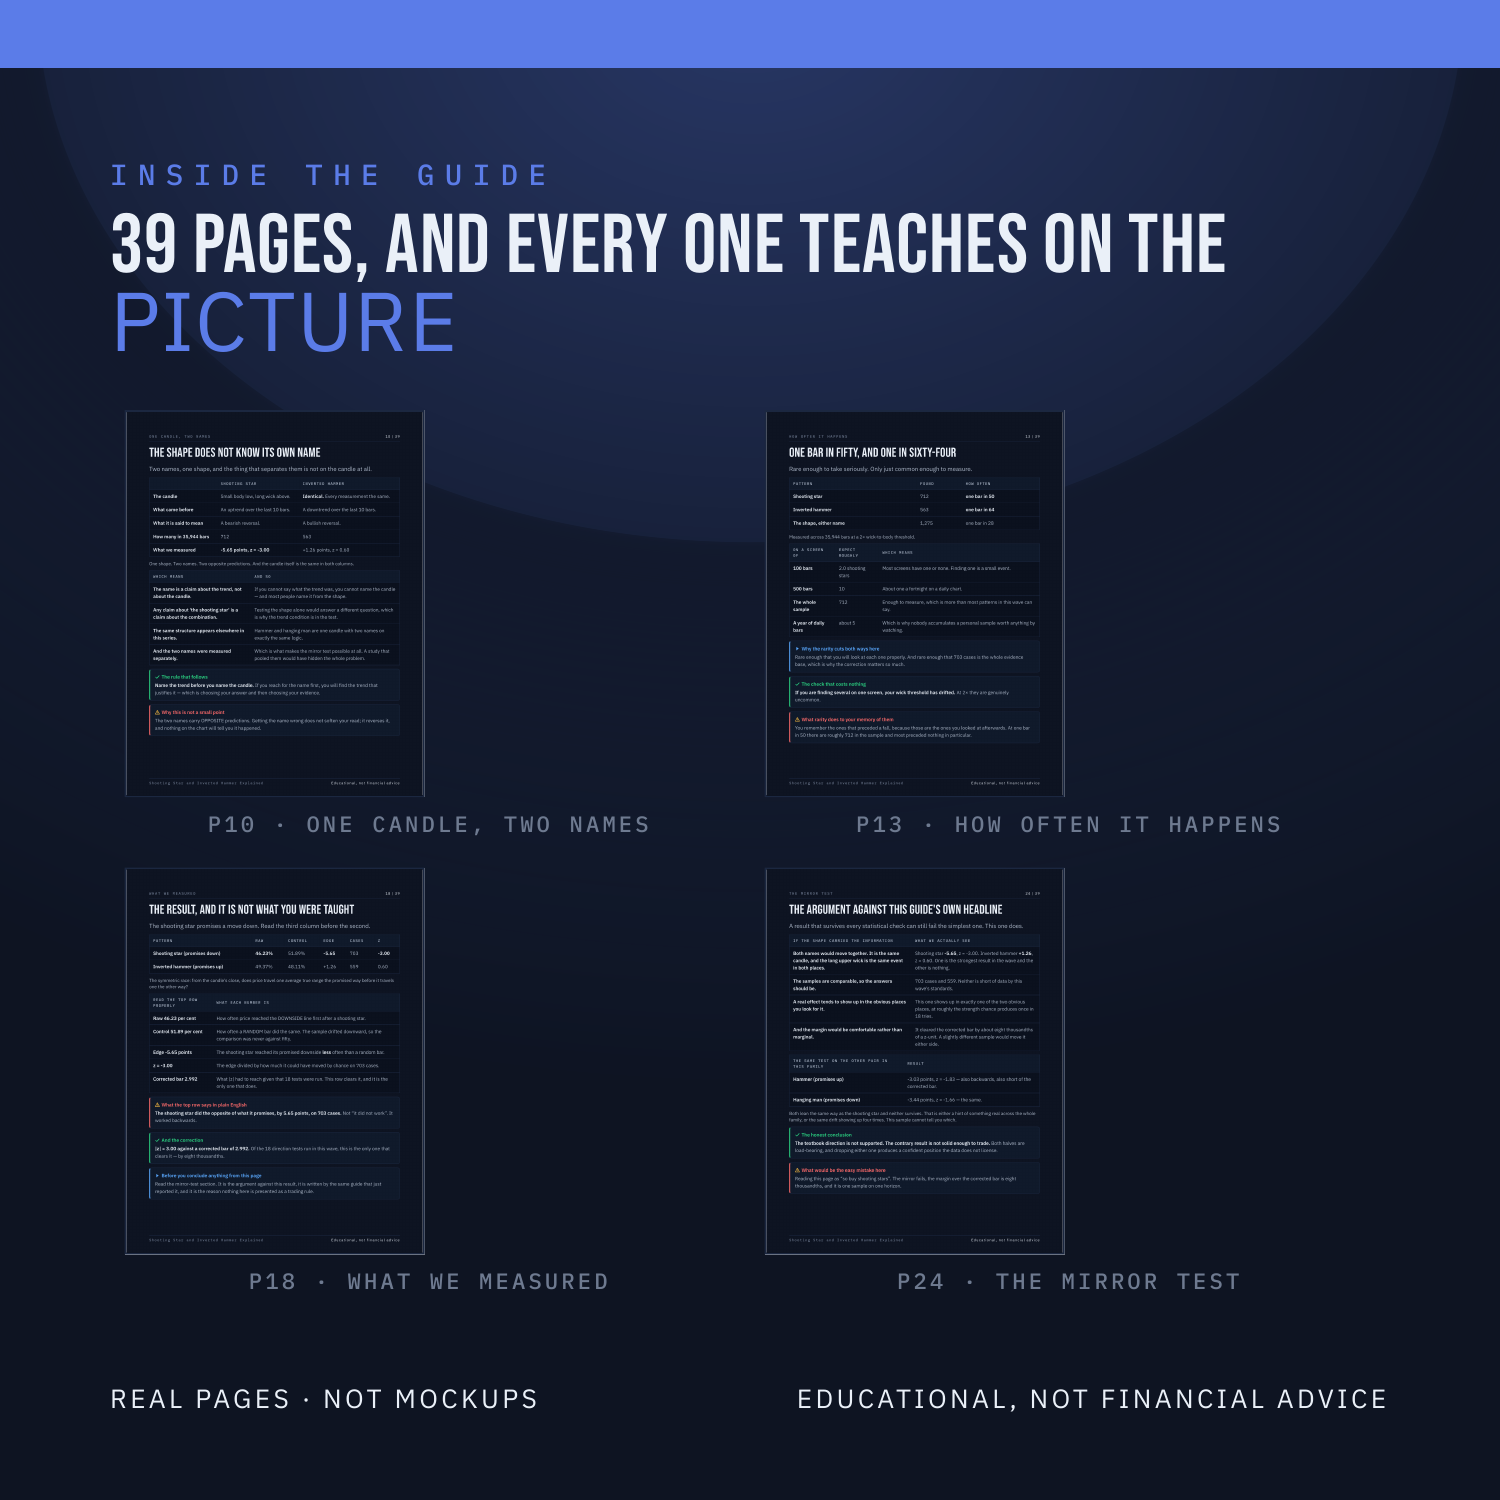
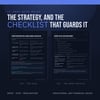
Nothing is taught underneath a chart. Every label sits on the candle, the line or the level it is describing, on real BTC, ETH, SOL and LINK charts, with the wick and body measurements printed on the candles. There are three quizzes on real charts, each followed by the same chart re-shown annotated with the reasoning, plus faded practice pages where the first steps are filled in and you finish the rest.
WHAT'S INSIDE
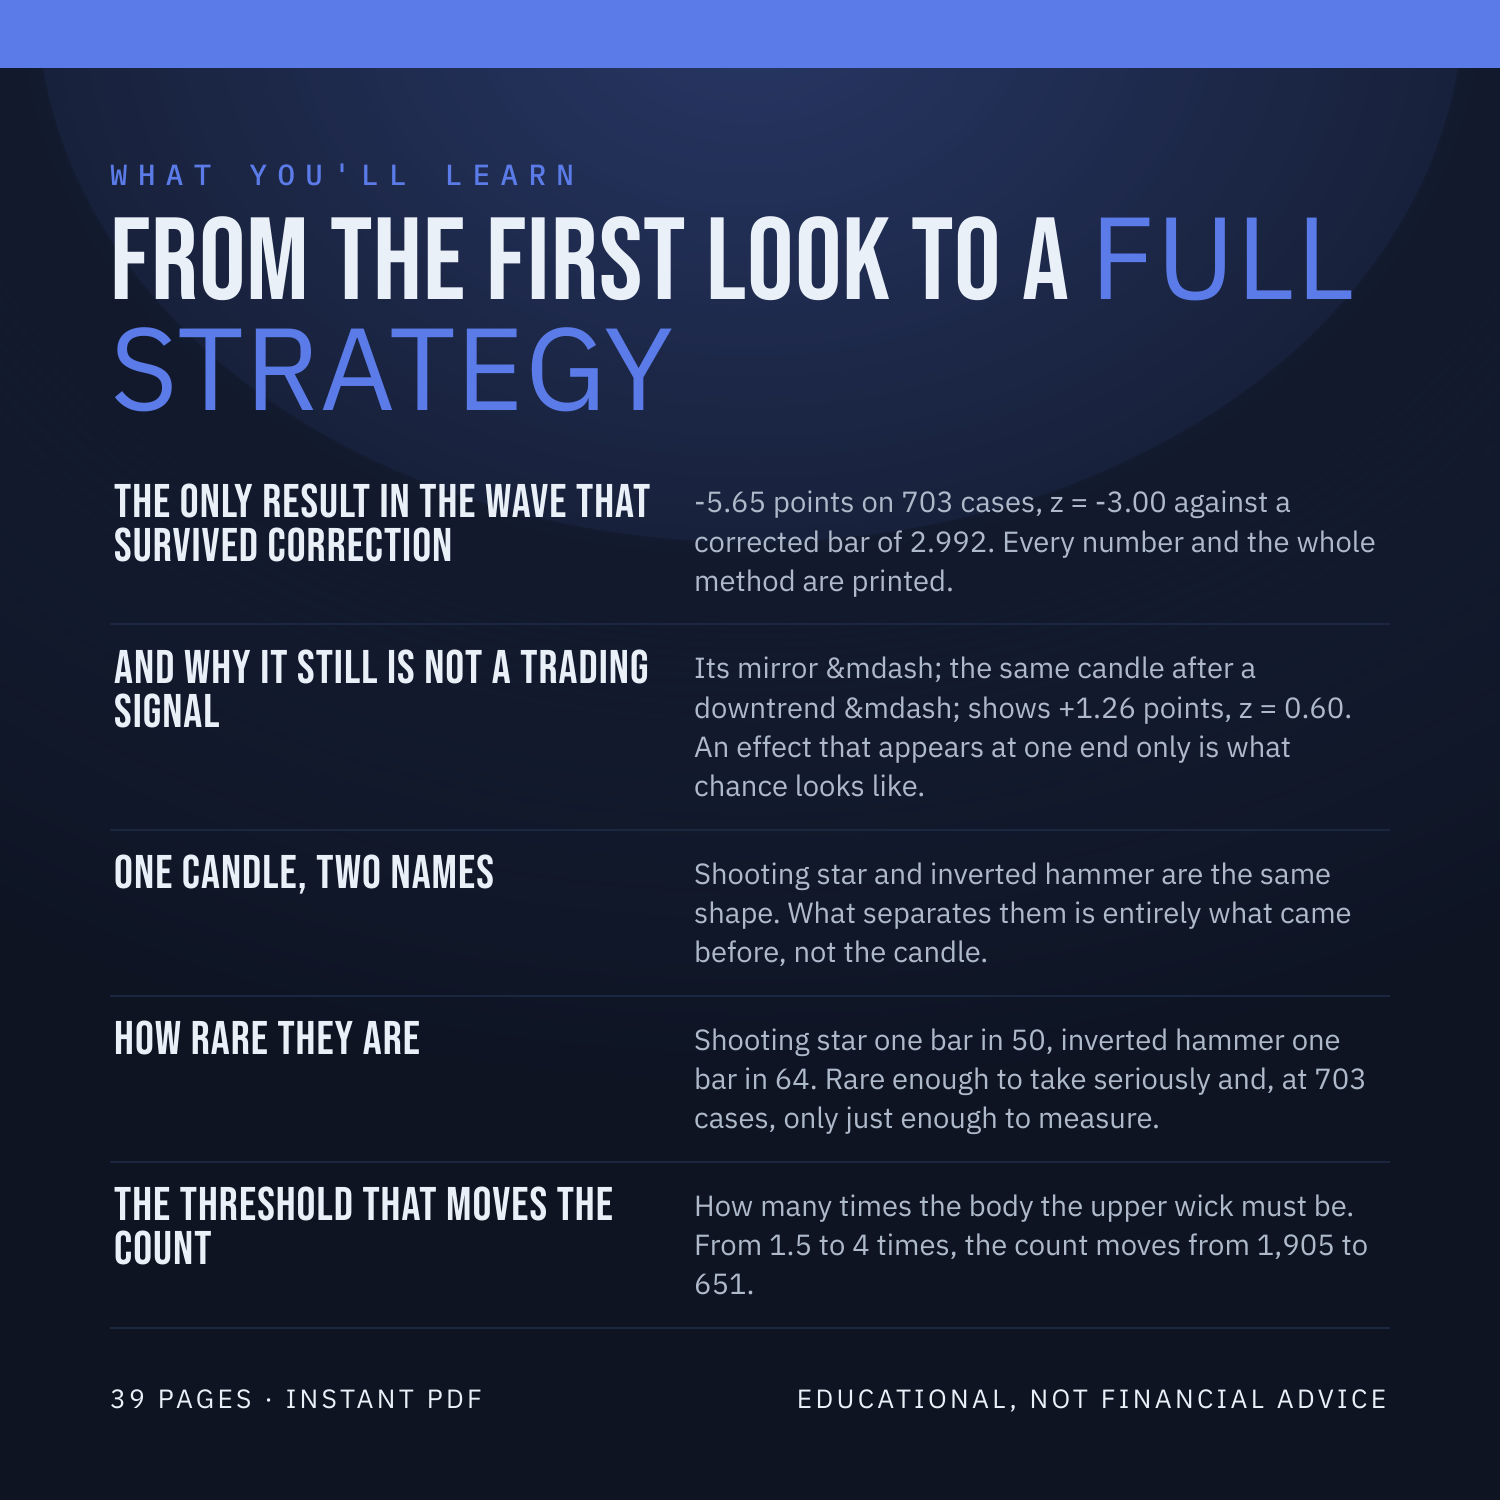
- The only result in the wave that survived correction — -5.65 points on 703 cases, z = -3.00 against a corrected bar of 2.992. Every number and the whole method are printed.
- - And why it still is not a trading signal — Its mirror — the same candle after a downtrend — shows +1.26 points, z = 0.60. An effect that appears at one end only is what chance looks like.
- - One candle, two names — Shooting star and inverted hammer are the same shape. What separates them is entirely what came before, not the candle.
- - How rare they are — Shooting star one bar in 50, inverted hammer one bar in 64. Rare enough to take seriously and, at 703 cases, only just enough to measure.
- - The threshold that moves the count — How many times the body the upper wick must be. From 1.5 to 4 times, the count moves from 1,905 to 651.
WHAT YOU'LL BE ABLE TO DO
- Recognise the shape, and name it correctly from the trend before it.
- - Read a result that survives correction without over-reading it.
- - Apply the mirror test to any directional claim about a candle.
- - Explain why one survivor out of 18 tests is close to what nothing looks like.
- - State the wick-to-body threshold you used before quoting any count.
AN HONEST NOTE
Shooting Star is a clue, not a crystal ball. It describes what price has already done. This guide contains no win-rates, no backtest results and no promises about what you will make, because nobody can verify those and you should not trust anyone who prints them. What it hands you instead is a set of rules you can test yourself on TradingView in an afternoon. Educational, not financial advice.
Instant download. 39 pages, PDF.