
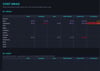

Crypto Trading Journal — Full Edition
YOU KNOW YOUR WIN RATE. YOU DON'T KNOW YOUR FEE RATE.
Add up everything you paid last quarter in trading fees, funding and gas. Most active traders have never done that arithmetic once. The ones who do are usually unpleasantly surprised.
No single line looks scary. Four dollars in fees. Twelve dollars in funding over a three-day hold. Two dollars in gas. You would never take a trade for eighteen dollars, but you pay it twenty times a month and it never appears on a single screenshot.
This journal makes that number impossible to ignore, then tells you where it comes from.
WHY EXISTING JOURNALS MISS IT
Almost every trading journal on the market is a forex or stocks template with a crypto label added later. They have a column for fees and nothing else. They have no idea what funding is, no concept of gas, no way to tell a spot buy from a 5x perp, and no place to record which chain a swap happened on.
That is not a small gap. Funding is charged every eight hours you hold a perp. Over a three-day position that is nine separate payments. You can be completely right on direction and finish flat, and your win rate will never tell you why.
IT ALSO SCORES YOU IN R
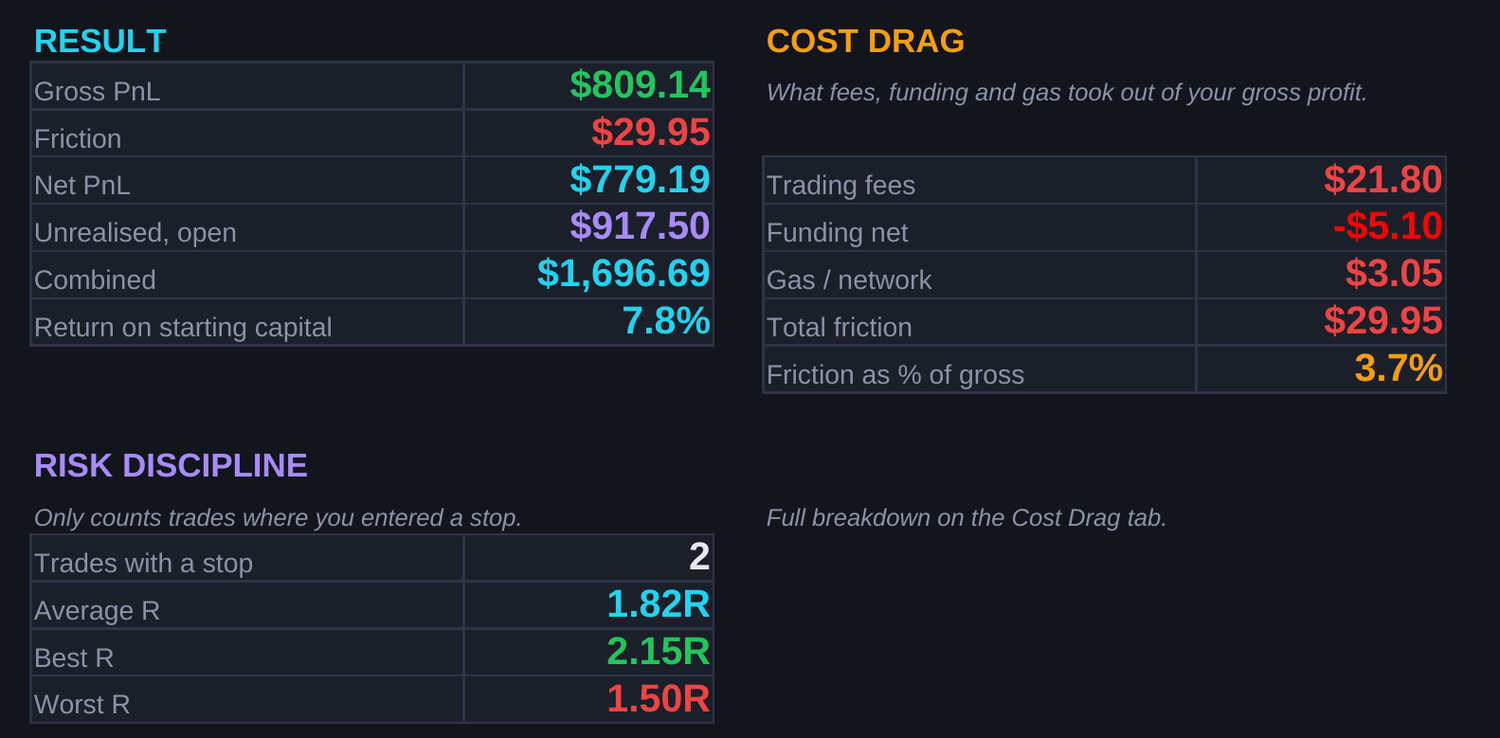
Enter the stop you actually used and the sheet works out your planned risk, then scores every trade as a multiple of it. A trade that made $50 risking $500 is not the same trade as one that made $50 risking $25, and only one of those is repeatable.
You get average R, best R, worst R, and a count of how many trades you took with a stop at all — which is its own uncomfortable number. There is a position sizing calculator on the Settings tab so you can work out your size before you enter, from your account, your risk percentage and your stop distance.
Leave the stop blank and everything else still works. You just lose the R column.
WHAT IS IN THE FILE
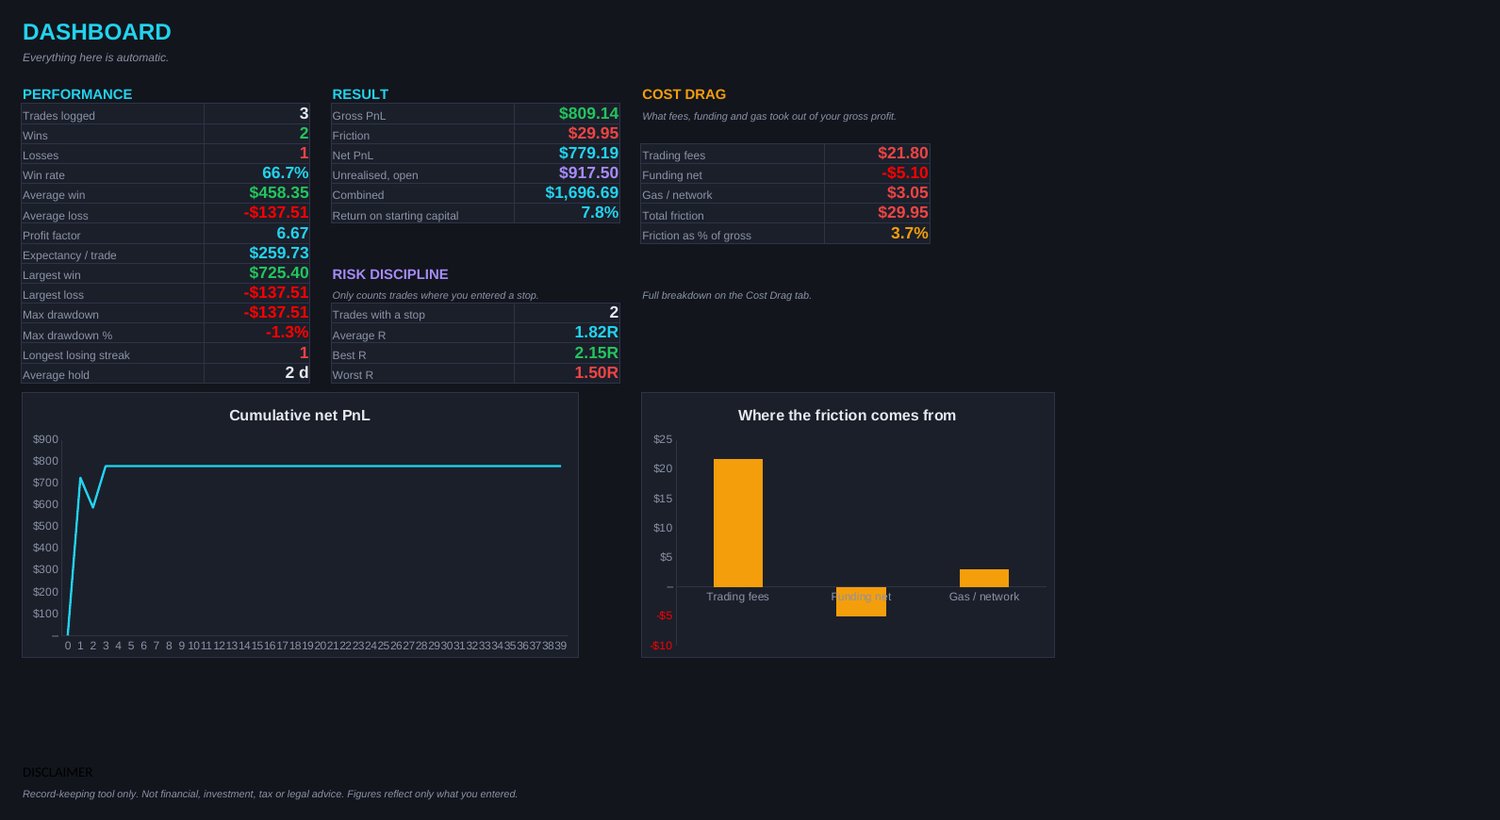
Dashboard. Win rate, average win and loss, profit factor, expectancy per trade, largest win and loss, max drawdown in dollars and in percent, longest losing streak, average hold time. Plus your gross PnL, your total friction, and the one number this file exists for: friction as a percentage of gross profit. Two charts: your cumulative net PnL curve, and where the friction comes from.
Trade Log. One row per closed trade, 1,000 rows. Venue and venue type (Spot CEX, Perp CEX, Margin, Spot DEX, Perp DEX), chain, asset, direction, leverage, entry, stop, target, exit, size. Then trading fees, funding entered signed so negative when you paid and positive when you were paid, and gas, each in its own column. Position value, margin used, planned risk, risk as a percent of capital, gross PnL, total friction, net PnL, R-multiple and return on margin are all computed for you. Every trade gets a setup tag and a mistake tag. Colour scales on net PnL and R so a hundred rows are scannable at a glance.
Open Positions. Trades you are still in, with unrealised PnL, capital at risk and notional exposure.
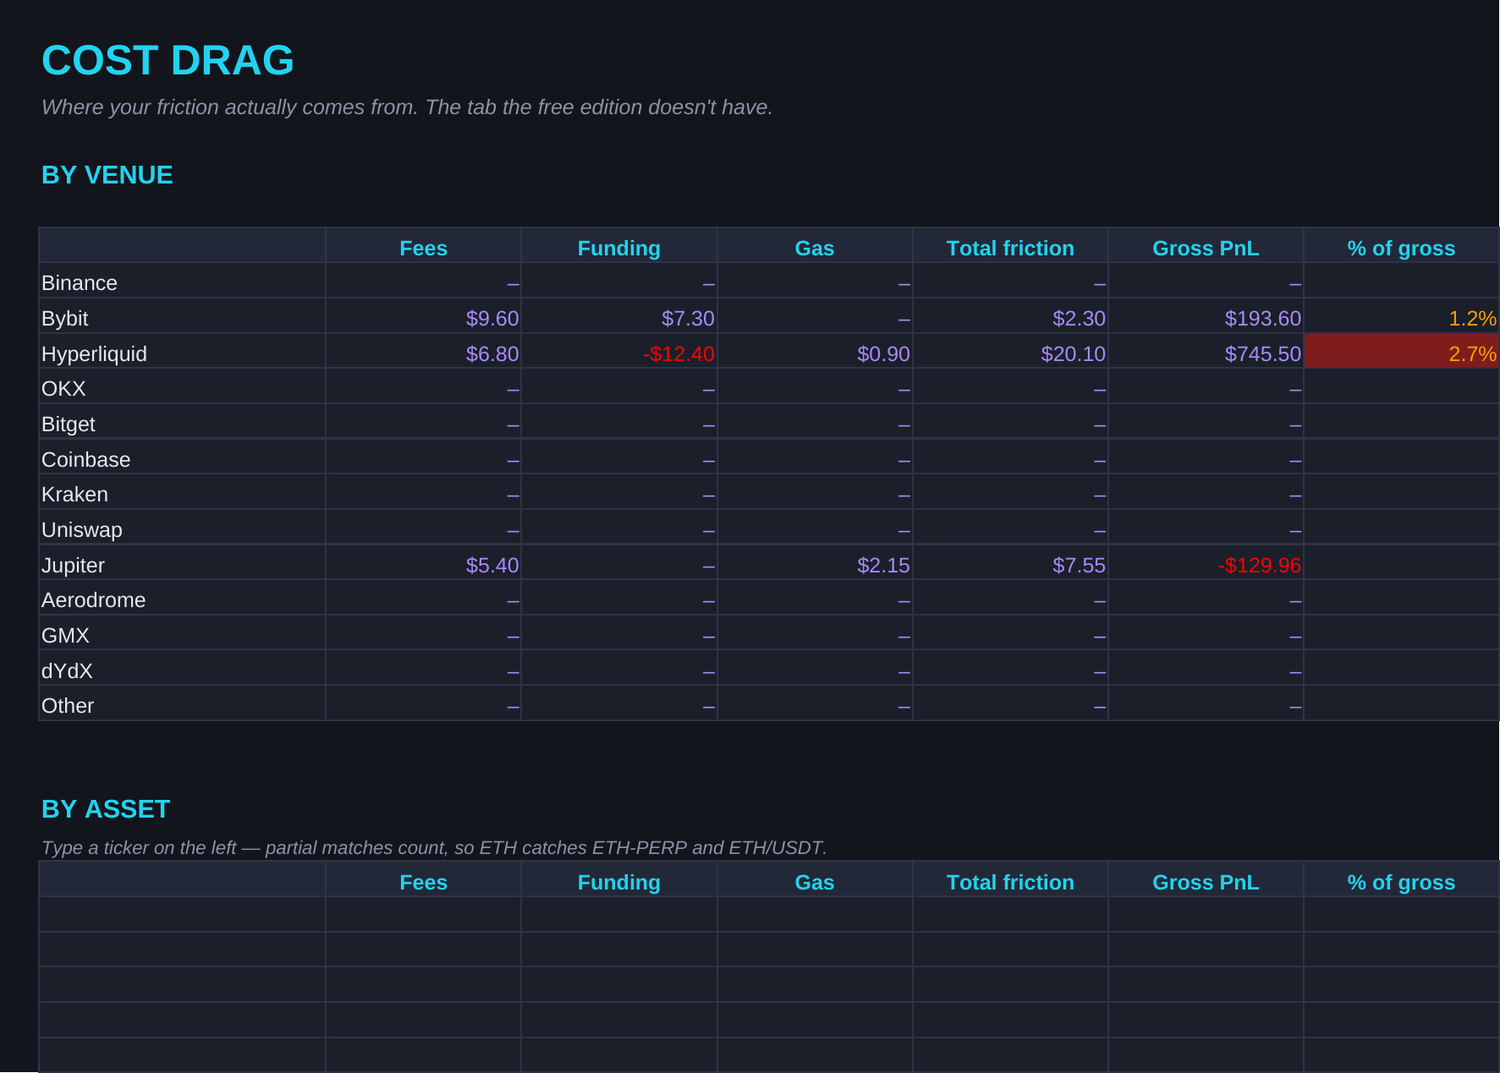
Cost Drag. The tab this file is really about. Your friction broken out by venue, by asset and month by month, each with the share of gross profit it consumed. This is where you find out that one exchange is quietly taxing you, or that a chain you like costs more in gas than it returns.
Behaviour. What each setup actually earns, and what each mistake actually costs, with a chart. Revenge trade and no stop loss stop being feelings and become amounts.
Price Feed. A short, honest guide to pulling live prices into the Google Sheets version, with the code included. It uses your own free CoinGecko key, which takes two minutes to get and needs no card.
Settings. Base currency, starting capital, the position sizing calculator, and editable lists for venues, chains, setups and mistakes. The dropdowns follow whatever you put there.
HOW IT IS BUILT
A real .xlsx file. Not a PDF with a link inside it, which is somehow common in this category.
It opens in Excel and imports cleanly into Google Sheets. No Tables, no structured references, no macros, no add-ons, no external links, none of the functions that silently break on the way across. That was a design constraint from the first cell, not something checked afterwards.
Nothing leaves your machine. No API keys, no wallet connection, no exchange permissions, no account. Your trade history stays in your file, on your computer.
Every formula is visible and unlocked. Add a column, change a calculation, restructure a tab. It is your file.
WHAT IT DOES NOT DO, SAID PLAINLY
It does not import your trades. You type them, or you paste them from a CSV. If you place forty trades a day, this is the wrong tool and you should use something with exchange integrations.
It does not handle scaling in and out. One row is one complete trade.
It does not do your taxes and it produces no official form of any kind. It will make your tax year far easier to reconstruct. It will not file it.
It does not give live prices in Excel. That is a Microsoft limitation, not a shortcut on my part: the WEBSERVICE function does not work on Mac at all, and STOCKHISTORY does not cover crypto. Live prices are available in the Google Sheets version, and even there Google caches the results for one to two hours, so they are recent rather than real-time. Anyone promising you a real-time spreadsheet is selling you a refund.
It is not advice. It is a record of what you did.
WHO THIS IS FOR
Traders who hold perps and have never separated funding from fees. People trading on-chain, where the automated tools do not index long-tail tokens properly. Anyone who wants to own their record instead of renting it from a subscription, and anyone who would rather not hand exchange API keys to a third party.
WHO THIS IS NOT FOR
High-frequency traders. If manual entry is impractical for you, no spreadsheet will fix that.
Anyone looking for signals, calls or a system. This file tells you what you did. What you do about it is your problem, and honestly that is the useful half.
REFUND
Fourteen days, no questions, no form to fill in. Email me and it is done. I would rather refund you than have you keep something you do not use.
FREE VERSION
There is a free edition with the Trade Log, the Dashboard, the equity curve and the position sizing calculator. It gives you your total cost drag as a single number. The Full Edition is what breaks that number apart — by venue, by asset and over time — and adds Open Positions, the behaviour analysis, the discipline metrics and the live price feed. Try the free one first if you would rather.
DISCLAIMER
This file is a record-keeping tool. It is not financial, investment, tax or legal advice, and it produces no official tax document. All figures reflect only what you enter. Verify anything you rely on, and speak to a qualified professional about tax.