
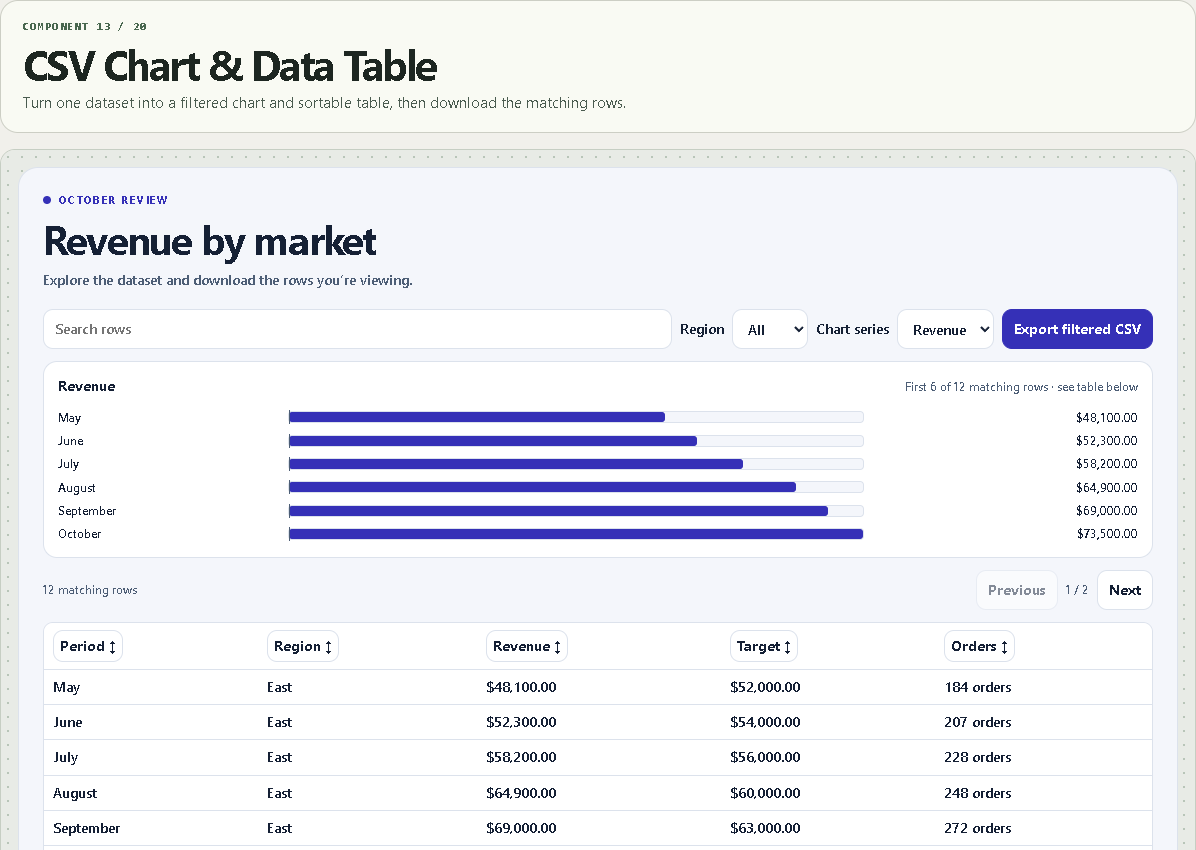
CSV Chart & Data Table
Turn one dataset into a filtered chart and sortable table, then download the matching rows.
WHAT IT DOES
- Shared chart and table filters
- Numeric, currency, date, and percentage columns
- Sortable headers and pagination
- Filtered export that neutralizes formula-like text
- Pasted CSV, public CSV, or flat JSON
WHAT YOU CAN CUSTOMIZE
- Data source
- Typed fields and units
- Chart labels and series
- Filter column, page size, and chart cap
- Export, search, and appearance
HOW TO SET IT UP
1. Paste a CSV with a unique first-row header or select a public HTTPS data URL.
2. Paste optional field settings as column,type,unit. Use types text, number, currency, percent, and date. Enter percentage points and use comma-grouped or plain numbers.
3. Set the chart labels and series using column names. Separate multiple series with |.
REQUIREMENTS AND LIMITS
- Supports 500 rows and 24 columns. The chart displays the first configured number of sorted, matching rows.
- Remote URLs must allow CORS, be public, and resolve without redirects. Use a final download URL.
- Data loads in the visitor’s browser. Never enter private records or credentials.
WHAT'S INCLUDED
- Paste-to-install Framer Component URL
- Standalone Framer code component (.tsx)
- Quick-start instructions and the two example preset configurations
Need help? Reply through your order receipt with the product name and describe what happened.