



Land Surveying Business Profit Tracker
Land Surveying Business Profit Tracker Excel — clients and jobs, job log, expenses, and a monthly P and L dashboard. Know what every survey actually pays — and whether the month actually made money.
Built for land surveying firms and solo surveyors who need to know, job by job and hour by hour, what a quoted price is really worth per hour — without accounting software. If a survey is eating hours at a discount rate, this workbook shows it before the next quote.
WHAT'S INCLUDED (6 sheets):
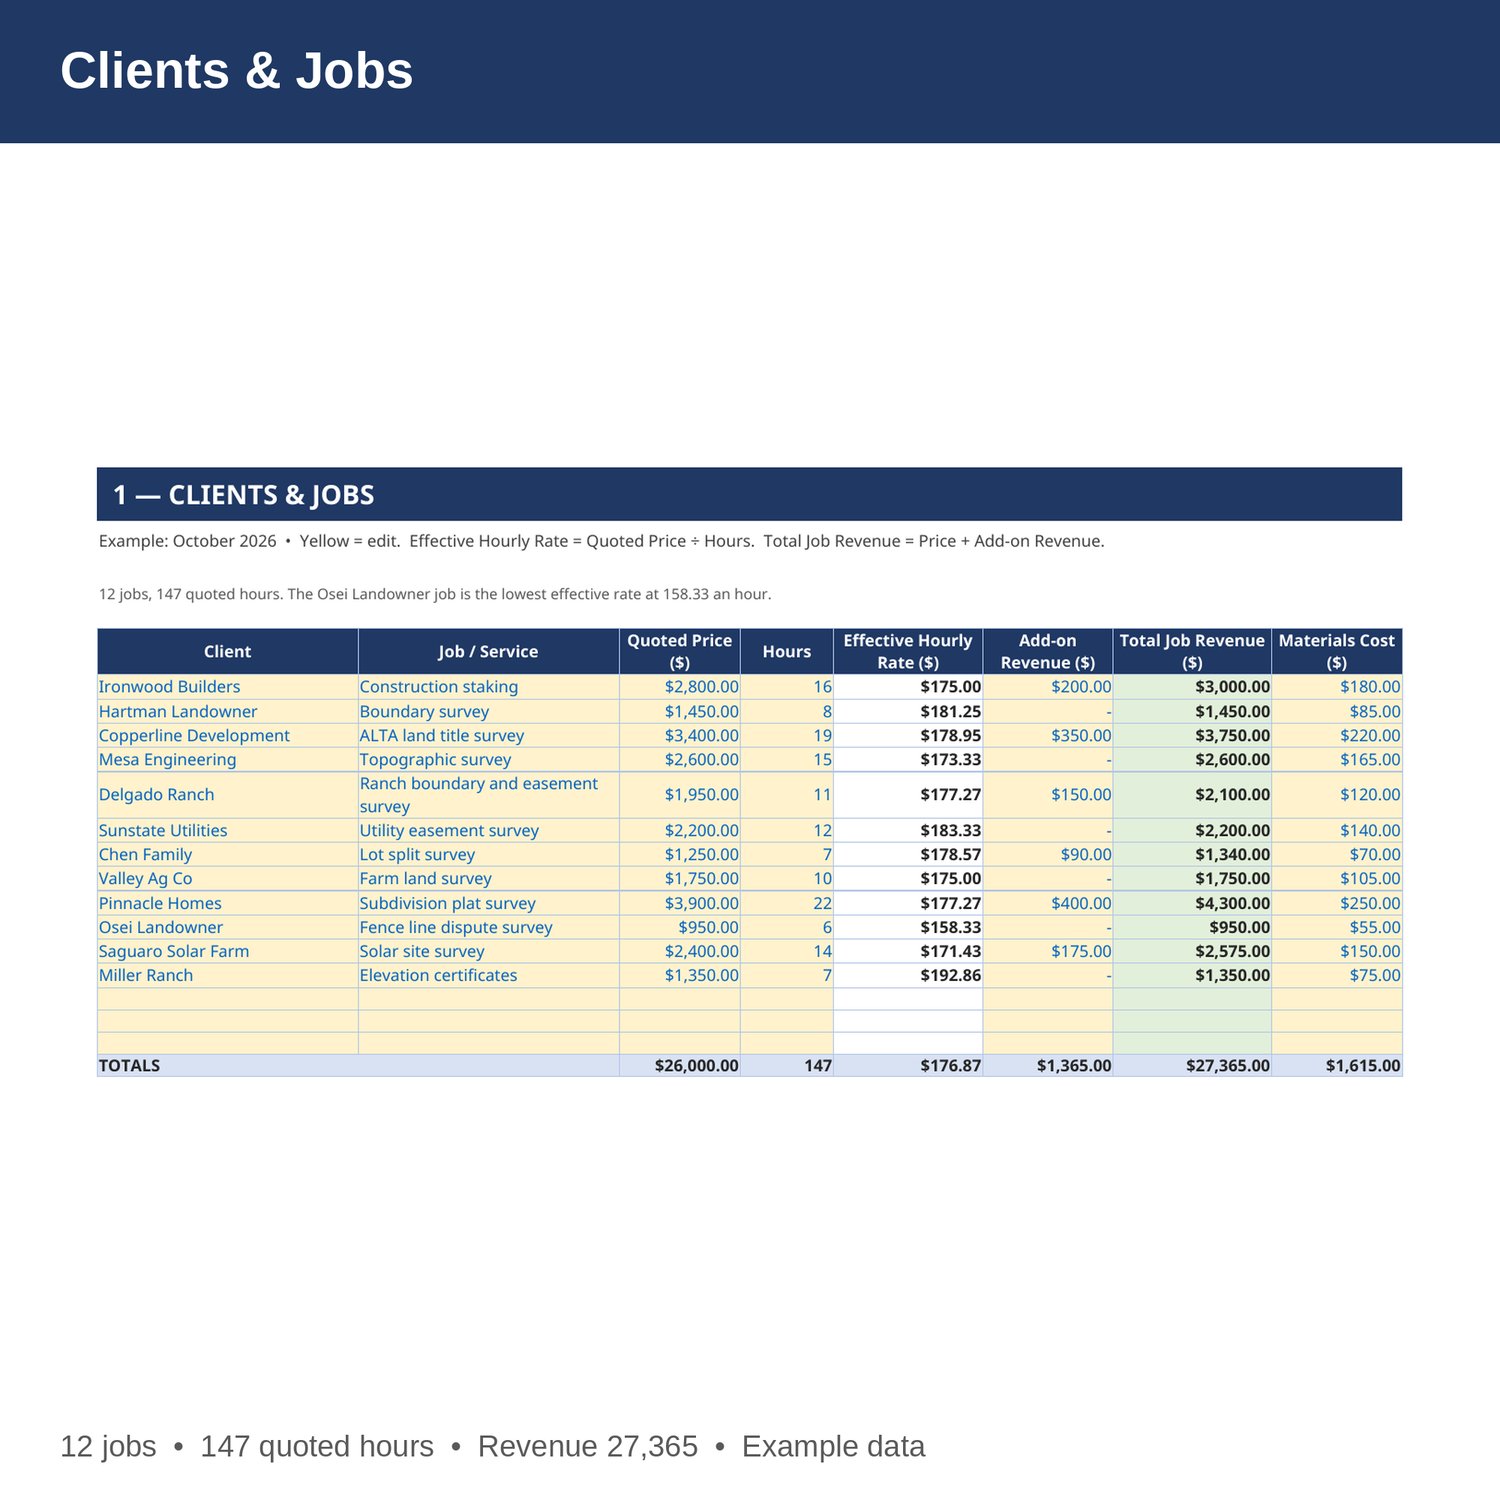
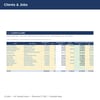
- Clients and Jobs — client, job or service, quoted price, hours, effective hourly rate, add-on revenue, total job revenue, and materials cost for every job. Change a price and the rate and totals update.
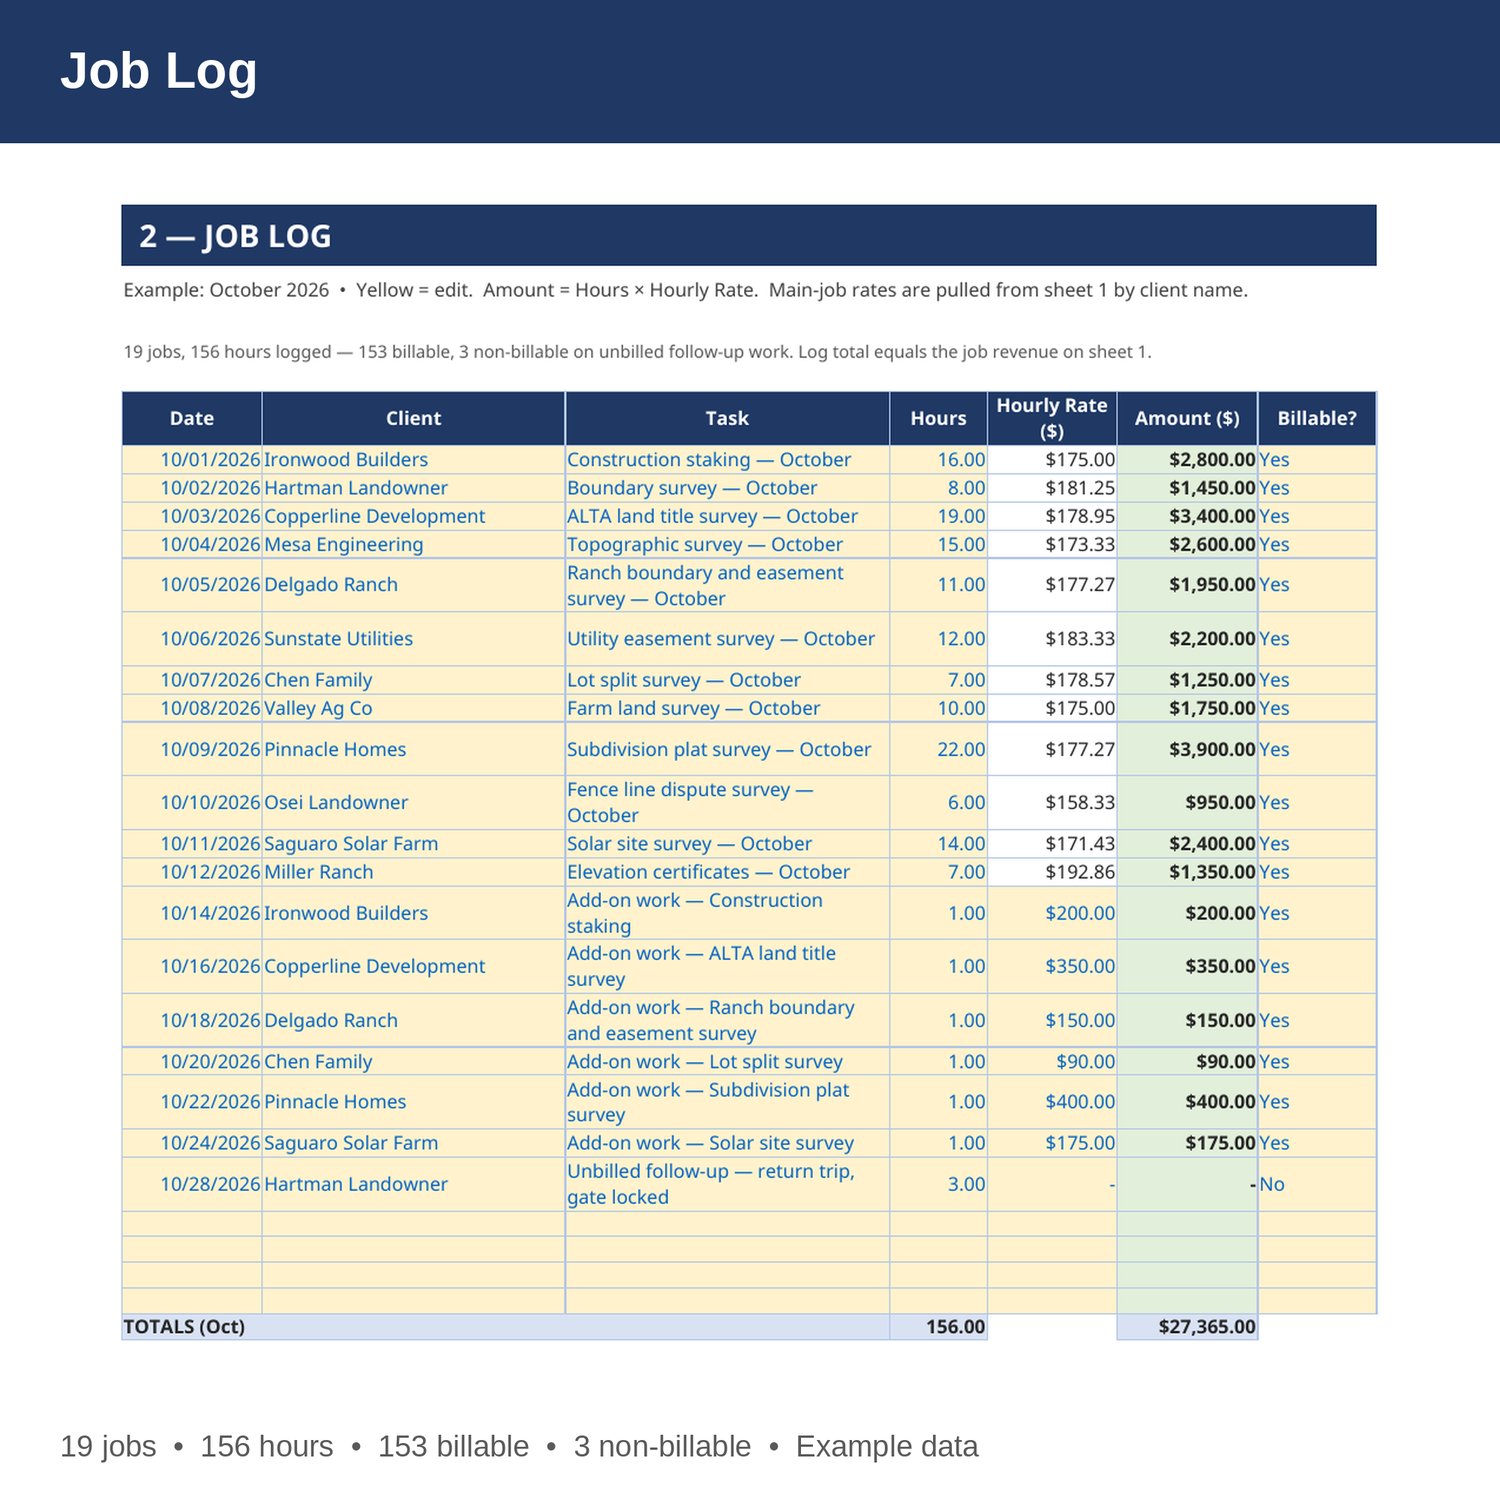
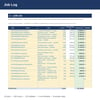
- Job Log — date, client, task, hours, hourly rate, amount, and whether it was billable for every job. Main-job rates are pulled from sheet 1 by formula; add-on jobs are priced per job.
- Expenses — fuel, vehicle, tools, insurance, marketing, office, and other overhead, with a monthly cost for each.
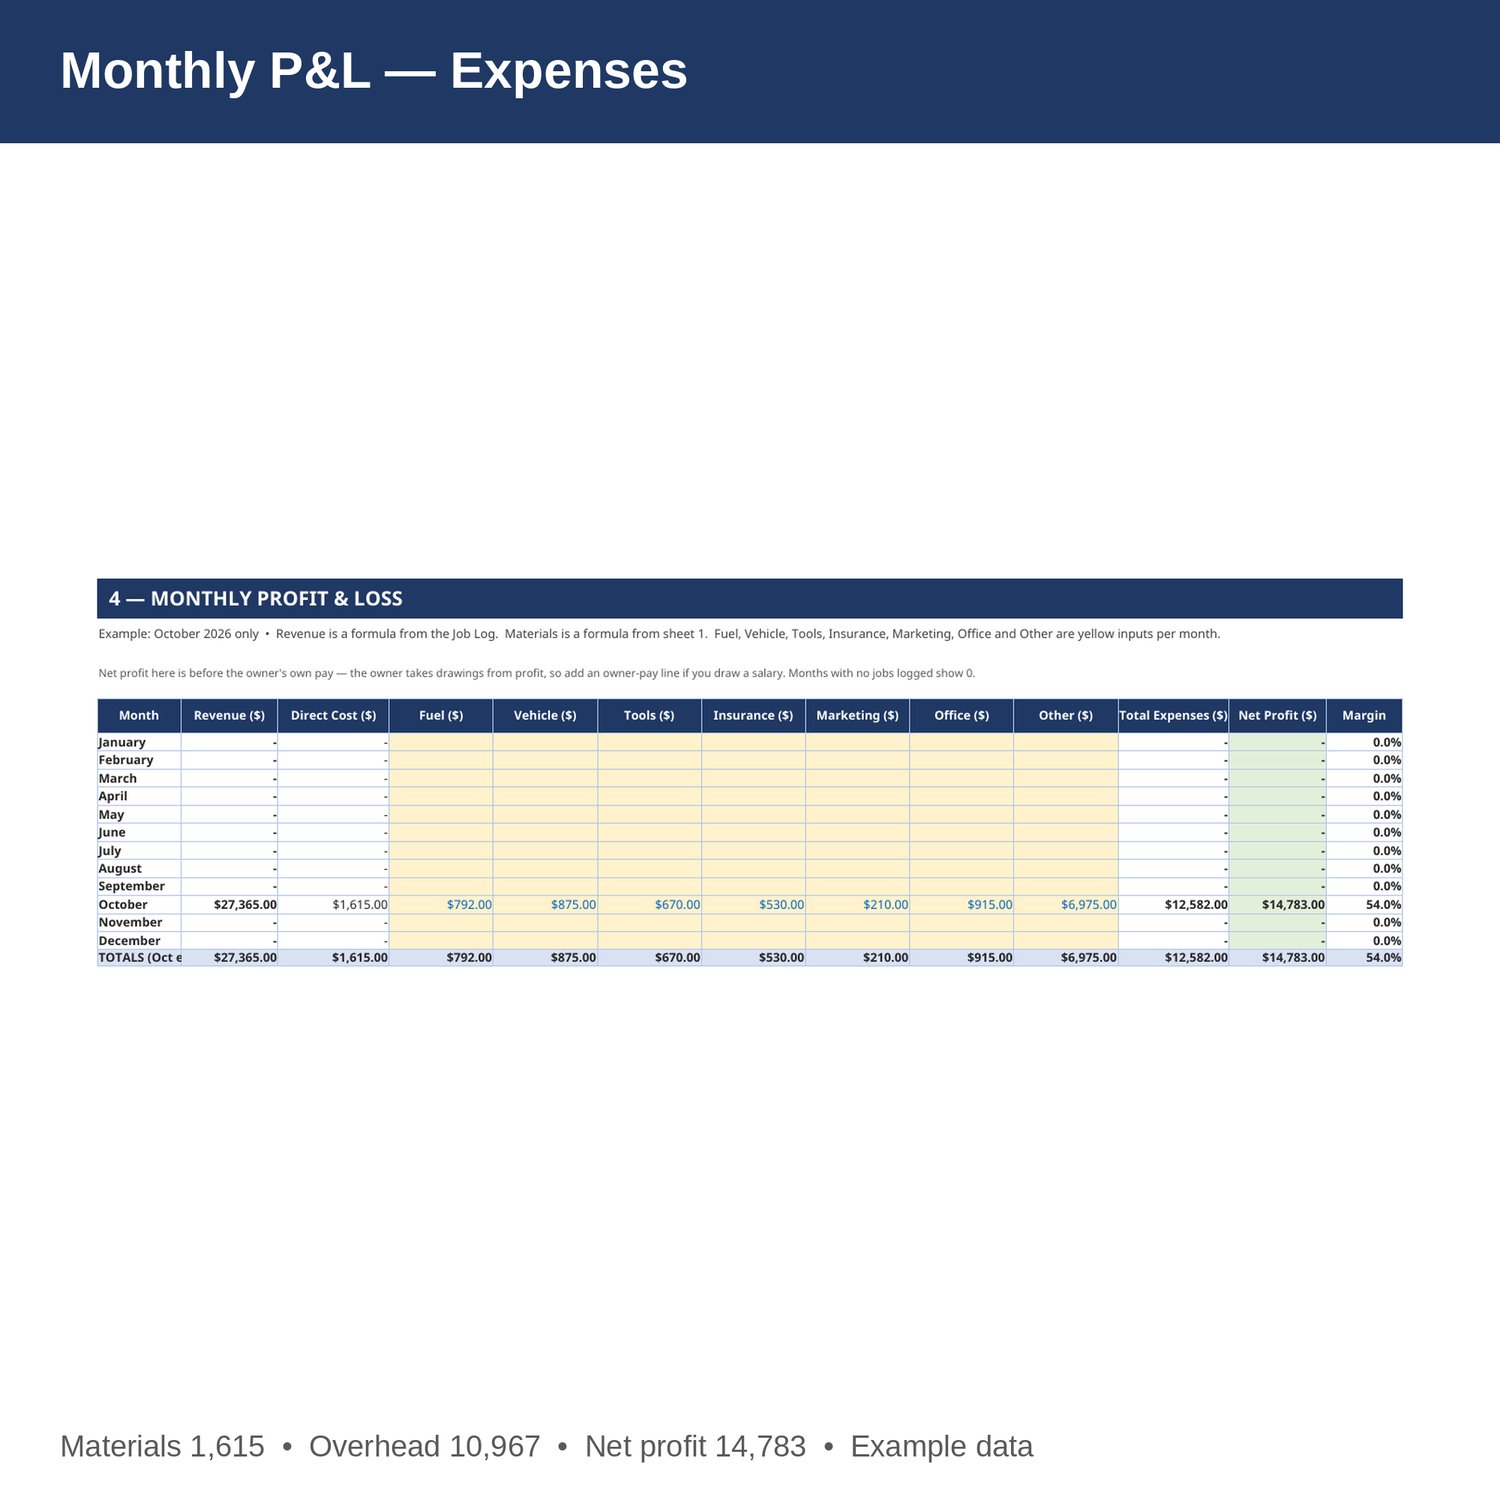
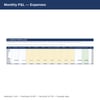
- Monthly P and L — revenue, materials, fuel, vehicle, tools, insurance, marketing, office and other expenses by month, Jan-Dec, with net profit and margin. Revenue is a formula from the Job Log; materials is a formula from sheet 1.
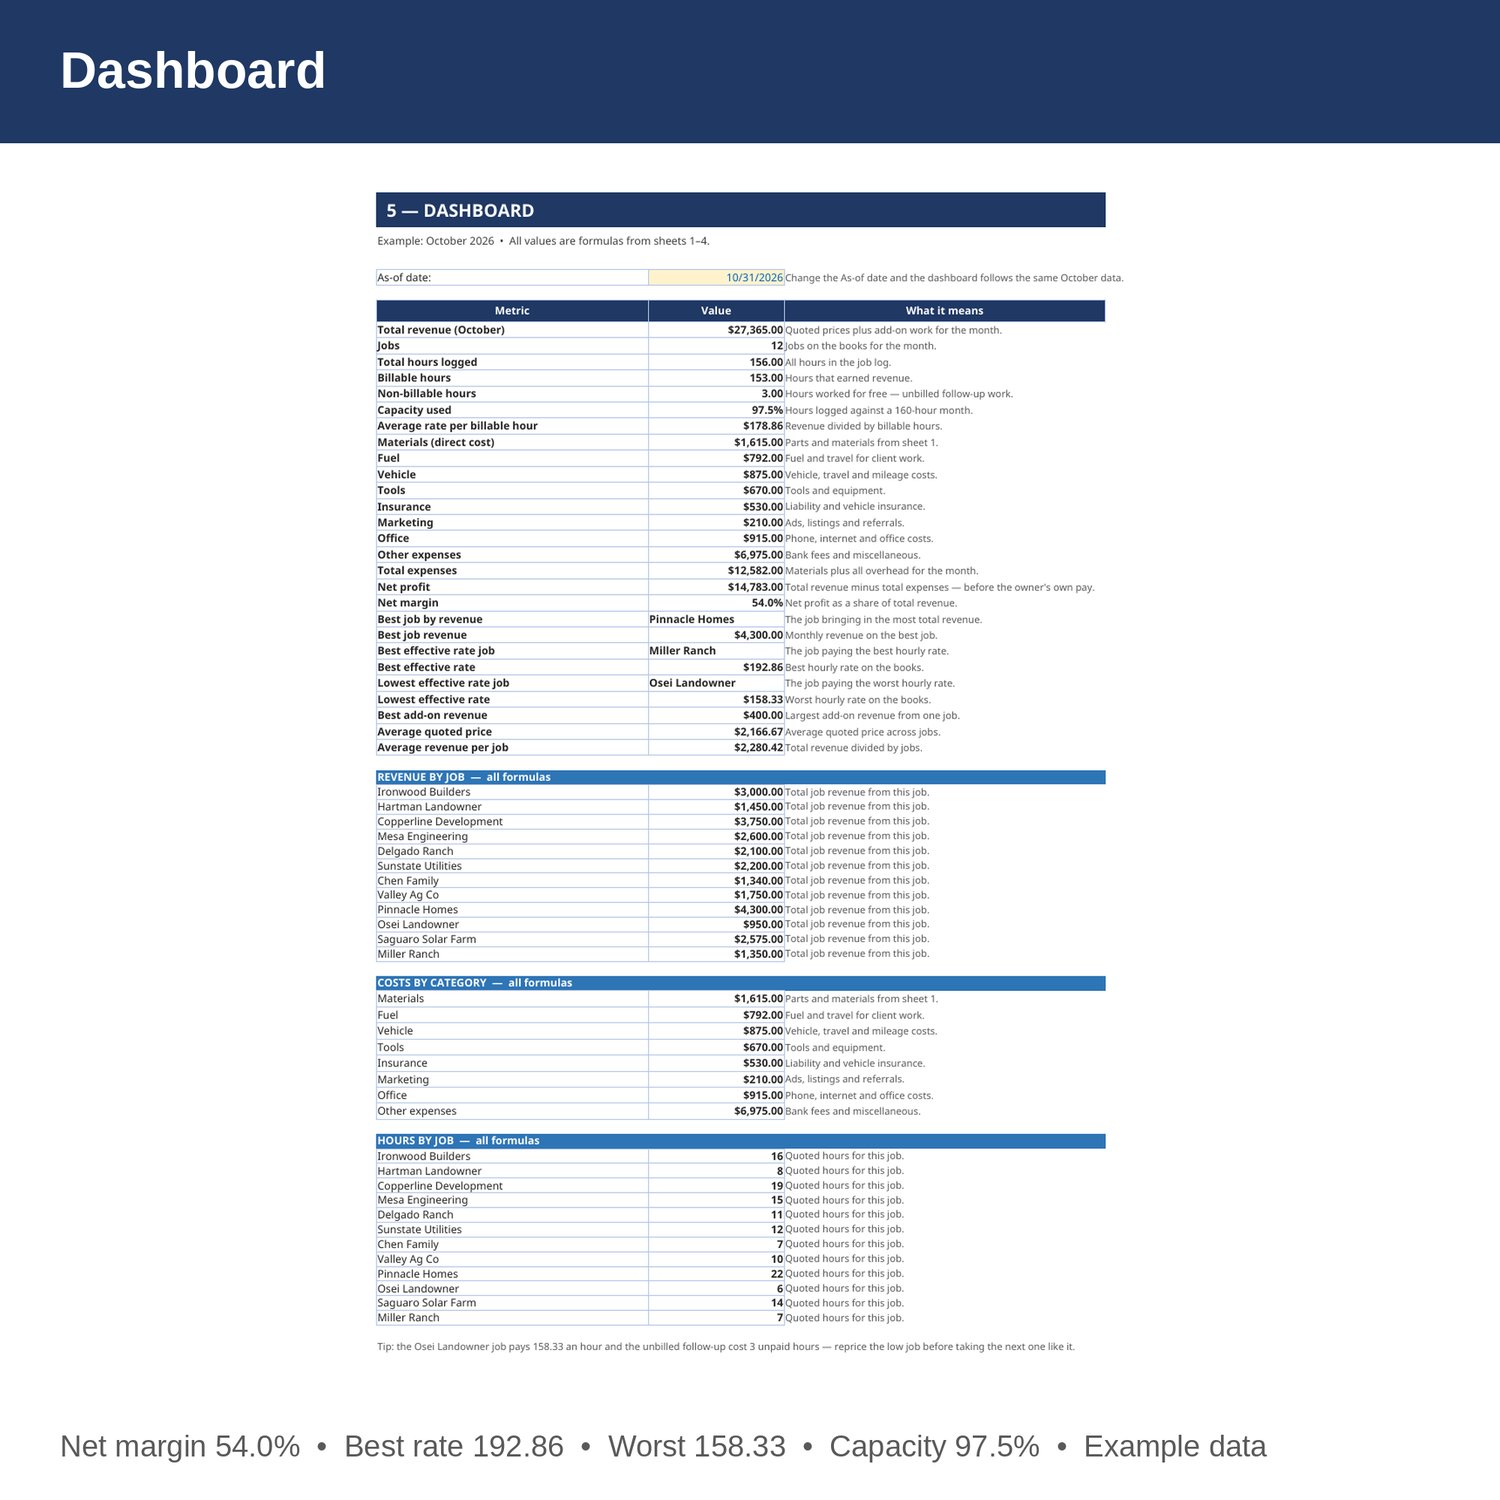
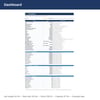
- Dashboard — total revenue, jobs, hours, billable vs non-billable hours, capacity used, average rate, materials, expenses, net profit and margin, best and weakest jobs, revenue by job, costs by category, and hours by job.
- Cover and How to Use — start here. Yellow cells are the only ones you edit.
EXAMPLE DATA (October 2026 — replace with your own numbers):
- 12 jobs; quoted prices 26,000; add-on revenue 1,365; total revenue 27,365; materials 1,615.
- 147 quoted hours; 156 hours logged (153 billable, 3 non-billable); capacity used 97.5 percent of a 160-hour month; average rate per billable hour 178.86.
- Overhead 10,967; total expenses 12,582; net profit 14,783; net margin 54.0 percent.
- Best job by revenue: Pinnacle Homes, 4,300. Best effective rate: Miller Ranch, 192.86 per hour. Lowest effective rate: Osei Landowner, 158.33 per hour.
HOW IT WORKS:
1. Download the Excel file instantly after purchase.
2. On sheet 1, enter each client's job or service, quoted price, hours, add-on revenue, and materials cost. Effective hourly rate and total job revenue fill in by formula.
3. On sheet 2, add a row per job: date, client (spelled exactly as on sheet 1), task, hours, hourly rate, and whether it was billable. Amount fills in by formula. Main-job rows pull the rate from sheet 1.
4. On sheet 3, enter each month's fuel, vehicle, tools, insurance, marketing, office and other costs.
5. On sheet 4, enter expenses each month, then check capacity, materials, and net profit on the Dashboard.
HOW THE NUMBERS WORK:
Effective hourly rate is quoted price divided by hours. Total job revenue is the price plus add-on revenue. Average rate per billable hour is total revenue divided by billable hours. Capacity used is hours logged divided by a 160-hour month. Net profit is revenue minus materials, fuel, vehicle, tools, insurance, marketing, office, and other expenses — before the owner's own pay, which comes out of profit as drawings.
PLEASE NOTE:
- Instant digital download. No physical item ships.
- Works in Microsoft Excel and Google Sheets (upload to Google Drive to open in Sheets).
- Example data is included so you can see how it works. Replace the yellow cells with your own numbers — yellow cells are the only ones you edit.
- This is a bookkeeping tool, not tax, legal, or CPA advice.
- Built by an accountant: B.S. Accountancy, ASU W. P. Carey, with revenue-reconciliation experience at Marriott and audit work at PwC.