




Rectangles Explained — Measured (PDF Guide)
Everybody trades ranges. Almost nobody can say what one is. "Price bouncing between two levels" is a picture, not a rule, and it is why two people looking at the same chart count different numbers of rectangles and neither can explain the gap. There is a published rule. It has three conditions, one of which you have almost certainly never been given, and a tolerance that moves the count eightfold.
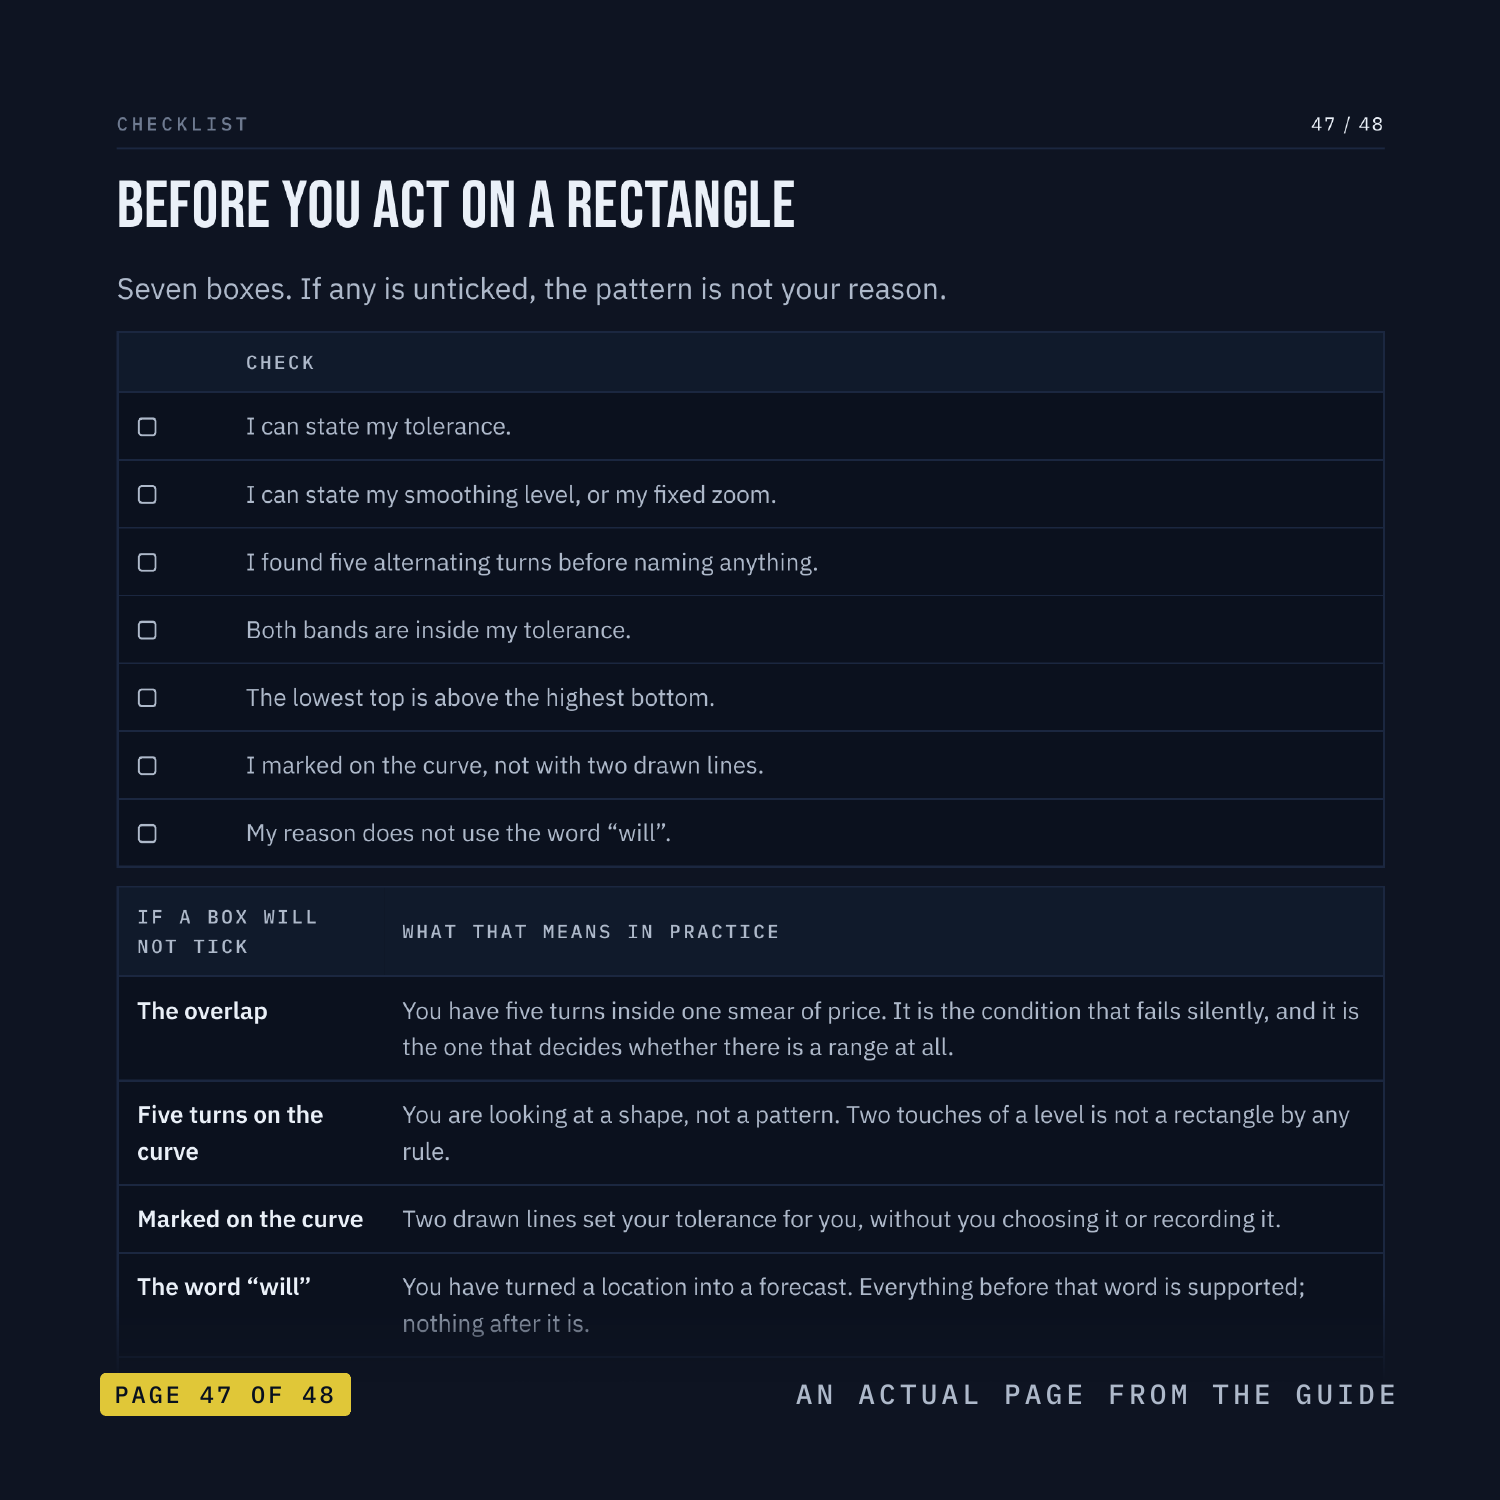
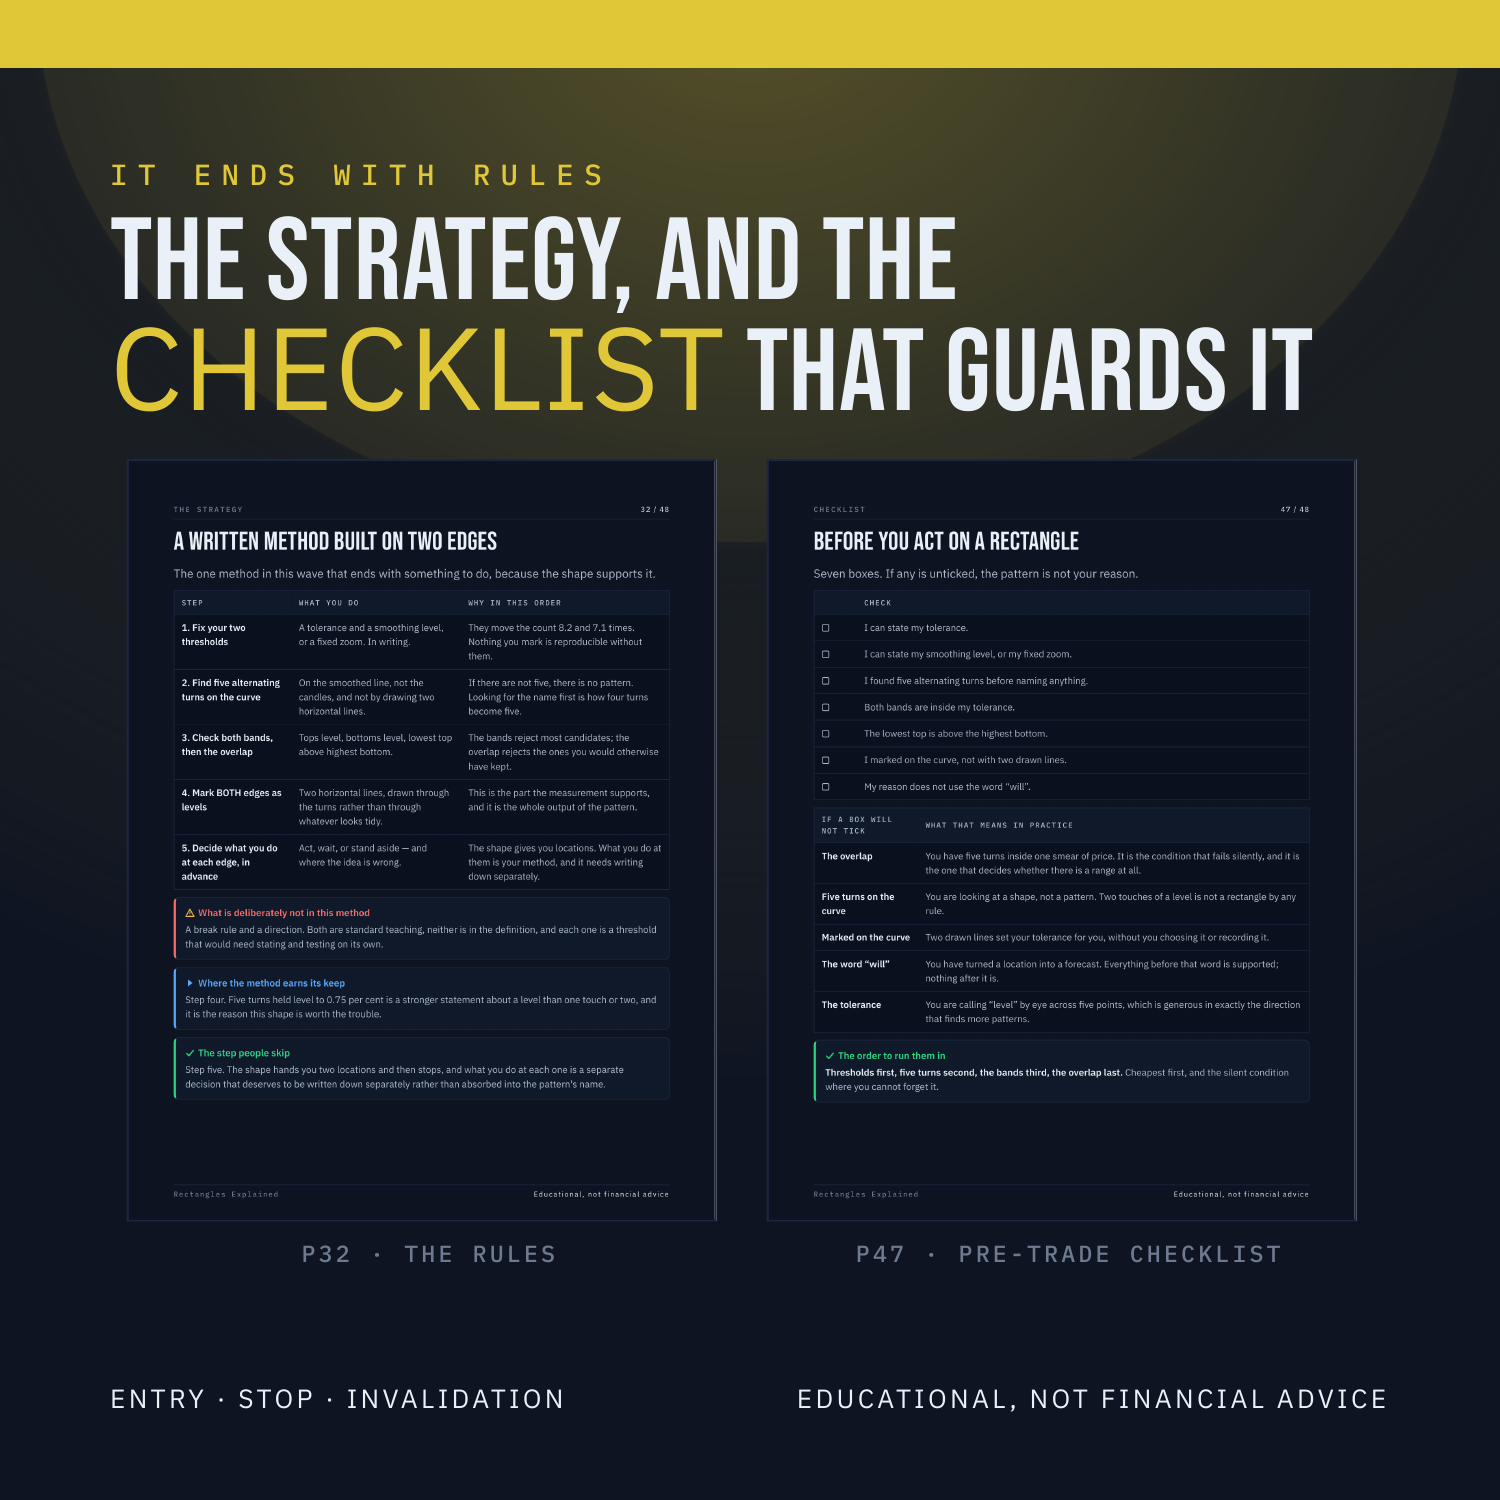
This guide uses the published algorithmic definition - Lo, Mamaysky and Wang, Journal of Finance 2000 - printed as written: five turns, the tops within 0.75 per cent of their average, the bottoms within 0.75 per cent of theirs, and the lowest top above the highest bottom. Across 35,944 bars that gives 369 rectangle tops and 373 rectangle bottoms. This is a 48-page PDF that teaches Rectangles from the first thing you see on the screen through to a written strategy with an entry, a stop and an explicit rule for when the trade is wrong.
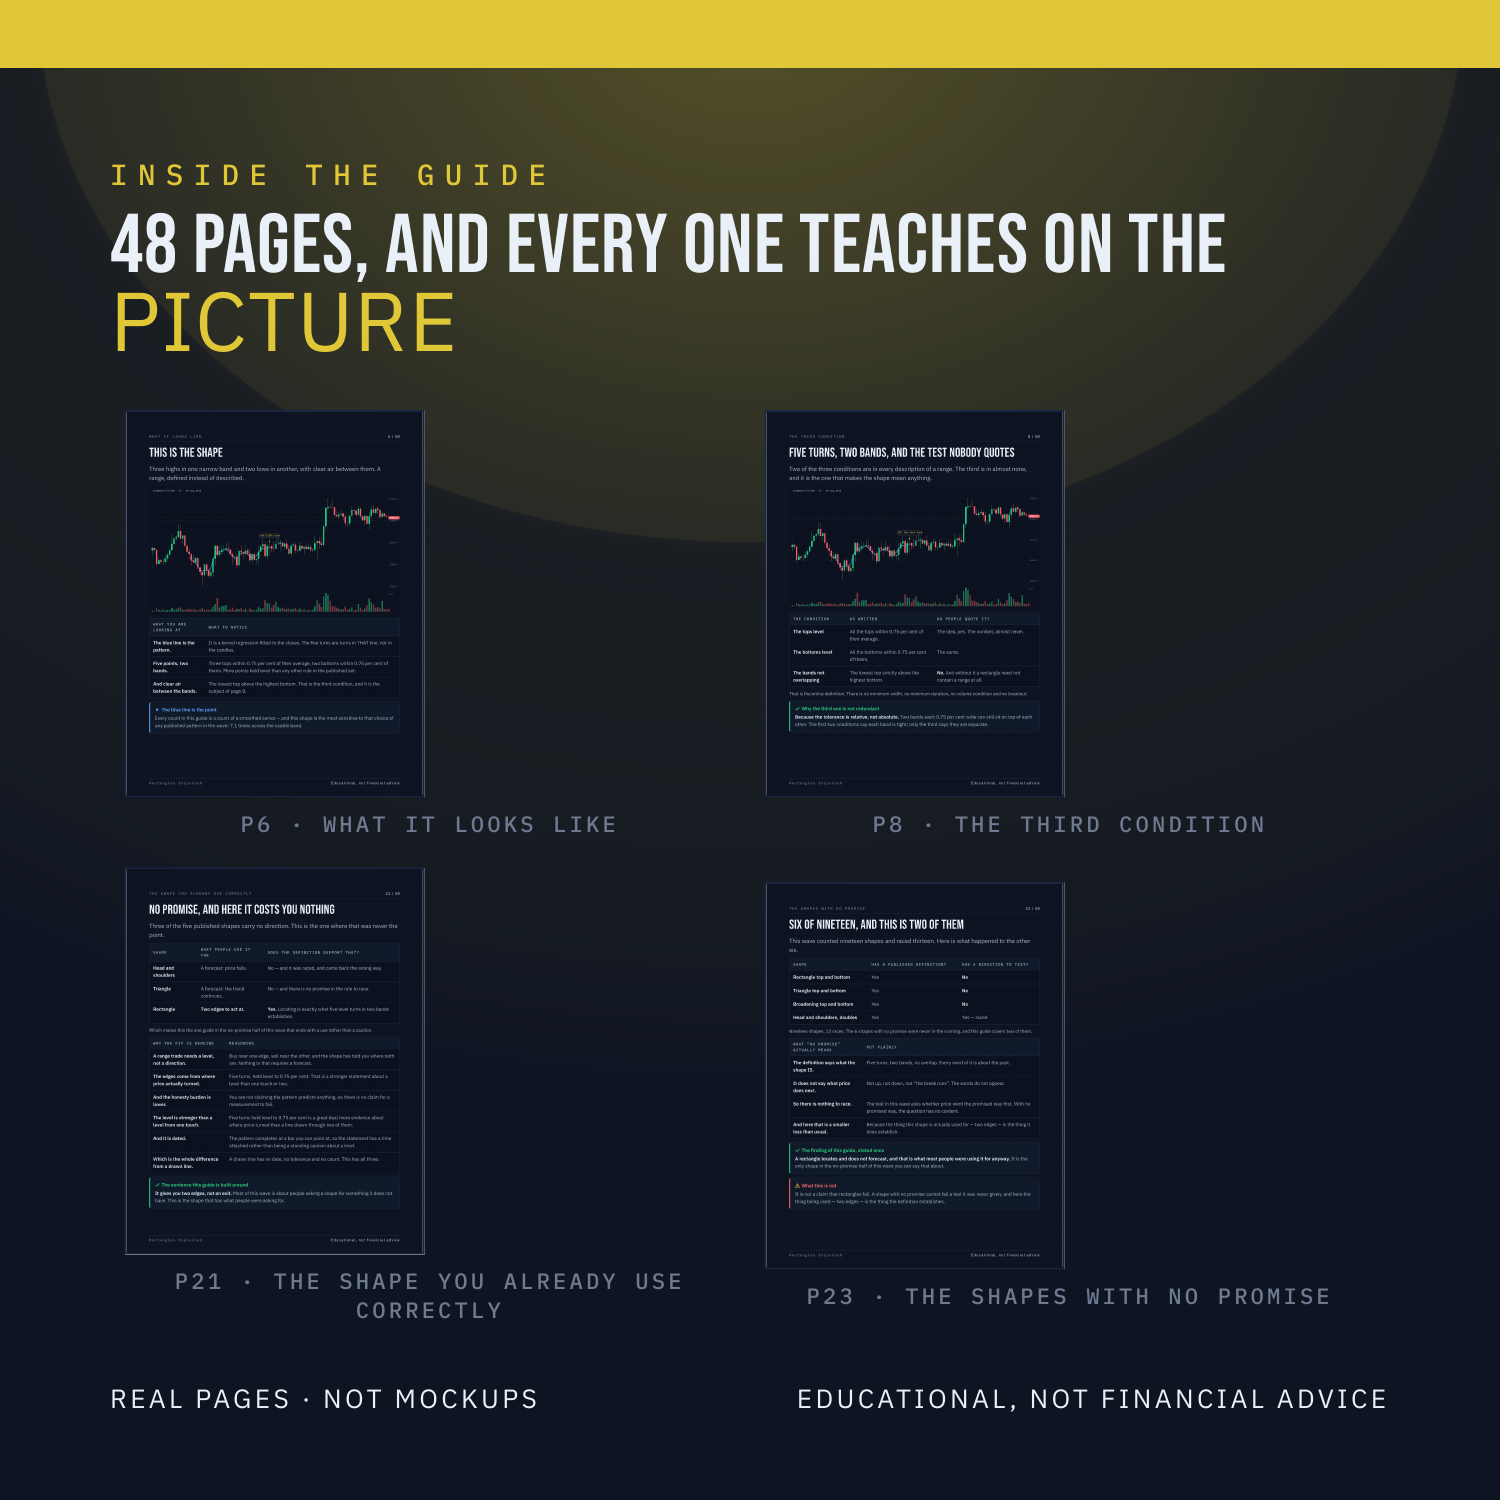
Nothing is taught underneath a chart. Every label sits on the candle, the line or the level it is describing, on real BTC, ETH, SOL and LINK charts, with the smoothed curve the detector actually saw drawn over the candles. There are three quizzes on real charts, each followed by the same chart re-shown annotated with the reasoning, plus faded practice pages where the first steps are filled in and you finish the rest.
WHAT'S INSIDE
The third condition almost nobody quotes - the lowest top must sit above the highest bottom. Without it, two overlapping bands qualify, which is not a range at all.
A tolerance at half the paper's usual value - 0.75 per cent here against 1.50 per cent for the head and shoulders and the double top. Five points have to be level instead of four, so the bar is raised.
The most bandwidth-sensitive published shape in the wave - 691 rectangle tops at the loosest smoothing, 97 at the tightest. 7.1 times on identical bars, more than any other shape with a published rule.
No direction, and here that costs you nothing - it is one of six shapes in this wave with no promise written in. It is also the one people already use correctly: as two edges, not as a forecast.
The most balanced pair in the wave - 369 tops against 373 bottoms, a 1.1 per cent difference, closer than any other mirror pair measured here.
WHAT YOU'LL BE ABLE TO DO
Mark a rectangle by rule instead of by two eyeballed lines.
State all three conditions, including the one about overlap.
Say what your tolerance is and what moving it costs.
Explain why a shape with no promise can still be worth using.
Use the top and bottom versions as a check on your own marking.
AN HONEST NOTE
A rectangle is a clue, not a crystal ball. It describes what price has already done. This guide contains no win-rates, no backtest results and no promises about what you will make, because nobody can verify those and you should not trust anyone who prints them. What it hands you instead is a set of rules you can test yourself on TradingView in an afternoon. Educational, not financial advice.
Instant download. 48 pages, PDF.