

INTERACTIVE SALES ANALYTICS DASHBOARD - EXCEL TEMPLATE
Turn Your Sales Data Into Actionable Insights 📊
Stop spending hours manually analyzing sales data.
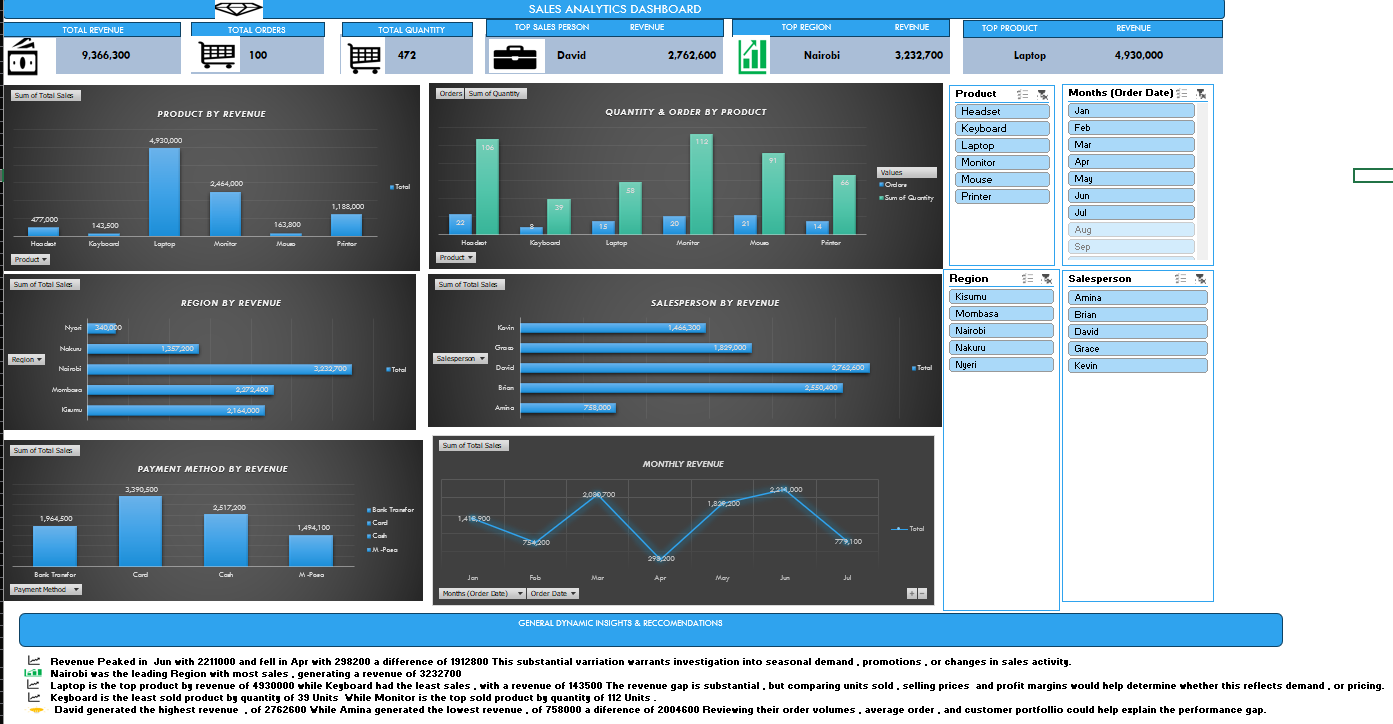
This Interactive Sales Analytics Dashboard for Excel helps you monitor sales performance, identify your top performers and quickly understand where your business is performing best.
What You'll Get
✅ Total Revenue KPI
✅ Total Orders KPI
✅ Quantity Sold KPI
✅ Top Salesperson analysis
✅ Top Region analysis
✅ Top Product analysis
✅ Interactive filters and slicers
✅ Dynamic insights
✅ Editable sales data
✅ Easy-to-use Excel dashboard
How It Works
Simply replace the sample sales data with your own data, refresh the workbook, and use the interactive dashboard to explore your sales performance.
The dashboard automatically updates the relevant metrics, rankings, insights and recommendations based on your data and selections.
Perfect For
• Small businesses
• Sales teams
• Entrepreneurs
• Freelancers
• Students learning data analytics
• Anyone who wants a professional sales dashboard in Excel
What You Need
Microsoft Excel on a compatible desktop version.
No advanced Excel skills are required to use the dashboard.
Important
The template includes sample data to demonstrate how the dashboard works.
Before making major changes, keep a backup copy of the original file.
Turn your raw sales data into a dashboard you can actually use to make decisions.