

Roofing Contractor Profit Tracker
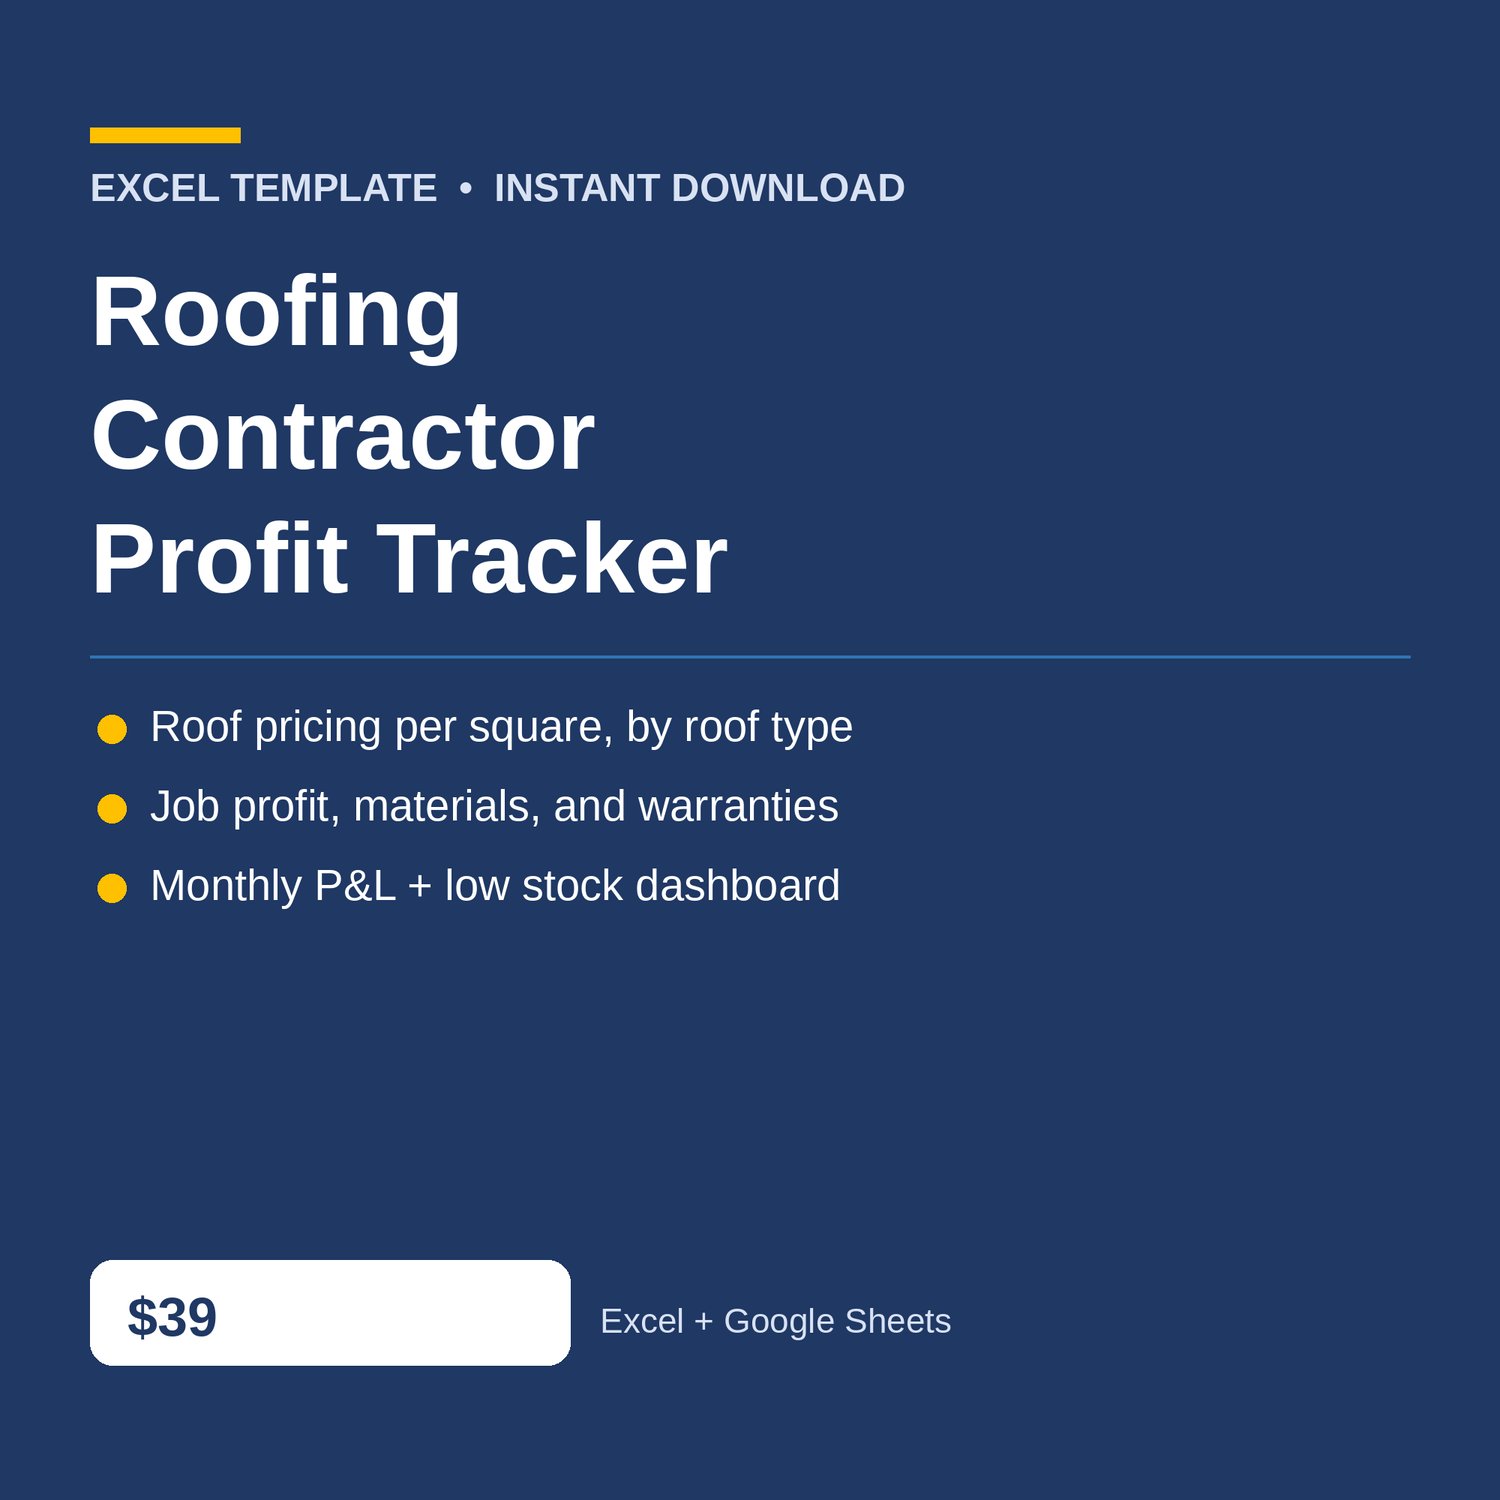
Roofing Contractor Profit Tracker Excel for your roofing business — roof pricing per square, job profit, materials inventory, and a monthly P and L dashboard. Know what every square actually costs — and whether the month actually made money.
Built for roofing contractors, roofers, and small roofing companies who need to know, roof type by roof type and job by job, whether the price covers the materials, the labor, and the dump fees — without accounting software. If a job is losing money, this workbook shows it before the next bid.
WHAT'S INCLUDED (6 sheets):
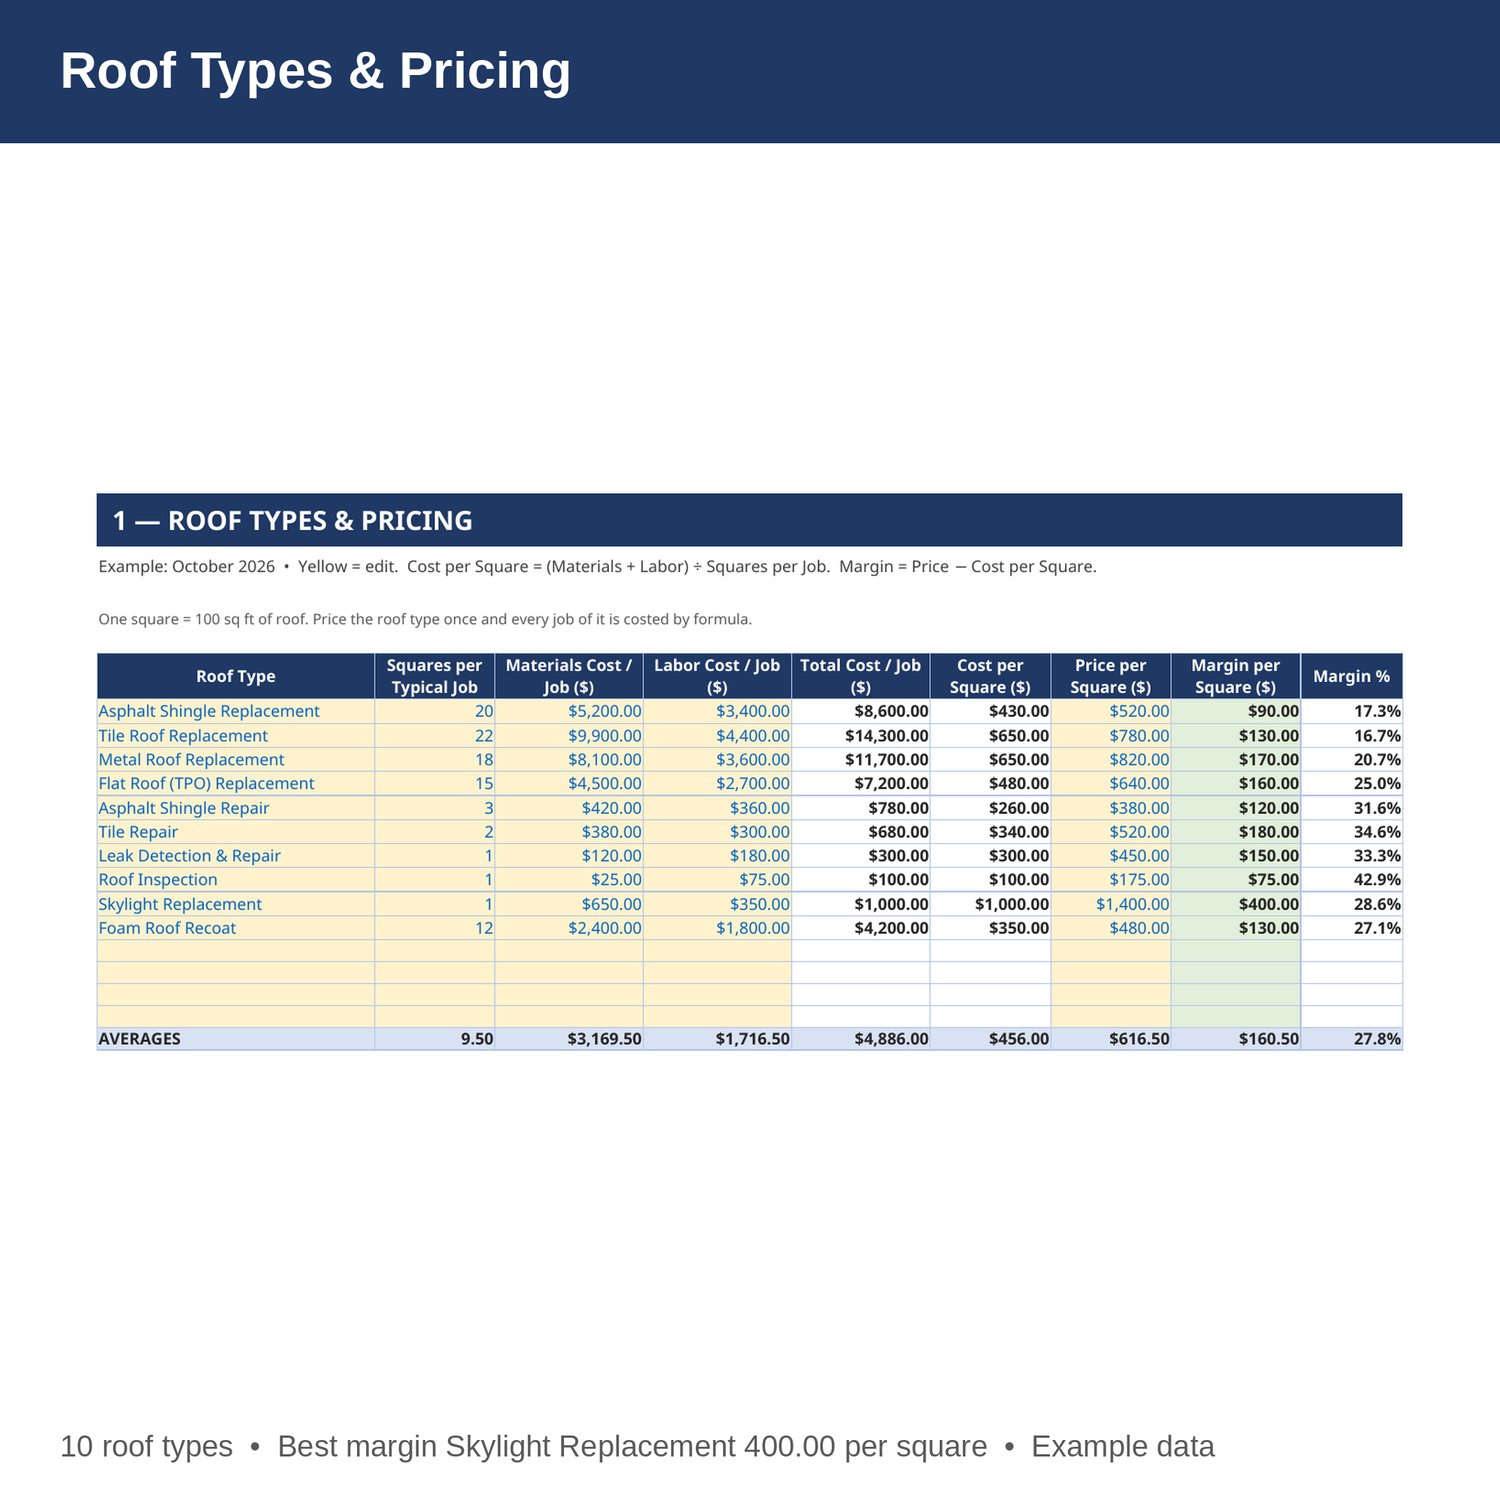
- Roof Types and Pricing — squares per typical job, materials and labor cost per job, cost per square, price per square, and margin in dollars and percent for every roof type. Change a materials cost and every job profit updates by formula.
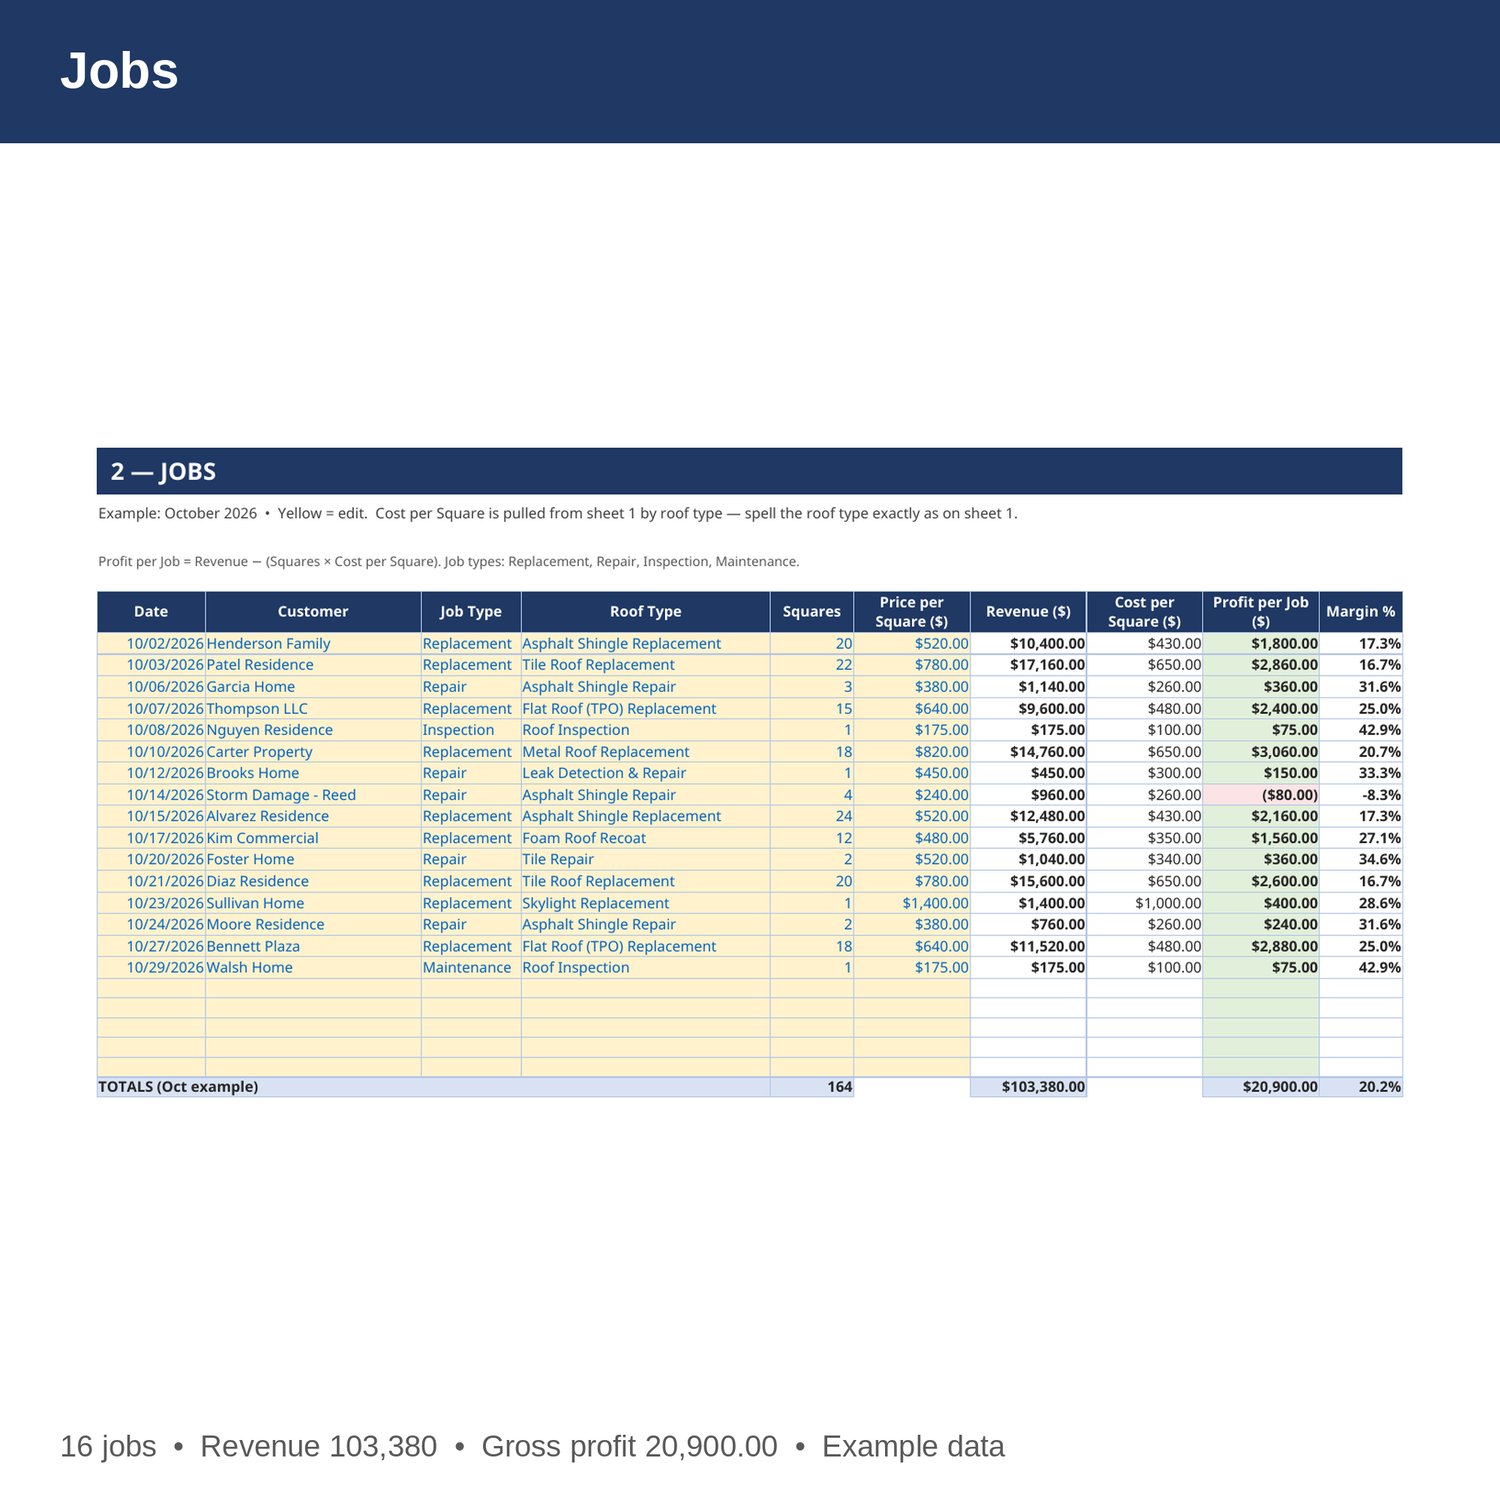
- Jobs — date, customer, job type (Replacement, Repair, Inspection, Maintenance), roof type, squares, price per square, revenue, cost per square pulled from the pricing sheet, profit per job, and margin. Log replacements, repairs, inspections, and maintenance in one place.
- Materials and Supplies — material, unit, quantity on hand, reorder point, cost per unit, and stock value. Anything at or below its reorder point is flagged LOW STOCK so you order it before the next job.
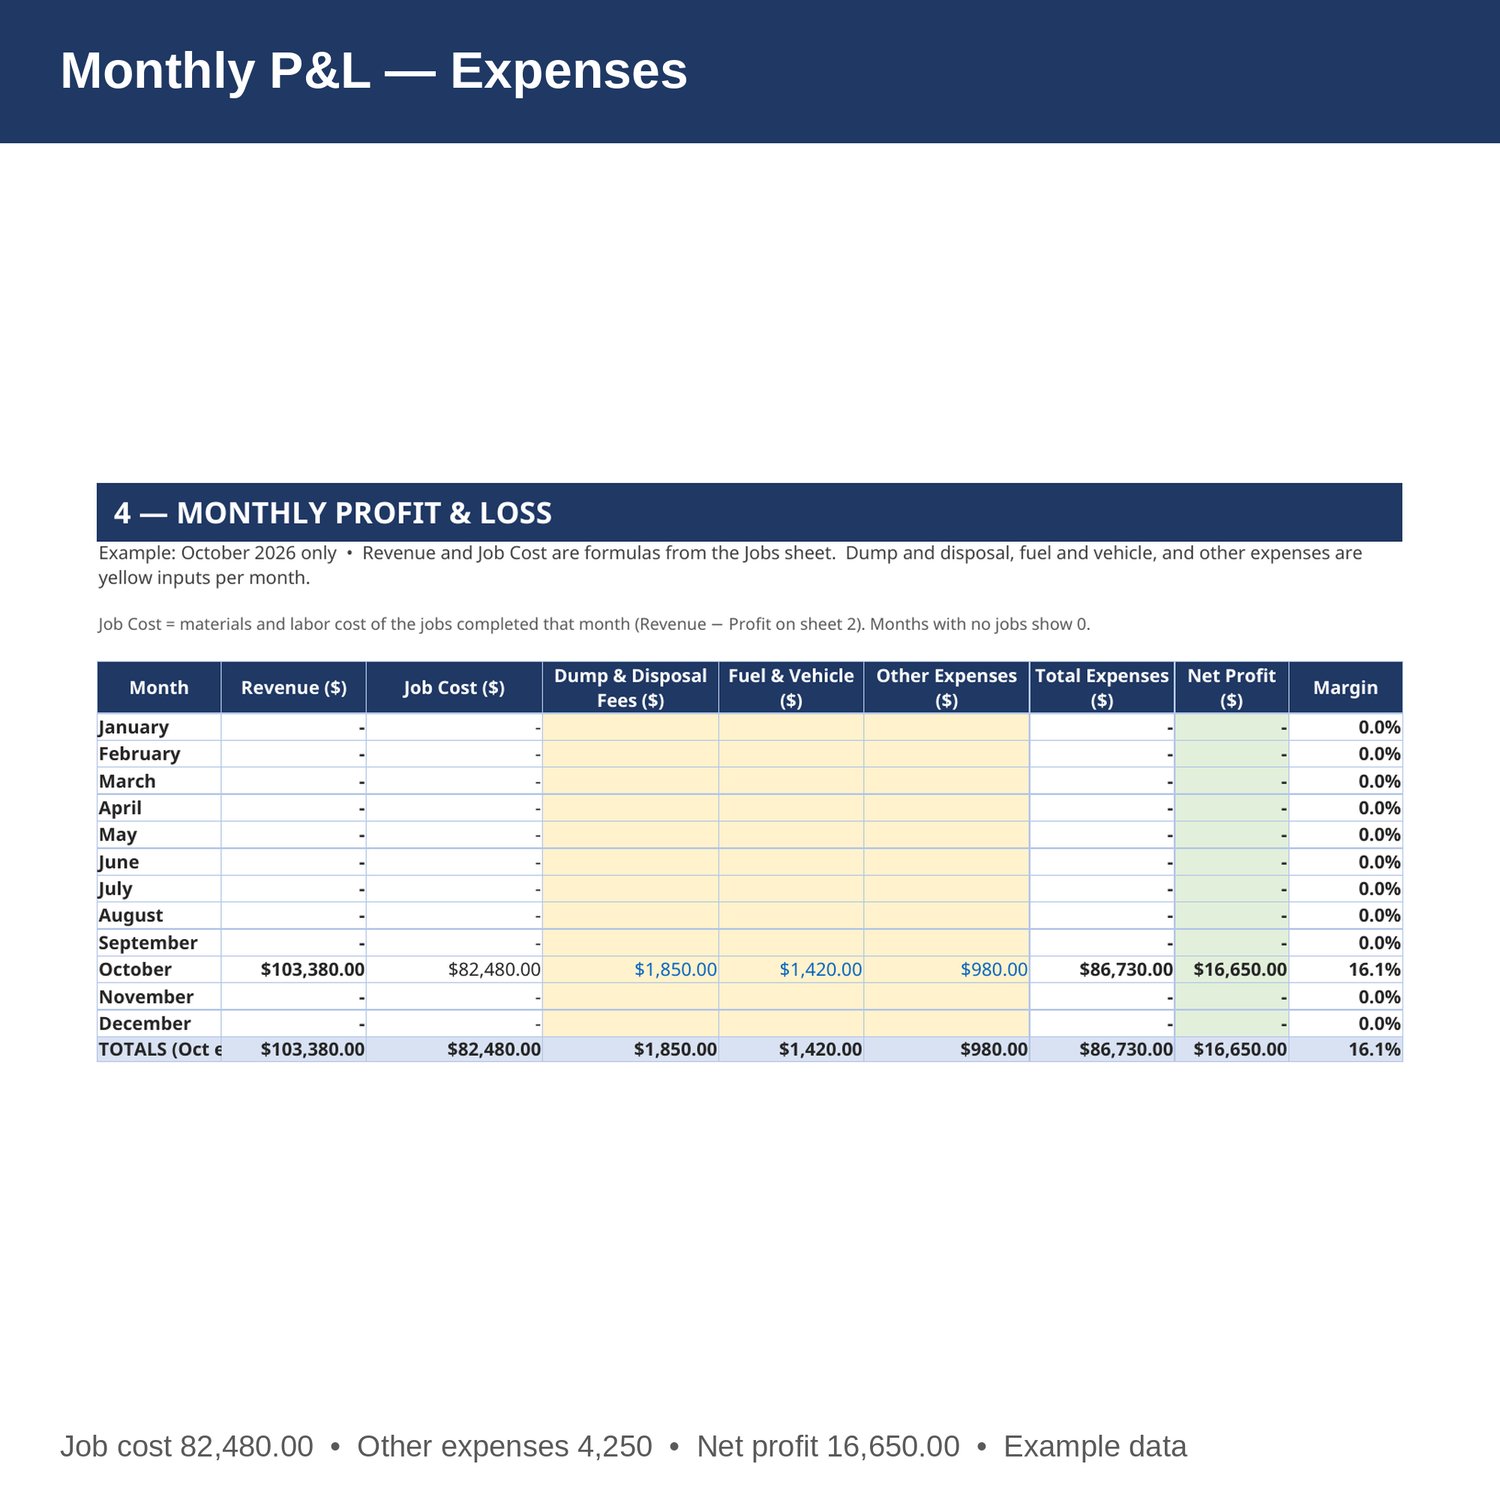
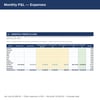
- Monthly P and L — revenue, job cost, dump and disposal fees, fuel and vehicle, and other expenses by month, Jan-Dec, with net profit and margin. Revenue and job cost are formulas from the Jobs sheet.
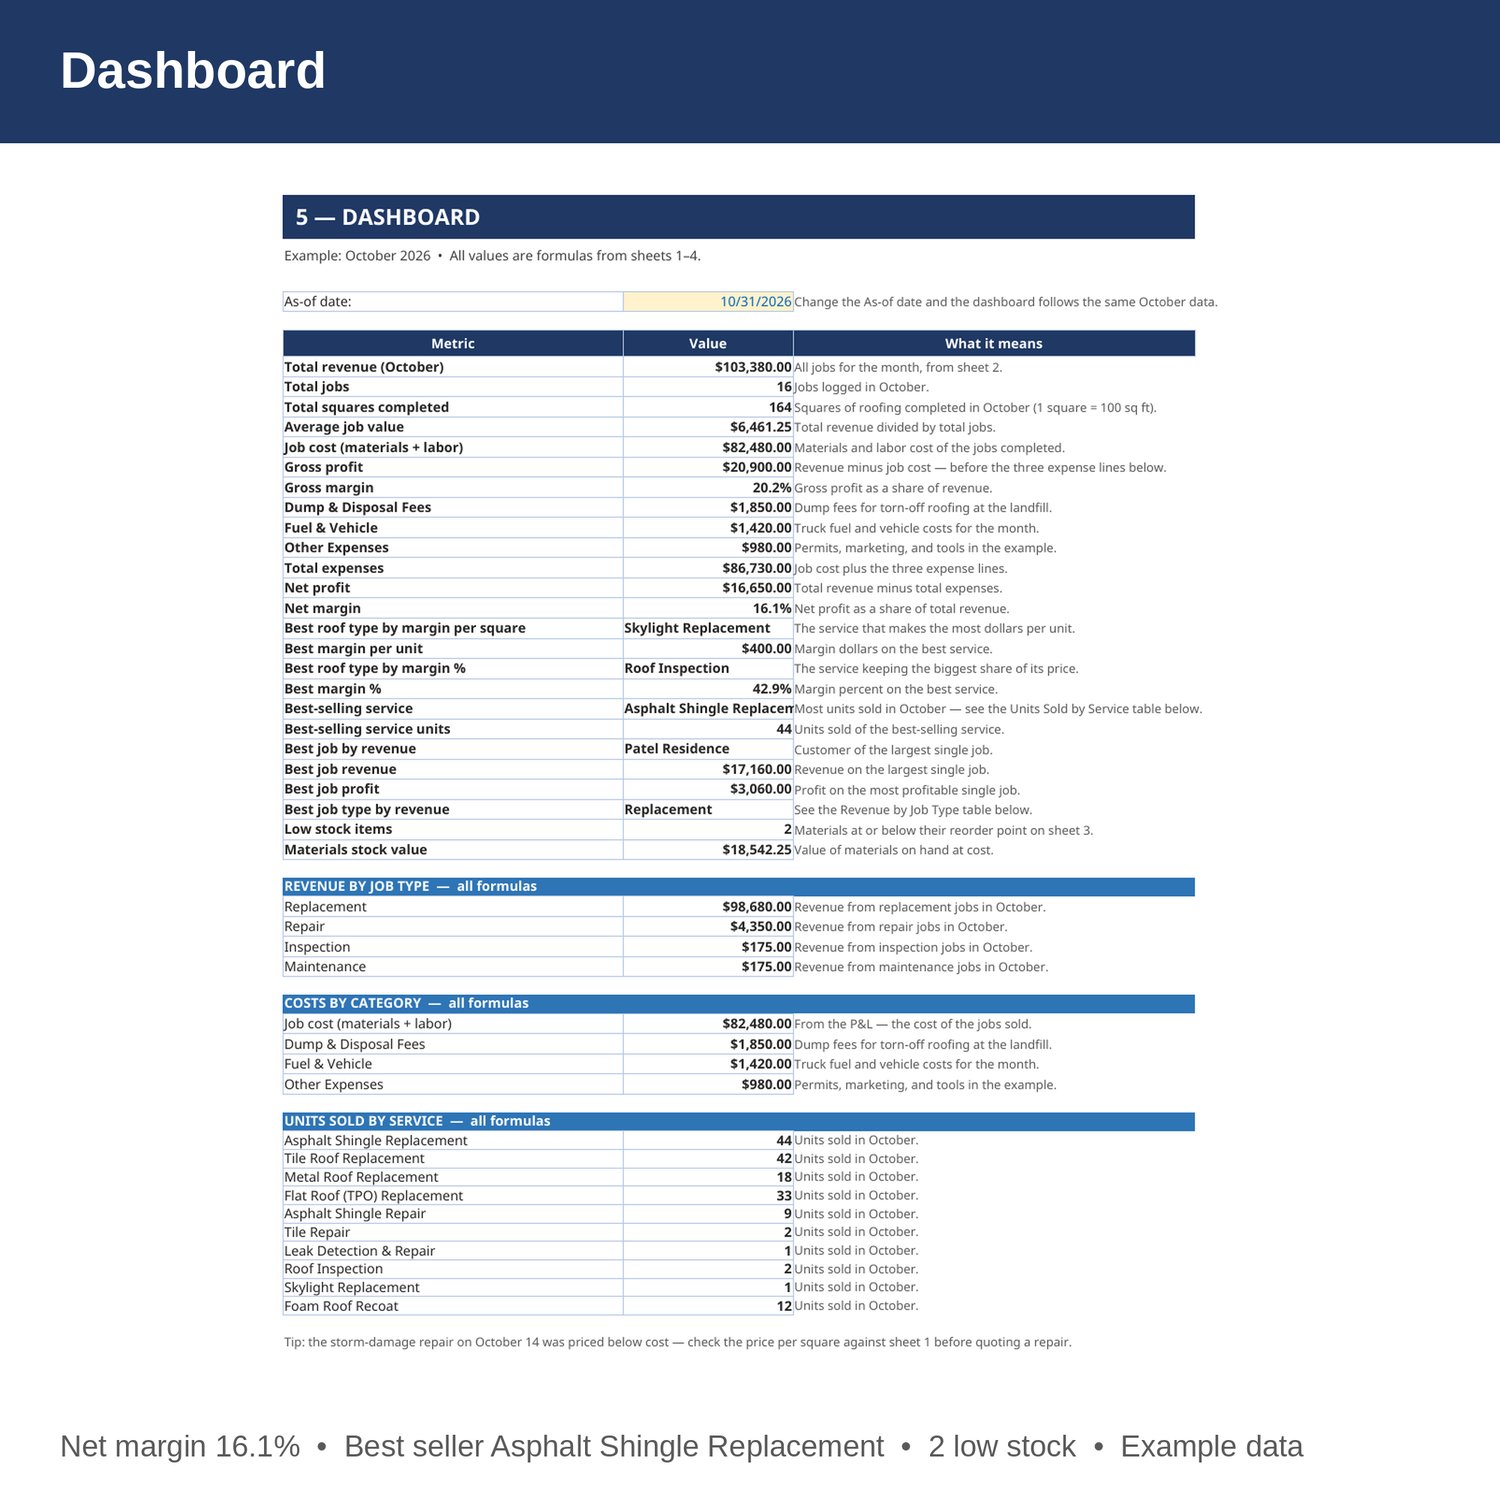
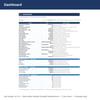
- Dashboard — total revenue, jobs, squares completed, average job value, gross and net profit and margin, best roof type by margin dollars and by margin percent, best-selling roof type, best job and best job type, costs by category, and low stock count.
- Cover and How to Use — start here. Yellow cells are the only ones you edit.
EXAMPLE DATA (October 2026 — replace with your own numbers):
- Total revenue 103,380 from 16 jobs and 164 squares; average job value 6,461.25.
- Job cost 82,480; gross profit 20,900; gross margin 20.2 percent.
- Dump and Disposal Fees 1,850; Fuel and Vehicle 1,420; Other Expenses 980; total expenses 86,730; net profit 16,650; net margin 16.1 percent.
- Revenue by job type: Replacement 98,680 (best), Repair 4,350, Inspection 175, Maintenance 175.
- Best service by margin per unit: Skylight Replacement, margin 400 per unit (cost 1,000 per unit, price 1,400). Best service by margin percent: Roof Inspection, 42.9 percent (cost 100 per unit, price 175).
- Best-selling service: Asphalt Shingle Replacement, 44 units sold. Next: Tile Roof Replacement 42, Flat Roof (TPO) Replacement 33.
- Best job: Patel Residence, Tile Roof Replacement — revenue 17,160, profit 2,860.
- Loss-making job: Storm Damage - Reed, Asphalt Shingle Repair — revenue 960, profit -80.
- Inventory: stock value 18,542.25; 2 items at or below reorder point — Pipe Vent Boots, Skylights.
- Average cost per unit across services 456; average margin percent 27.8 percent.
HOW IT WORKS:
1. Download the Excel file instantly after purchase.
2. On sheet 1, enter each roof type's squares per typical job, materials cost per job, labor cost per job, and price per square. Cost per unit and margin fill in by formula.
3. On sheet 2, log every job: date, customer, job type, roof type (spelled exactly as on sheet 1), quantity, and unit price. Revenue, cost per unit, and profit fill in by formula.
4. On sheet 3, keep quantities on hand current and set a reorder point for each material. Buy more of anything flagged LOW STOCK before the next job.
5. On sheet 4, enter dump and disposal fees, fuel and vehicle, and other expenses each month, then check gross and net profit on the Dashboard.
HOW THE NUMBERS WORK:
Cost per square is (materials cost per job plus labor cost per job) divided by squares per typical job. Margin per square is price per square minus cost per square. Margin percent is margin per square divided by price per square. Gross profit is revenue minus job cost; net profit is revenue minus job cost, dump and disposal fees, fuel and vehicle, and other expenses. One square is 100 square feet of roof.
WHO IT'S FOR:
Roofing contractors, roofers, and small roofing companies who want roof pricing, job profit, materials inventory, and a monthly P and L in one workbook — without accounting software.
PLEASE NOTE:
- This is a digital download. No physical item will be shipped.
- Works in Microsoft Excel and Google Sheets (upload to Google Drive to open in Sheets).
- Example data for October 2026 is included (10 services, 16 jobs, 164 squares, 12 materials). Replace it with your own numbers.
- The example is simplified: warranty callbacks and permit costs are not separate lines, so add them under Other Expenses if they apply to you. Check your local licensing and permit rules for roofing work.
- This is a bookkeeping and planning tool only, not tax, legal, or CPA advice.
- Due to the nature of digital downloads, refunds are not available. Message me before buying if you have a question.
Built by an accountant: B.S. Accountancy, ASU W. P. Carey, with revenue-reconciliation experience at Marriott and audit work at PwC.