





Rounding Tops & Bottoms Explained — Measured (PDF Guide)
A long slow arc is the one shape everybody can see and nobody can mark. There are no swing highs to join, no two points to make a line from, and no moment where it completes. So it gets called after the fact, on charts that already turned, and there is no way to say whether you found three this year or thirty.
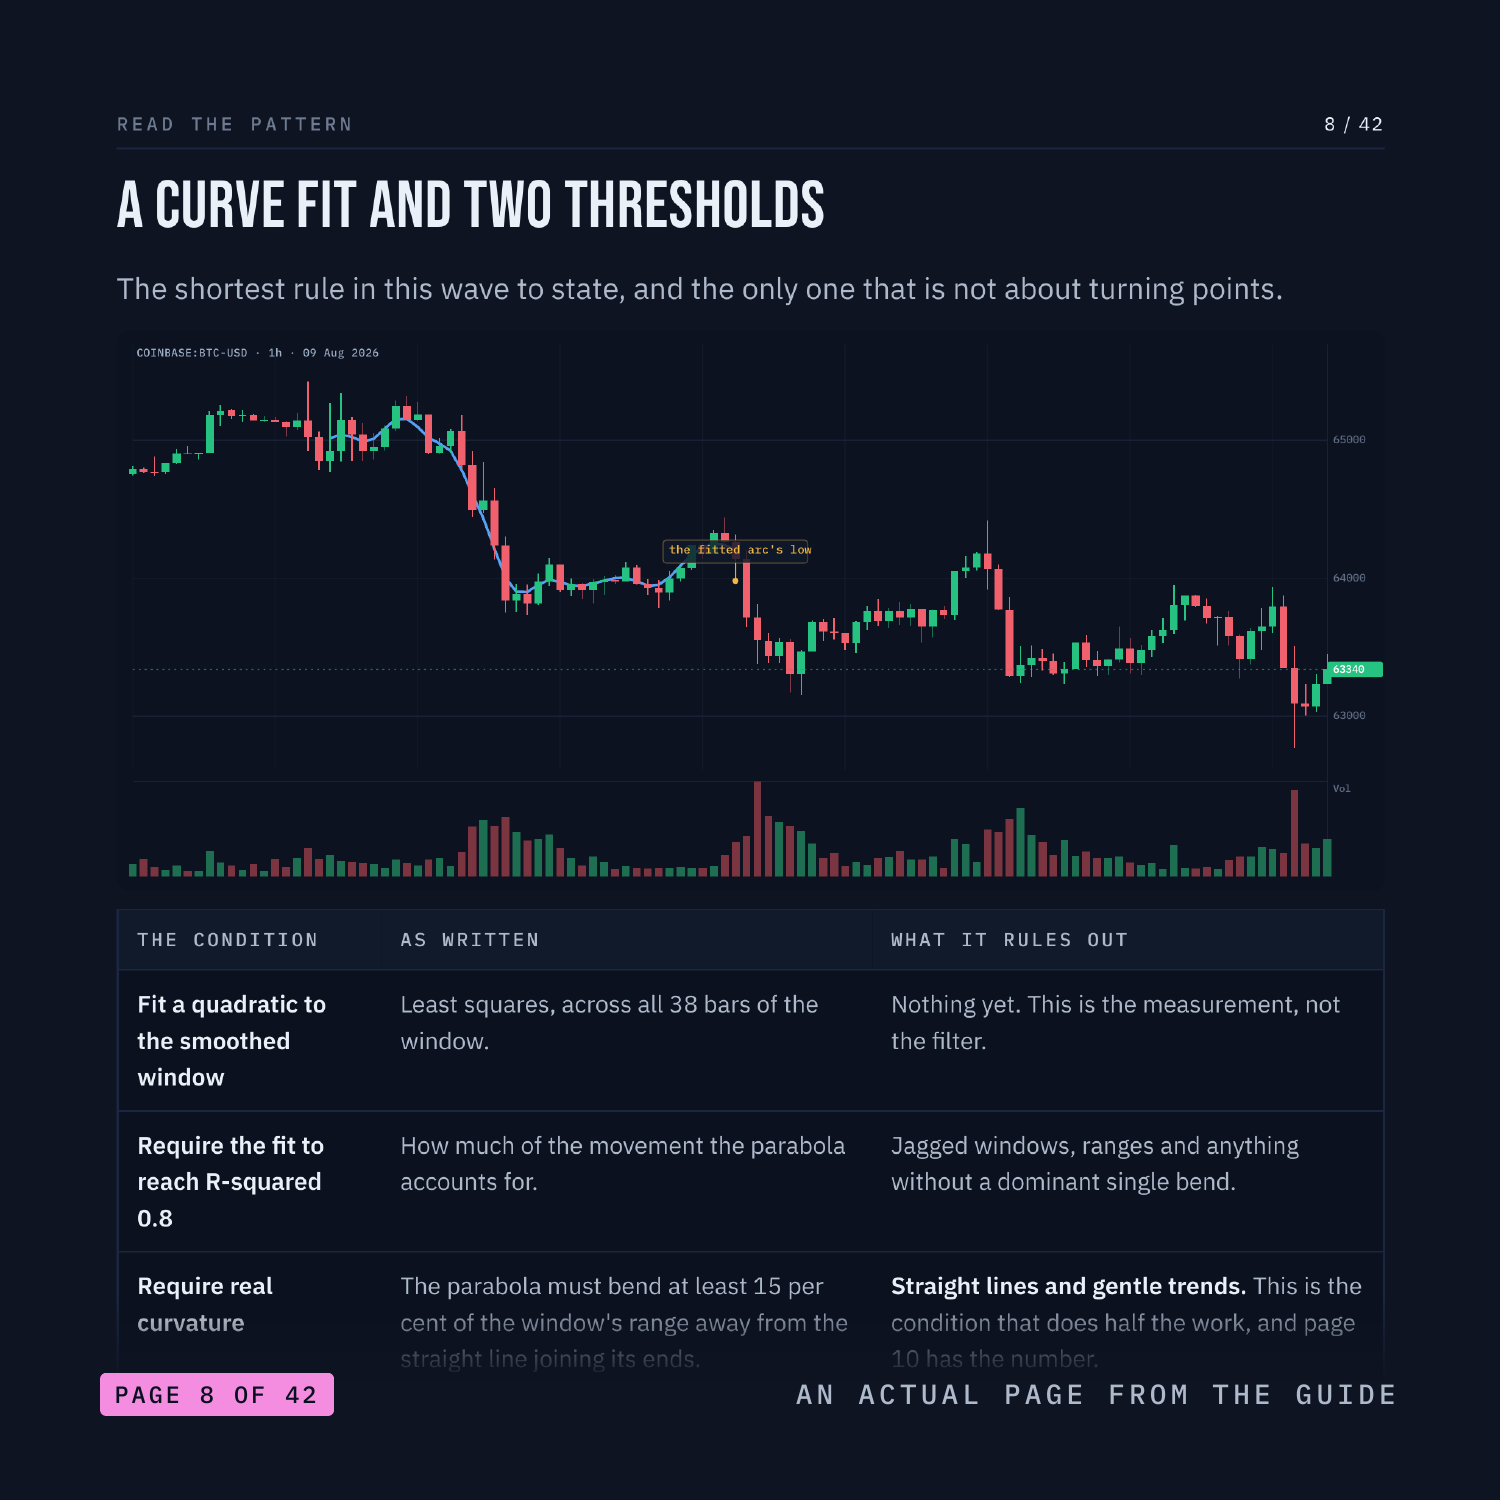
There is no published algorithmic definition, so this series wrote one and prints it: fit a quadratic to the smoothed window, require the fit to reach R-squared 0.8, and require the curve to bend at least 15 per cent of the window's range away from a straight line. Across 35,944 bars that gives 447 rounding bottoms and 410 tops. This is a 42-page PDF that teaches Rounding Tops & Bottoms from the first thing you see on the screen through to a written strategy with an entry, a stop and an explicit rule for when the trade is wrong.
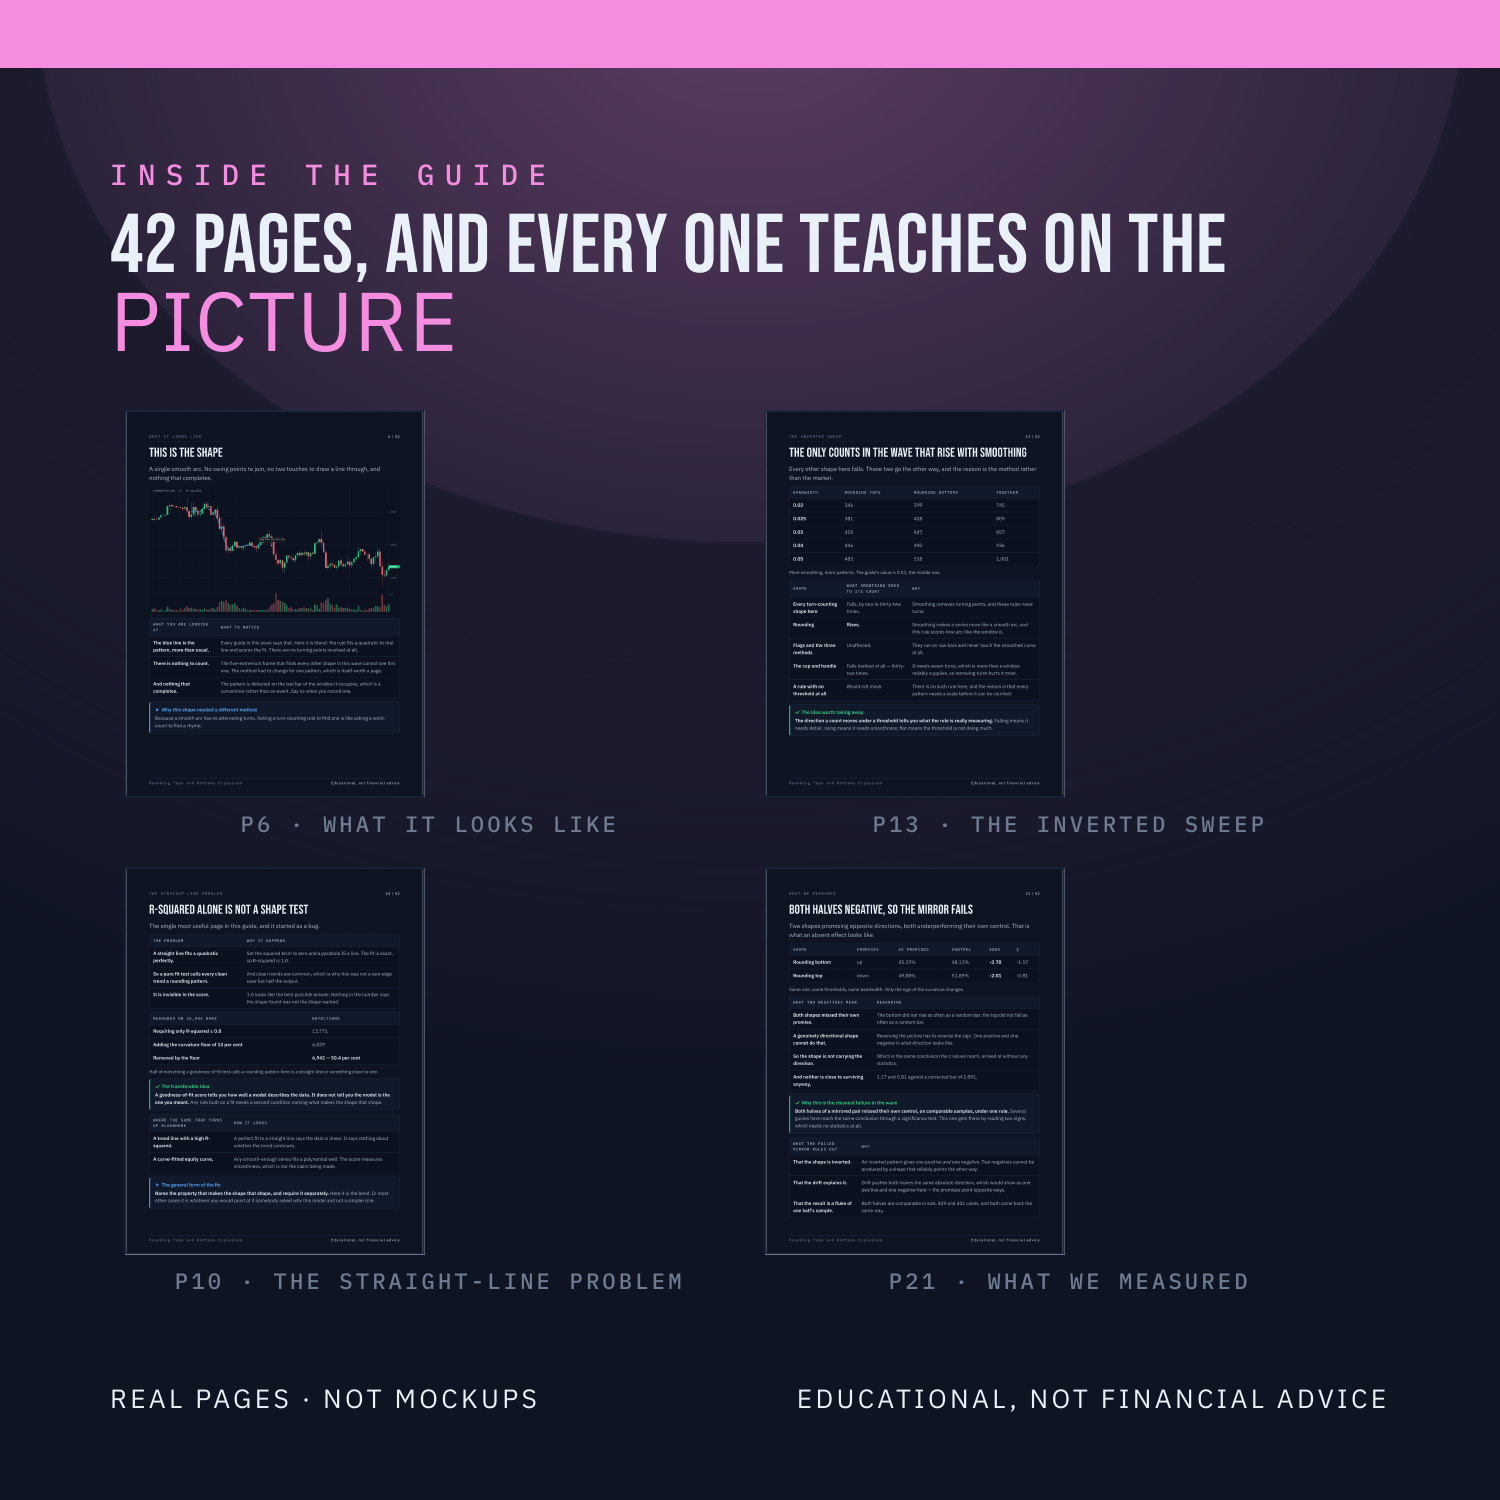
Nothing is taught underneath a chart. Every label sits on the candle, the line or the level it is describing, on real BTC, ETH, SOL and LINK charts, with the smoothed curve the detector actually saw drawn over the candles. There are three quizzes on real charts, each followed by the same chart re-shown annotated with the reasoning, plus faded practice pages where the first steps are filled in and you finish the rest.
WHAT'S INSIDE
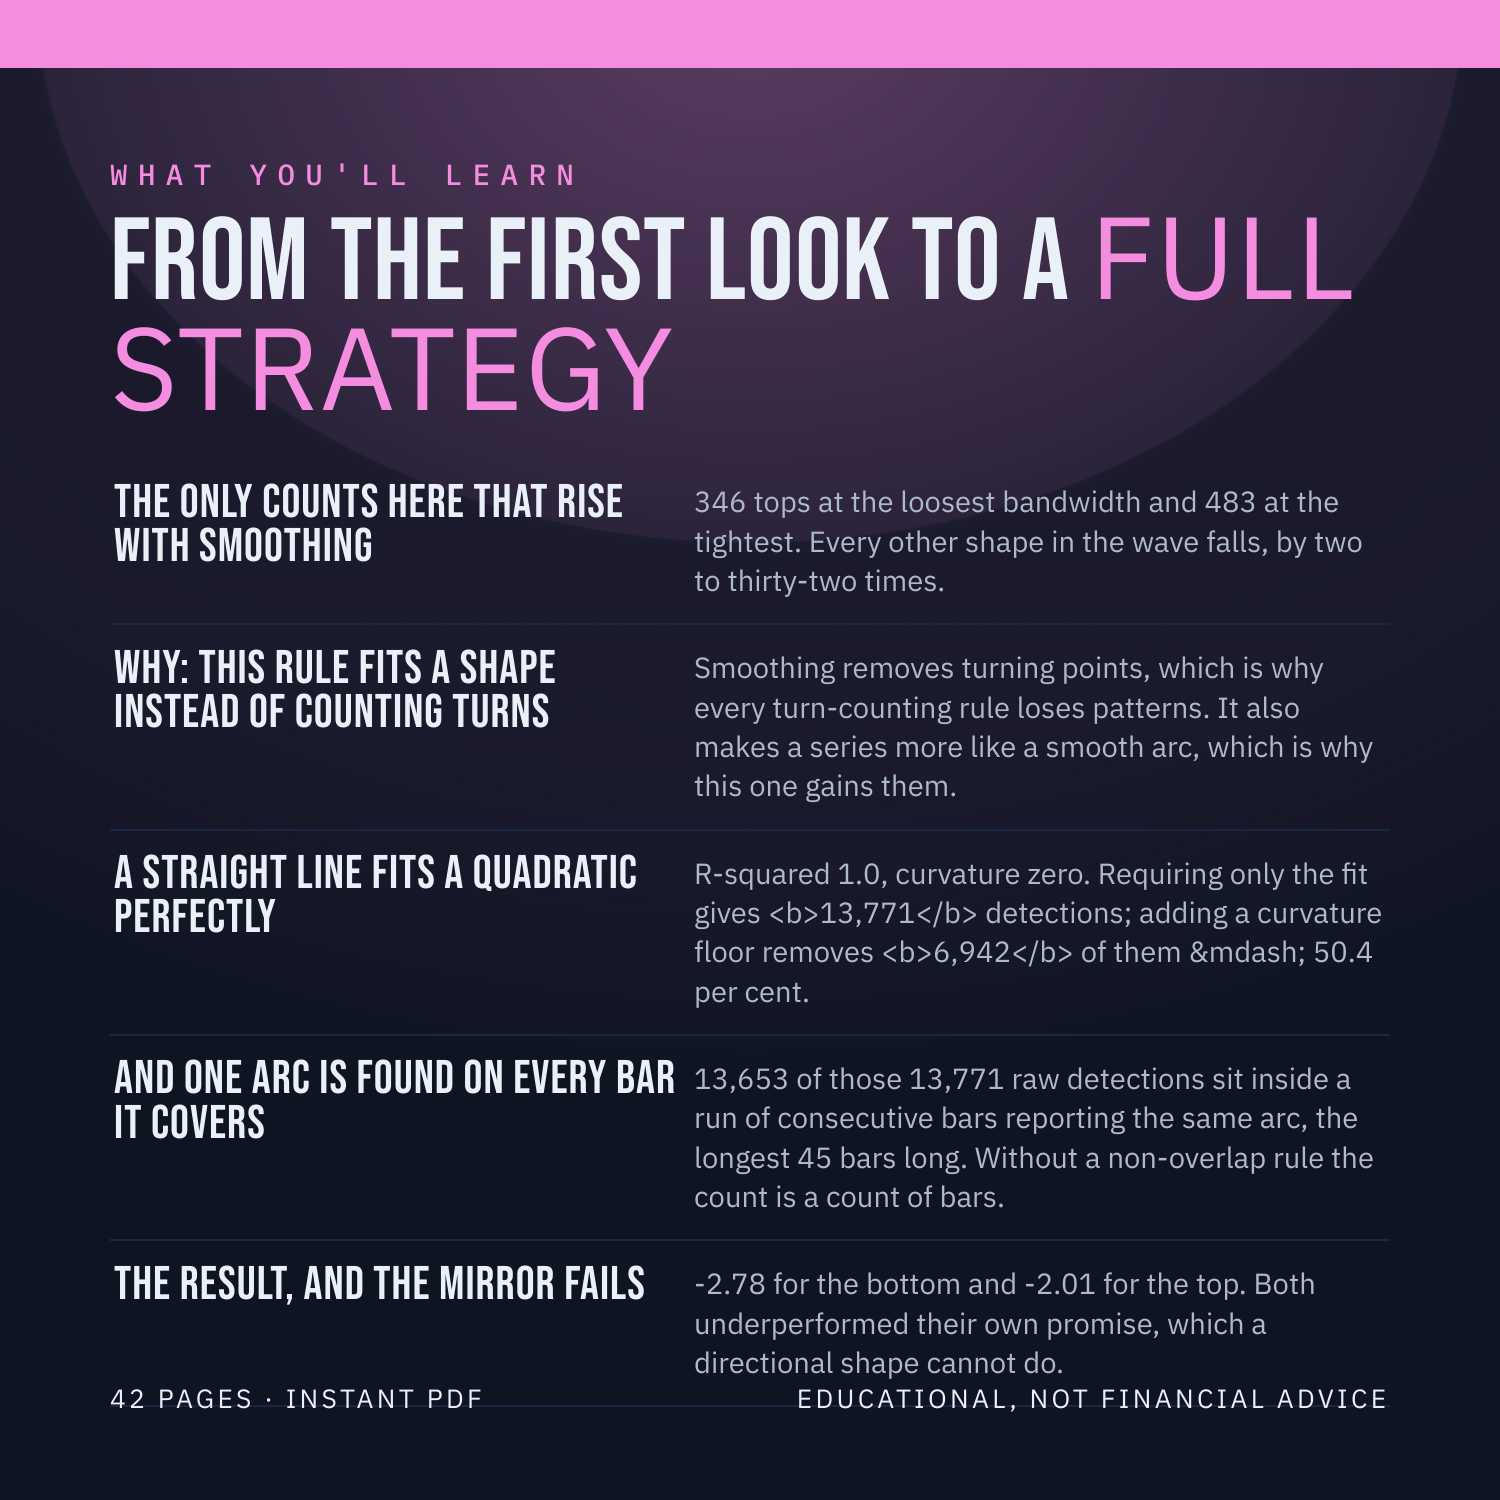
The only counts here that rise with smoothing - 346 tops at the loosest bandwidth and 483 at the tightest. Every other shape in the wave falls, by two to thirty-two times.
Why: this rule fits a shape instead of counting turns - smoothing removes turning points, which is why every turn-counting rule loses patterns. It also makes a series more like a smooth arc, which is why this one gains them.
A straight line fits a quadratic perfectly - R-squared 1.0, curvature zero. Requiring only the fit gives 13,771 detections; adding a curvature floor removes 6,942 of them, 50.4 per cent.
And one arc is found on every bar it covers - 13,653 of those 13,771 raw detections sit inside a run of consecutive bars reporting the same arc, the longest 45 bars long. Without a non-overlap rule the count is a count of bars.
The result, and the mirror fails - -2.78 for the bottom and -2.01 for the top. Both underperformed their own promise, which a directional shape cannot do.
WHAT YOU'LL BE ABLE TO DO
Mark a rounding pattern by rule rather than after the fact.
Explain why a goodness-of-fit score is not a shape test.
Say why this pattern's count moves the opposite way from every other.
Spot when a detector is counting bars rather than patterns.
Read a failed mirror test correctly.
AN HONEST NOTE
A rounding pattern is a clue, not a crystal ball. It describes what price has already done. This guide contains no win-rates, no backtest results and no promises about what you will make, because nobody can verify those and you should not trust anyone who prints them. What it hands you instead is a set of rules you can test yourself on TradingView in an afternoon. Educational, not financial advice.
Instant download. 42 pages, PDF.