
Uganda_HIV_National_Conversation_PROPIMS
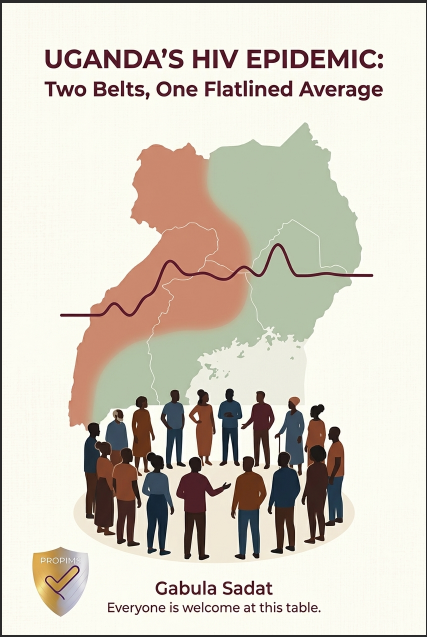
Uganda's HIV Epidemic: Two Belts, One Flatlined Average
A Call for an Open National Conversation — Gabula Sadat, PROPIMS Limited
Why We Share This
UPHIA 2025 shows a picture no single institution can address alone. This is an invitation—not solutions—for government, NGOs, donors, teachers, farmers, traders, students, religious and cultural leaders, and people living with HIV to look together at the data.
How to Read Responsibly
HIV is not a moral issue. People living with HIV are partners, not problems. Low prevalence does not mean low risk. High prevalence does not mean failure. This is learning, not blaming.
1. The Decline Has Stalled
National prevalence: 6.0% (2016/17) → 5.8% (2020/21) → 5.9% (2025). About 1.49 million adults live with HIV. The average has flatlined.
2. One Figure, Two Realities
Above 5%: South Western 8.0%, Central 1 (7.3%), Central 2 (7.2%), Mid North (6.8%), Mid Western (6.1%), Kampala (5.4%).
Below 5%: Teso 4.8%, Mid-Eastern 4.4%, Busoga 4.0%, West Nile 1.4%, Karamoja 1.3%.
Gap: 6.7 points. Conditions—mobility, economy, access—are unevenly distributed.
3. The Trend
South Western fell to 6.3% then rose to 8.0%. Mid Western rose to 6.1%. Kampala fell to 5.4%. Karamoja fell to 1.3%. The epidemic is becoming more geographically concentrated.
4. Treatment Outcomes Differ
South Western has the highest prevalence AND the highest viral suppression (92.3%). Mid-Eastern has low prevalence but the lowest suppression (78.0%). Low suppression points to access barriers, not failure.
5. Questions We Must Ask Together
Why has prevalence stayed high for a decade? Why have low-prevalence regions fallen further? What drives these differences? What can we learn? Why does suppression vary? What barriers remain?
6. What We Ask
A national conversation starting from data, open to new questions. No predetermined conclusions. Participants need curiosity, not solutions. People living with HIV must be at the centre.
7. Shared Responsibility
The Ministry of Health can convene, but the response belongs to all of us.
Everyone is welcome at this table.
Data: UPHIA 2016/17, 2020/21, 2025. Regional groupings are analytical, not official. This is an invitation to conversation, not policy.
Gabula Sadat | mrgabulas@gmail.com | +256 780 958 736