

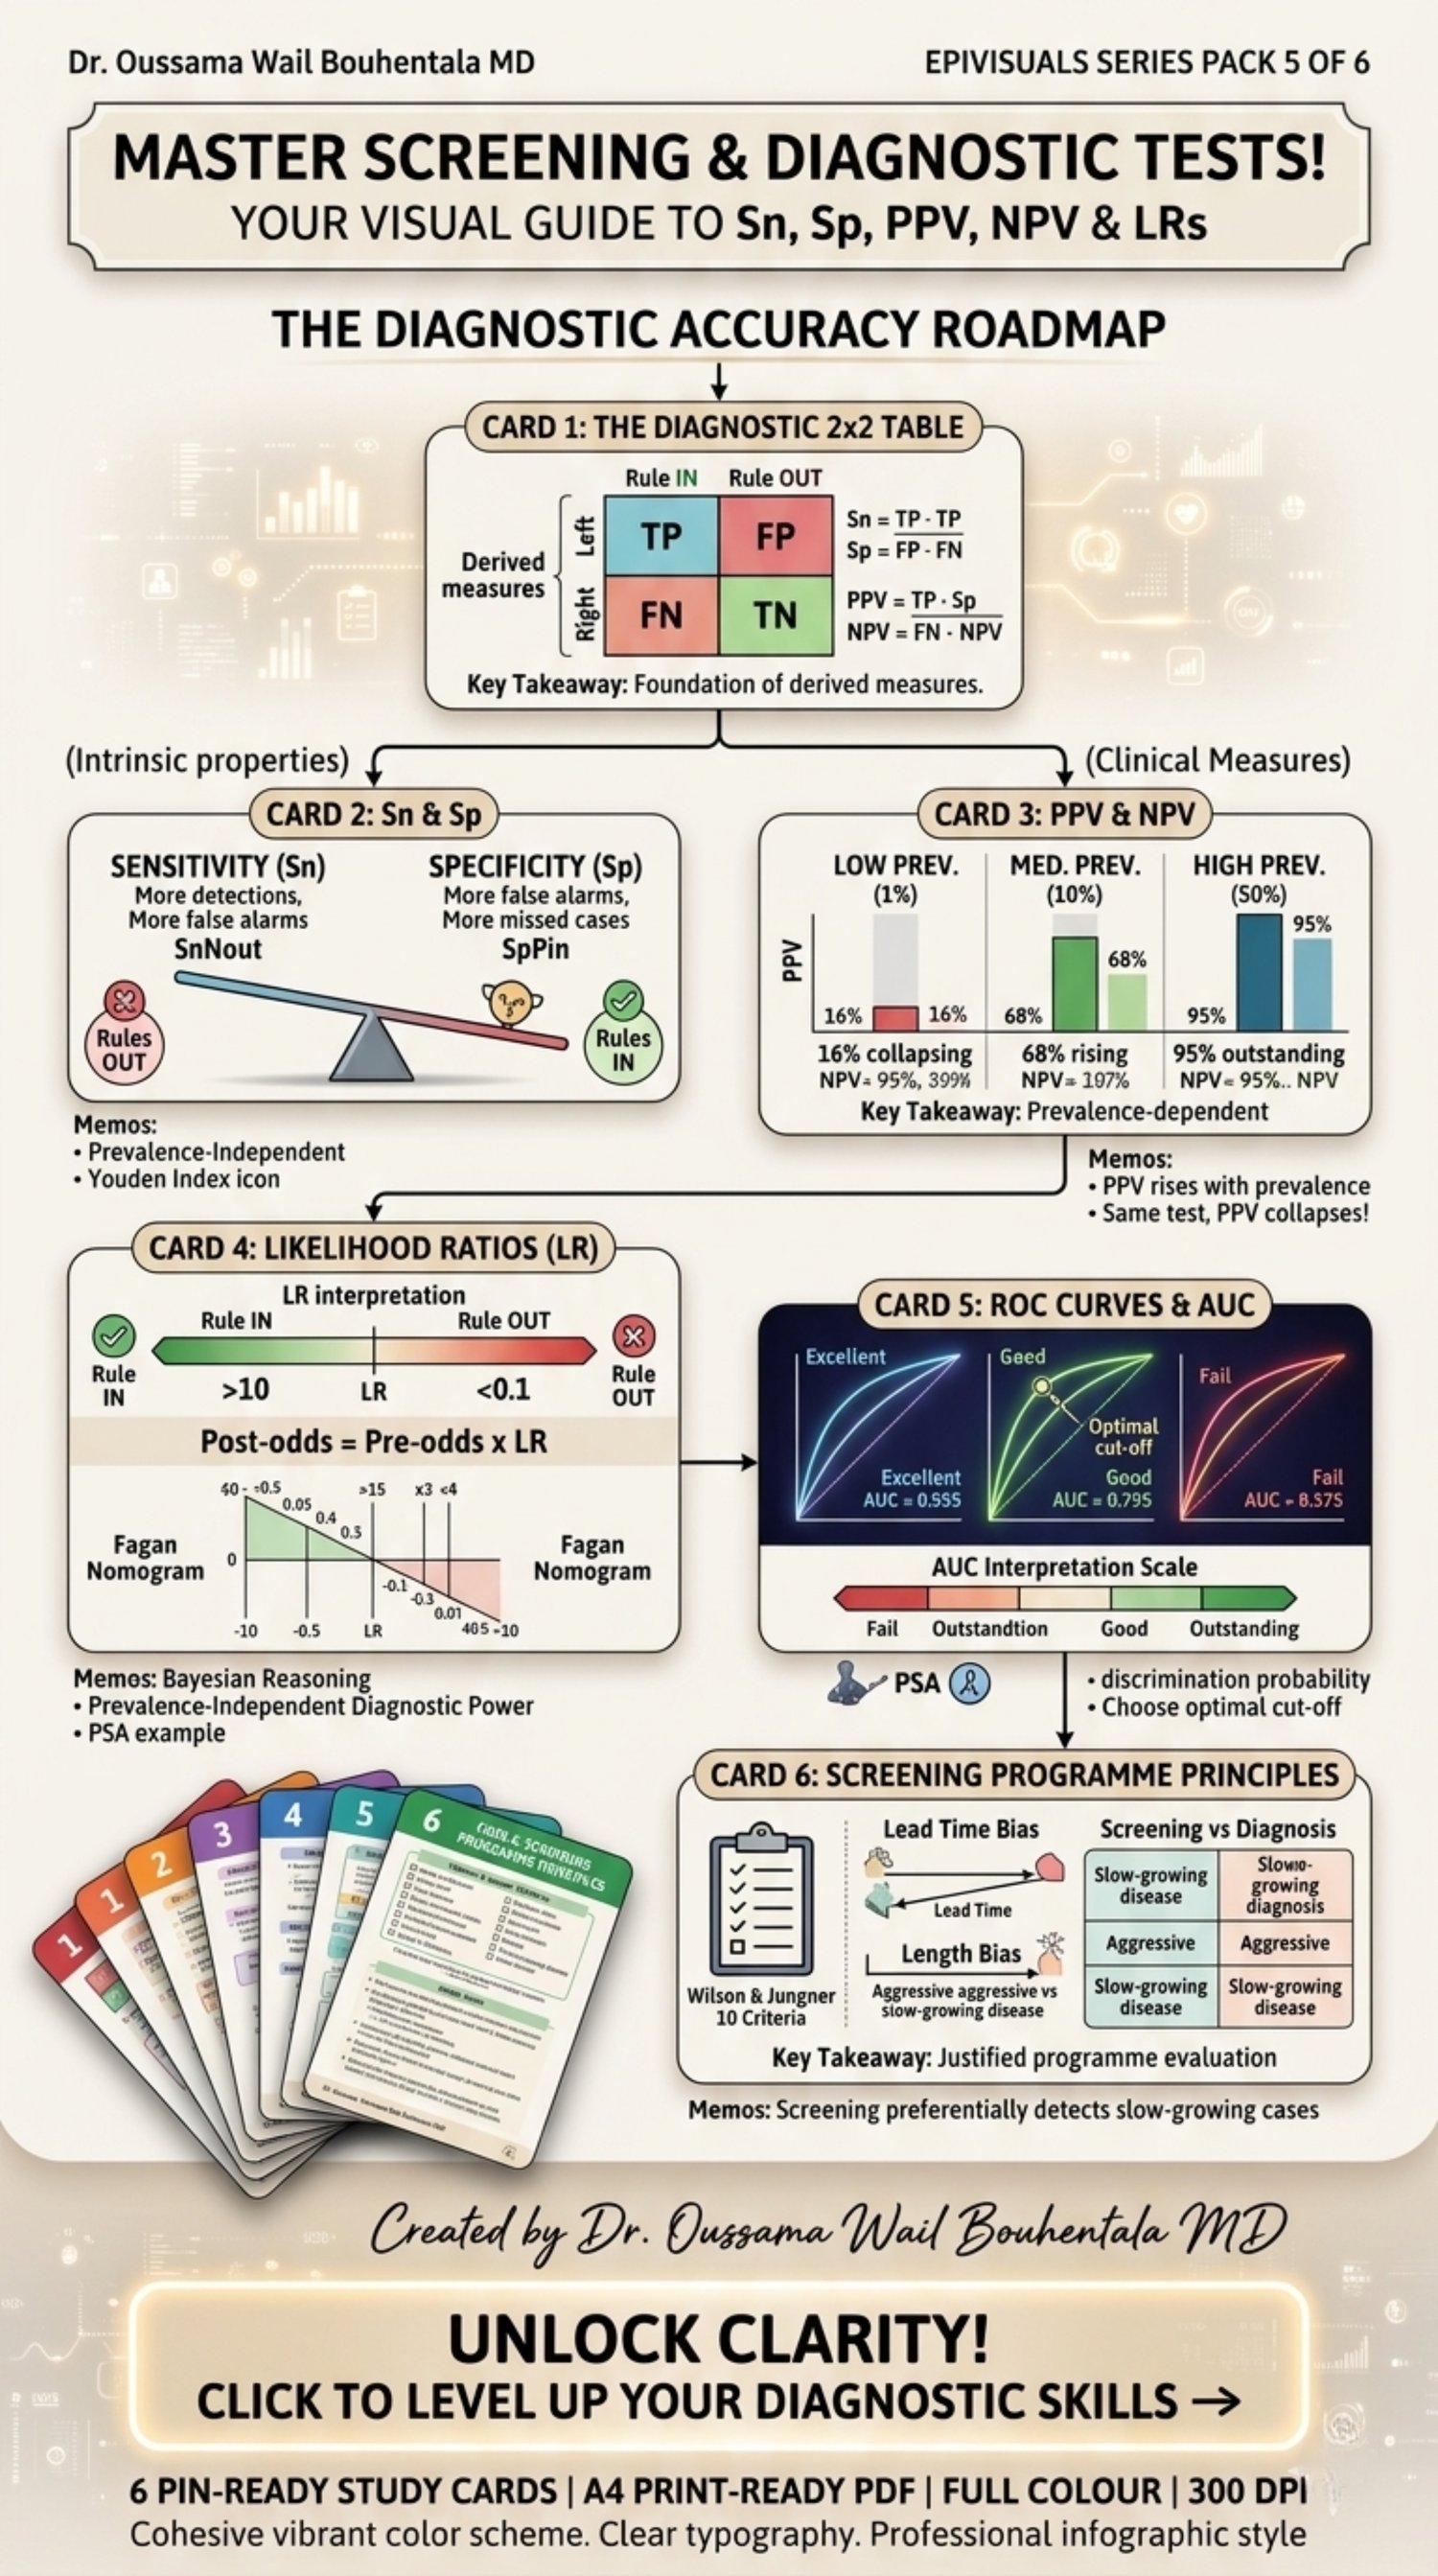
EpiVisuals Pack 5: Screening & Diagnostic Accuracy – 6 Digital Study Cards
On Sale
$4.99
$4.99
Stop Guessing. Start Quantifying Diagnostic Certainty.
Confused by the difference between sensitivity and $PPV$? Struggling to explain how prevalence changes your test results? EpiVisuals Pack 5 is a high-impact visual masterclass in diagnostic math. Created by Dr. Oussama Wail Bouhentala, this pack transforms abstract statistical concepts into intuitive, "pin-ready" visual guides designed for rapid learning and exam success.
What’s Inside the Pack?
This digital download features 6 high-resolution A4 study cards:
- The Diagnostic $2\times2$ Table: The absolute foundation. Learn the 8 derived measures and never mix up your denominators again.
- Sensitivity ($Sn$) & Specificity ($Sp$): Master the "Intrinsic Properties" of a test. Includes the SnNout and SpPin mnemonics and the trade-off see-saw.
- PPV & NPV: Understand why these measures collapse as prevalence changes. Features a three-panel visual demonstration of the prevalence effect.
- Likelihood Ratios (LR): The prevalence-independent powerhouse. Includes the Fagan Nomogram and Bayesian reasoning for post-test odds.
- ROC Curves & AUC: Learn to optimize cut-offs and interpret the Area Under the Curve (AUC) like a pro.
- Screening Principles: A deep dive into the Wilson & Jungner criteria, lead-time bias, and length bias.
Why Choose EpiVisuals?
- Clinical Logic: Moves beyond simple math to show you how to use these tools in a clinical or public health setting.
- Exam-Ready: Essential for USMLE Step 1 & 2, MPH board exams, and medical residency preparation.
- Visual Decision Tools: Learn to choose the optimal cut-off based on whether you need to rule-in or rule-out a disease.
- High Utility: Perfect for students, researchers, and public health practitioners evaluating new screening programs.
Format: High-resolution PDF | A4 Full Color | Print-ready (300 DPI).
Pinterest Pin Description
Pin Title: 🧪 Master Diagnostic Math | Sn, Sp, PPV & ROC Curves Visual Guide