







Pivot Points Explained — Daily Support & Resistance + a Bounce Strategy
On Sale
$7.00
$7.00
Here's the Pivot Points guide, same template:
🎯 Hook
Stop guessing where support and resistance are.
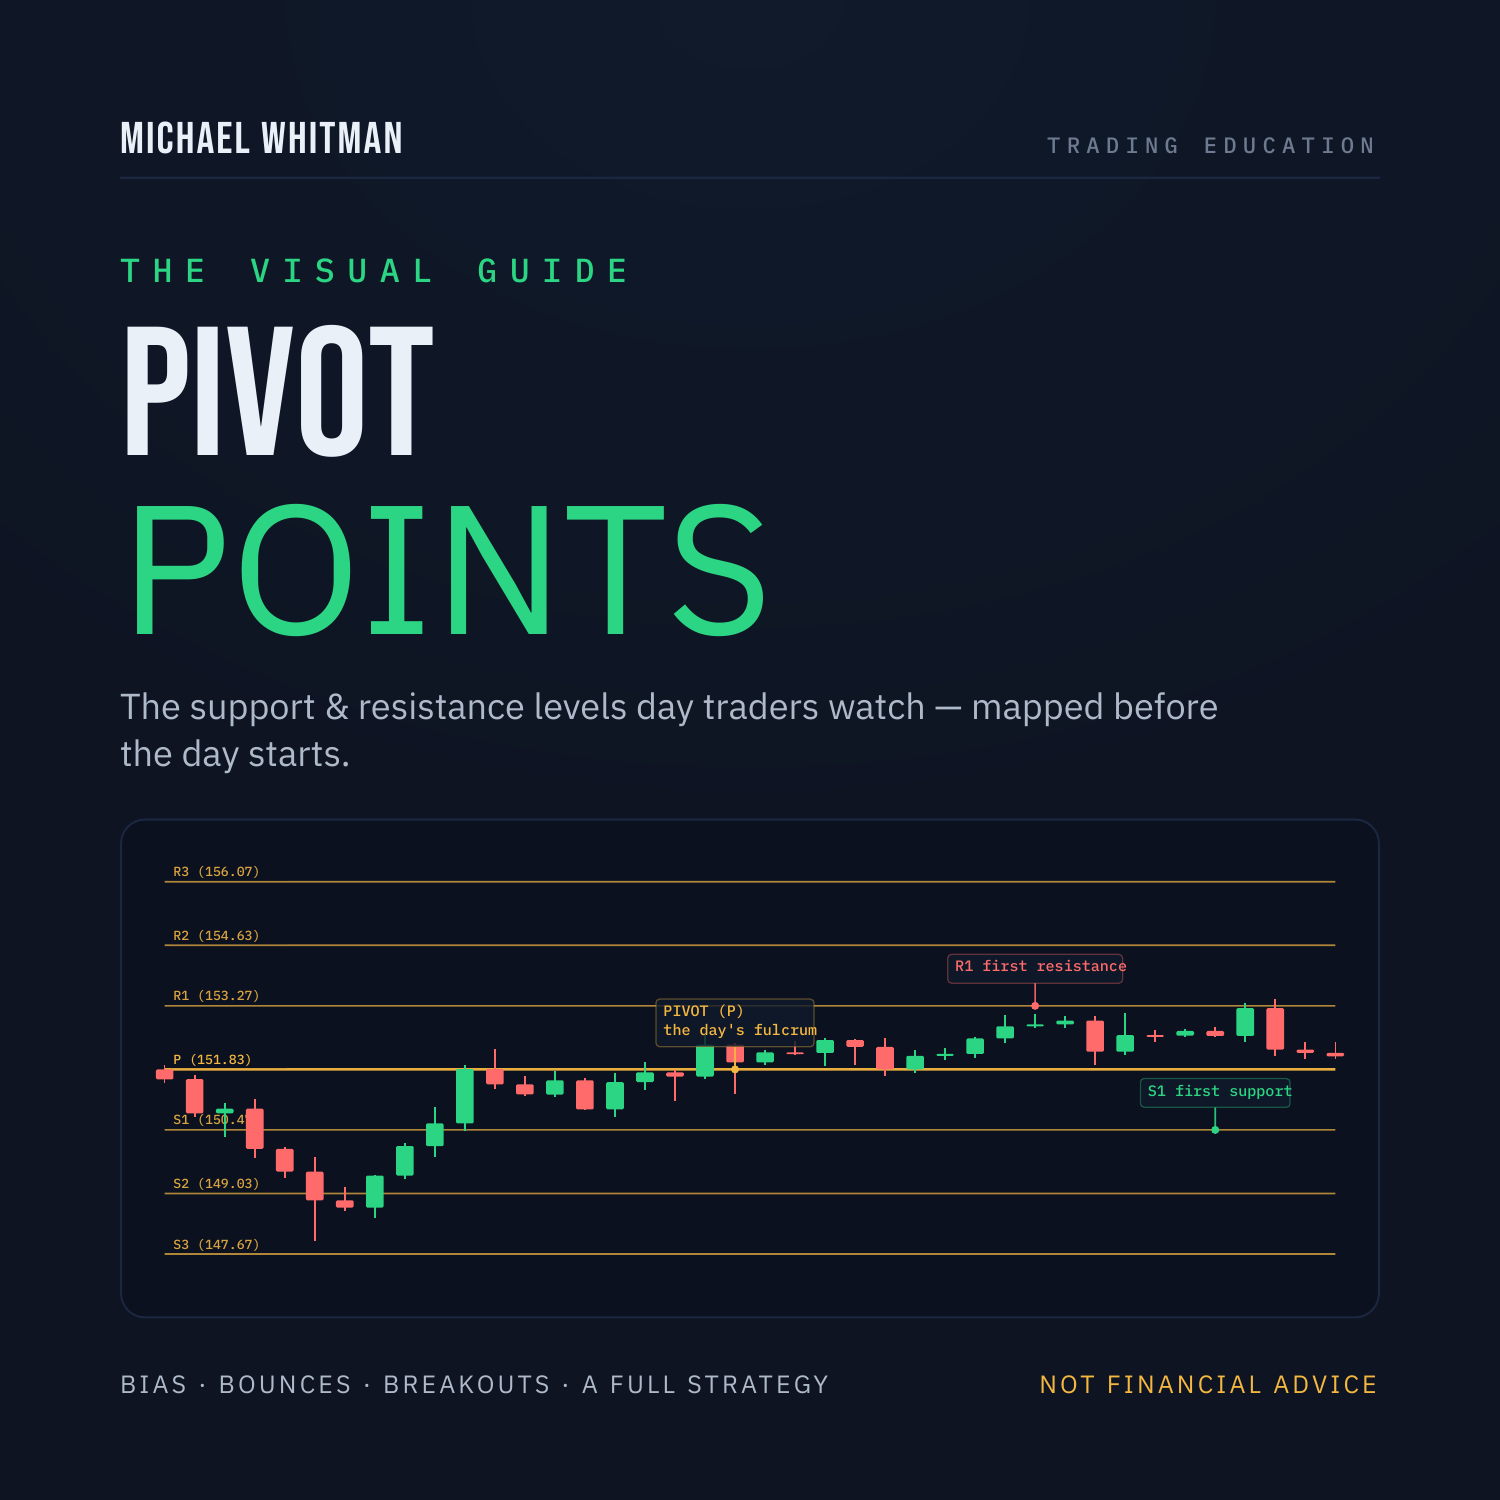
Pivot points hand you seven exact levels for the day — calculated automatically from yesterday's price — and because thousands of traders watch the same numbers, price actually respects them.
📘 What It Is
Pivot Points Explained — a clean, beginner-friendly PDF that teaches the tool visually.
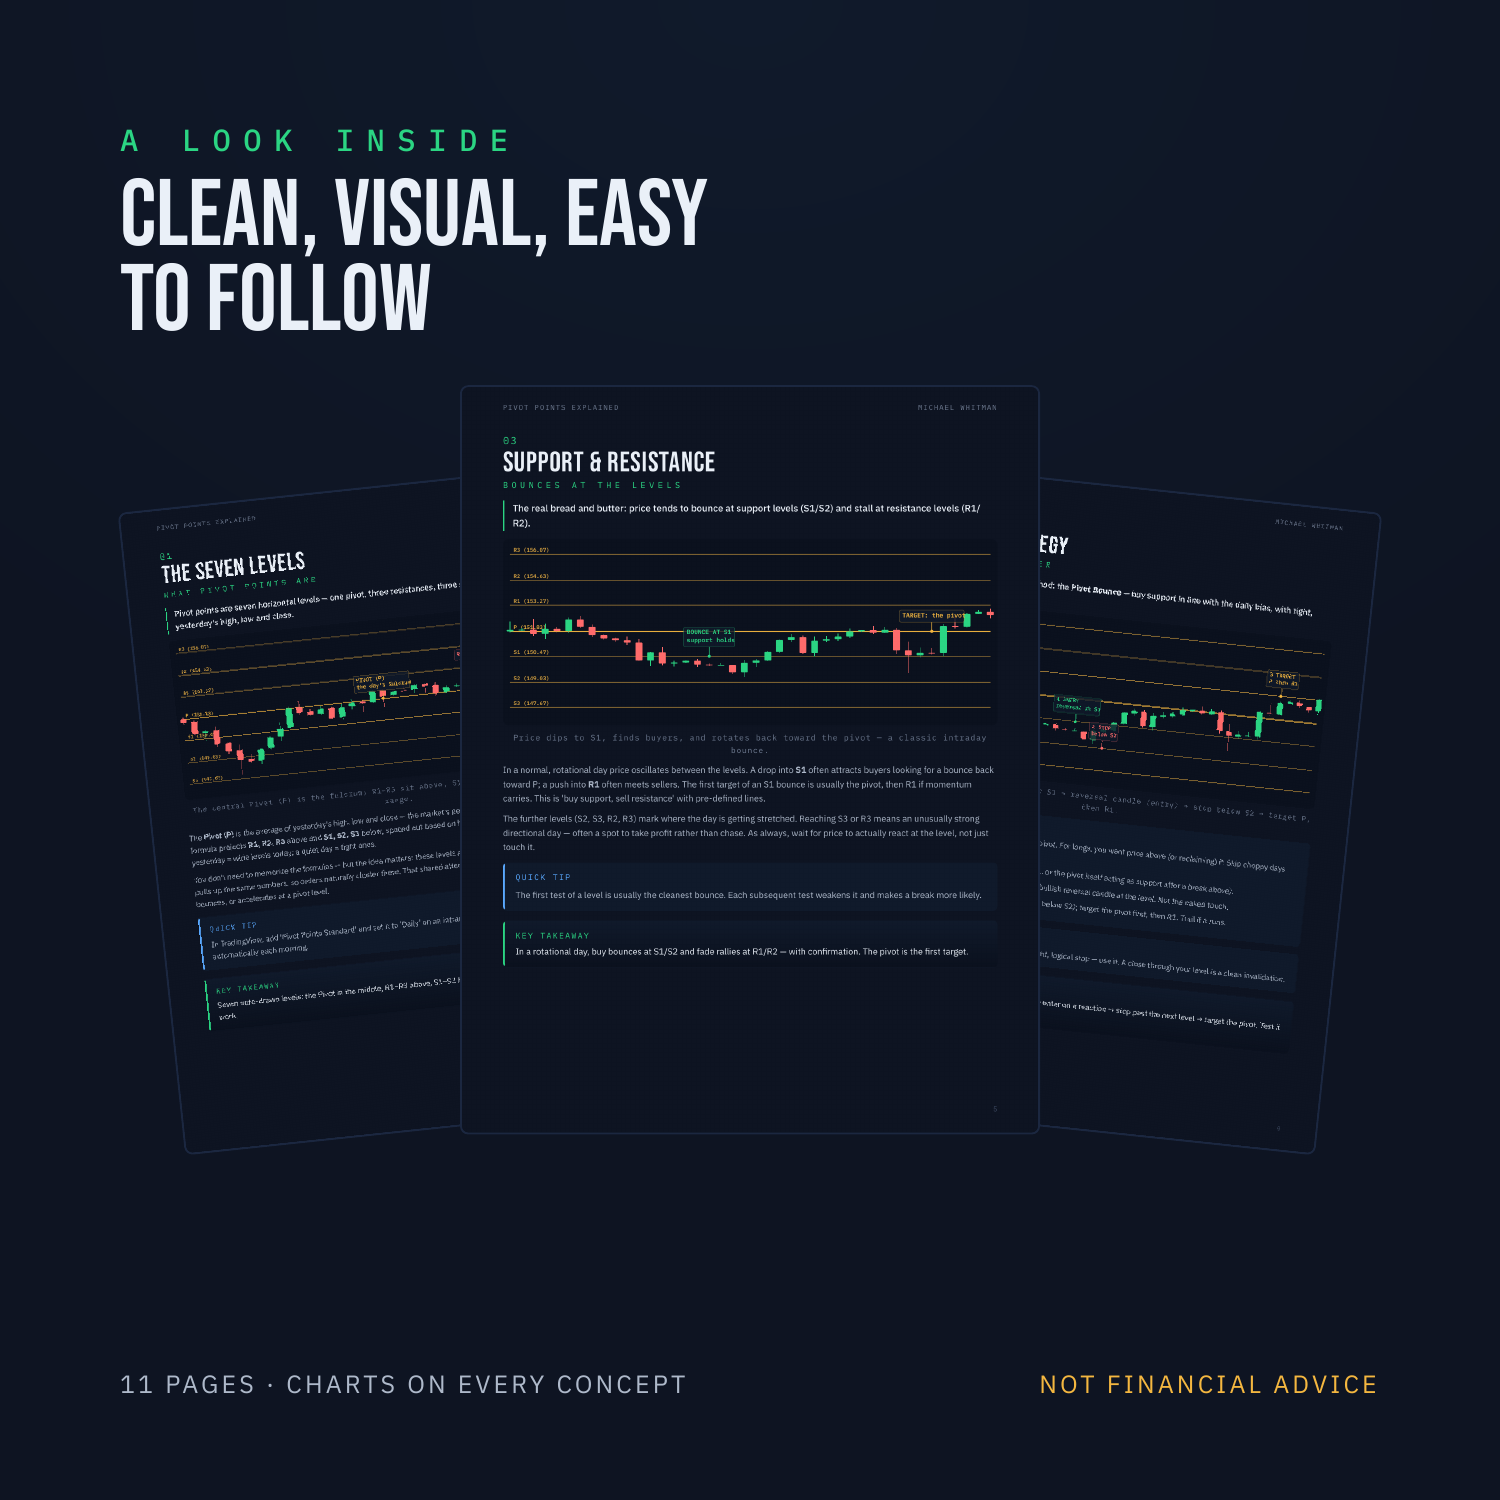
- Every concept shown on a real, hand-drawn chart
- Ends with a step-by-step strategy + printable checklist
📂 What's Inside
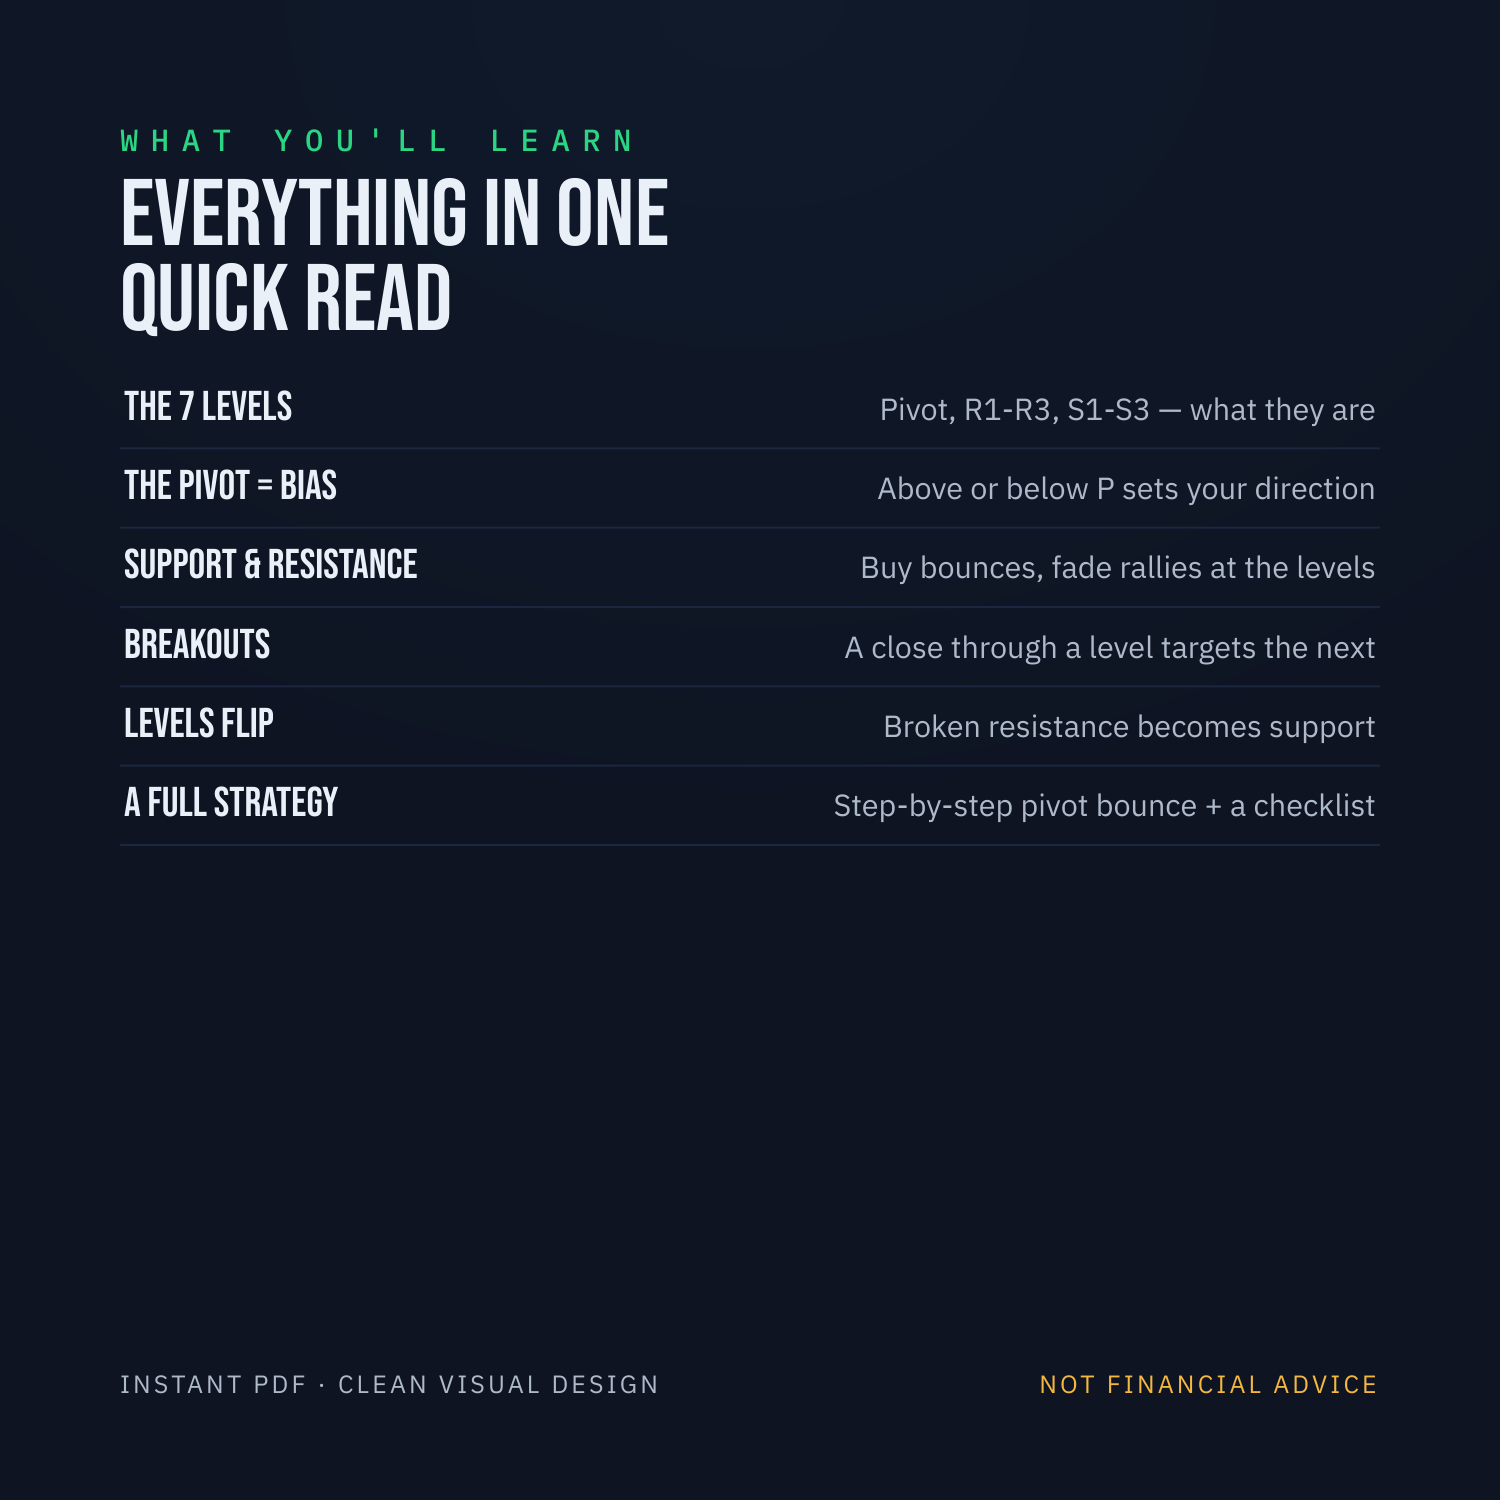
- The seven levels — the Pivot plus R1/R2/R3 and S1/S2/S3, and where they come from
- The pivot = bias — above or below P sets your direction for the day
- Support & resistance — buy the bounces, fade the rallies at the levels
- Breakouts — when a level breaks, it targets the next one
- Levels flip — broken resistance becomes support (and vice-versa)
- The #1 mistake — why blindly fading a level gets you run over
- Full strategy — step-by-step pivot bounce + pre-trade checklist
✅ What You'll Be Able To Do
- Know your key levels before the market even opens
- Set your daily bias in one glance
- Trade high-probability bounces and breakouts with tight, obvious risk
- Follow a simple, testable strategy with a clean invalidation
⚠️ The Honest Note
Pivot points are objective levels the market watches — they're clues, not a crystal ball. Price breaks them all the time.
Educational only, not financial advice.
📦 What You Get
- Instant PDF download — 11 pages, clean visual design
- Works on any device — yours forever
- Pairs with: RSI, MACD, EMA, Stochastic, Bollinger Bands, Fibonacci, VWAP, Ichimoku guides + the Pro Trading Journal