


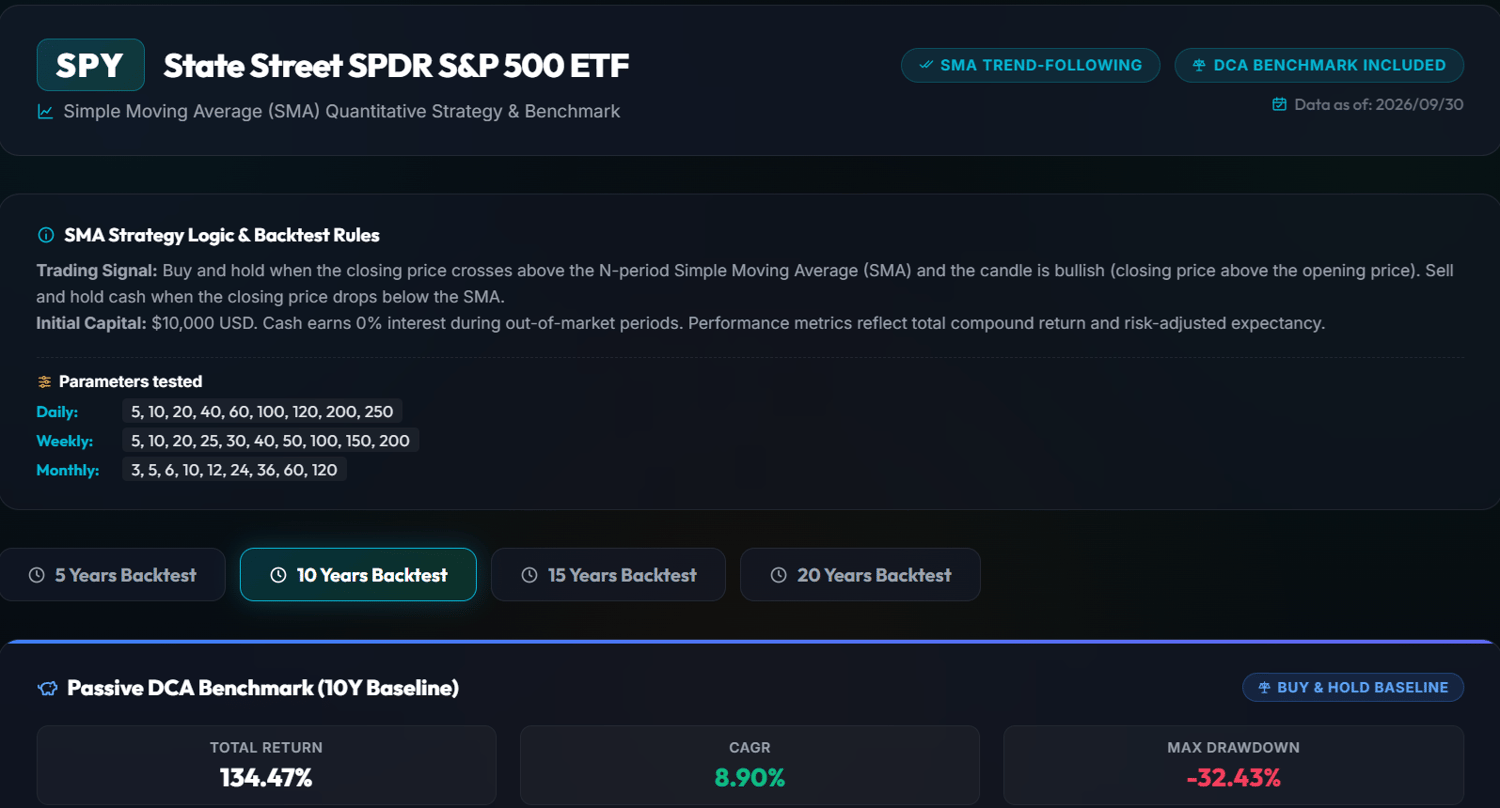
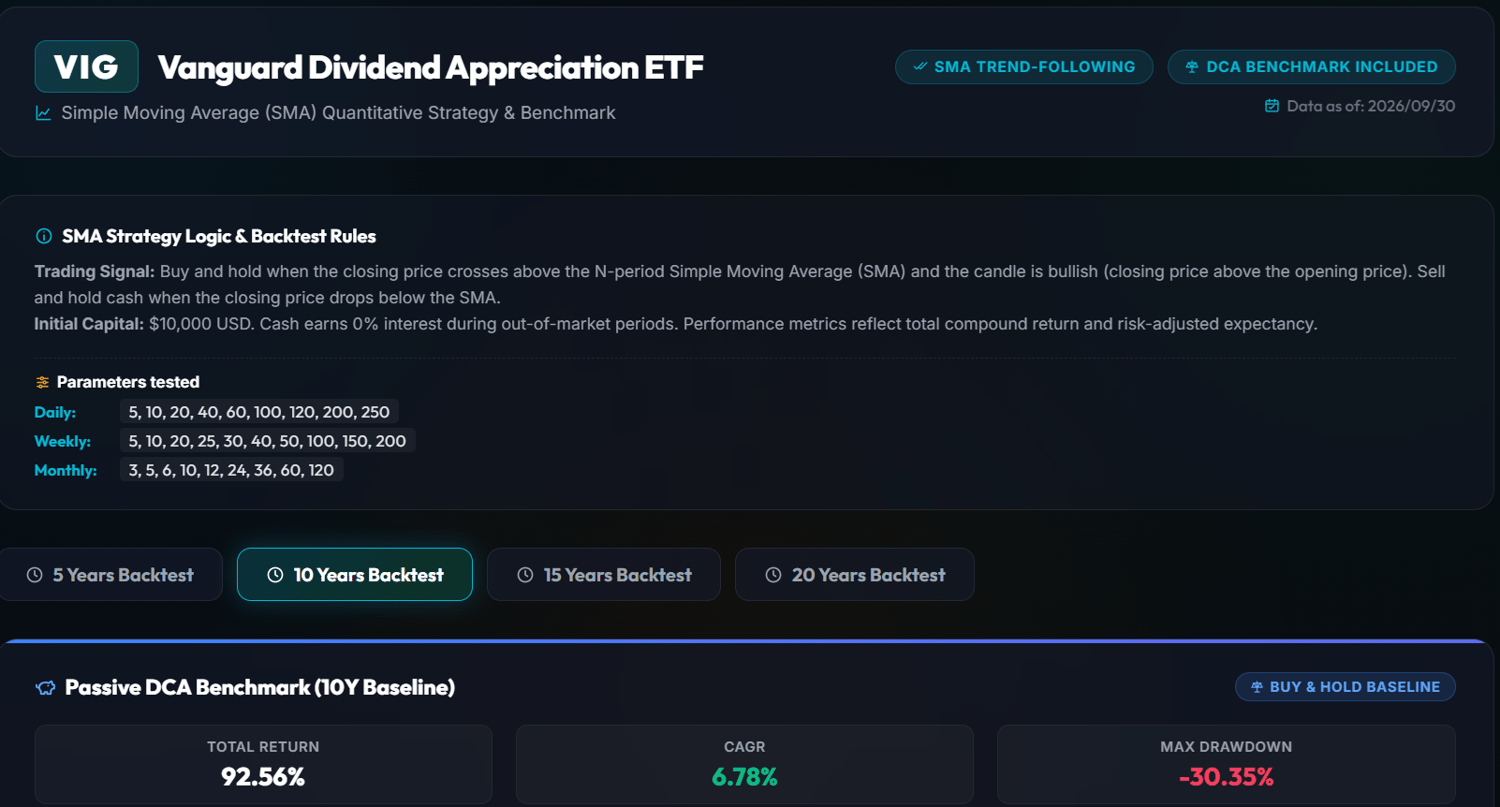
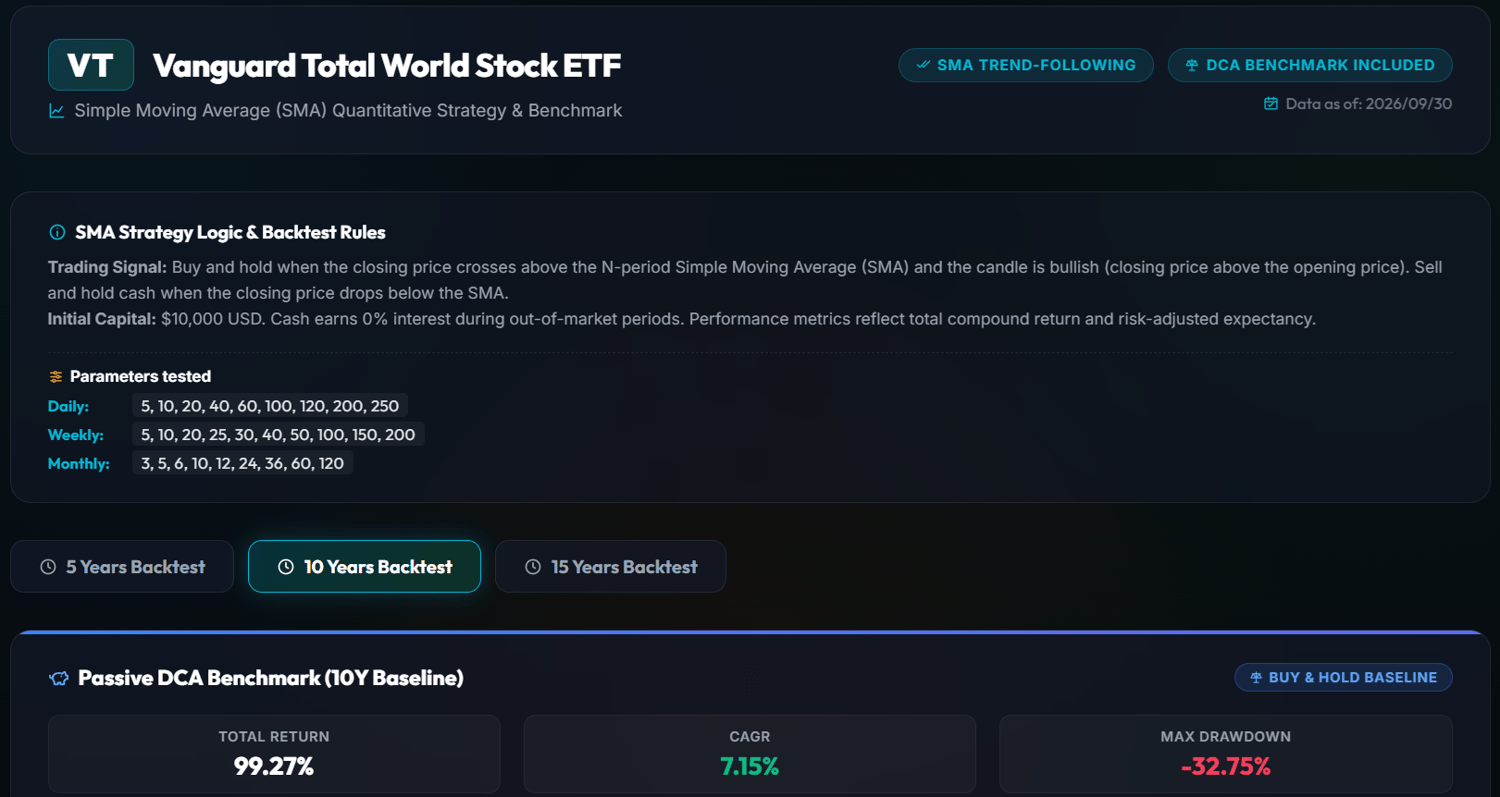

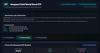
[3-in-1 Bundle] Global Core & Macro Equity Trend Trio (SPY / VIG / VT) - v2026.09
DCA if it's good enough. Use SMA if the evidence says it's better.
Stop guessing which moving averages actually work. This 3-in-1 interactive quantitative pack delivers extensive, multi-cycle historical execution data across Daily, Weekly, and Monthly timeframes—benchmarked directly against passive DCA to prove whether trend filters can boost CAGR or contain structural drawdowns across deep-liquidity, global macro benchmarks.
Zero black boxes. Standard parameters only, no optimization. Just pure historical evidence.
📊 What’s Inside This 3-in-1 Bundle?
3 Complete Standalone Dashboards Included:
- SPY (SPDR S&P 500 ETF Trust): The ultimate global benchmark and core US equity momentum engine.
- VIG (Vanguard Dividend Appreciation ETF): Large-cap quality leaders with sustained dividend-growth balance sheets.
- VT (Vanguard Total World Stock ETF): Broad macro coverage spanning US, developed, and emerging global markets.
28 Standard SMA Parameters Tested for Each Ticker:
- Daily SMA (9 Parameters): 5, 10, 20, 40, 60, 100, 120, 200, 250 (From swing momentum to institutional 200DMA).
- Weekly SMA (10 Parameters): 5, 10, 20, 25, 30, 40, 50, 100, 150, 200 (From medium-term trends to multi-year 200WMA).
- Monthly SMA (9 Parameters): 3, 5, 6, 10, 12, 24, 36, 60, 120 (From quarterly cycles to the 10-year 120MMA).
Direct DCA Baseline Scorecards: Fixed benchmark cards across standard historical cycle windows (including 5-Year, 10-Year, and full available long-term historical spans) to instantly verify whether active trend-following justified its friction.
Instant Visual Performance Highlighting:
- 🟢 CAGR > DCA Badge: Highlights parameters that generated higher compound annual returns than passive DCA.
- 🔵 Max Drawdown Protection Badge: Identifies parameters that successfully contained downside risk better than DCA.
Institutional Risk & Return Metrics:
- Final Portfolio Balance & Total Return (%)
- Compound Annual Growth Rate (CAGR %)
- Maximum Drawdown (MDD %)
- Win Rate (%), Profit-to-Loss Ratio & Mathematical Expectancy
- Total Trade Count & Total Days in Market Exposure
⚡ Built for Privacy & Offline Utility
- 100% Standalone Interactive HTML: Zero installation, zero external dependencies. Runs locally in any modern browser.
- Zero Tracking & Privacy-First: No accounts, no login portals, no tracking cookies, and no recurring subscriptions.
- Instant Native Sorting: Click any column header to sort parameters by CAGR, Drawdown, or Win Rate with zero latency.
⚙️ Technical Specifications
- Target Assets: SPY, VIG, and VT (US Large-Cap Core, Quality Growth & Global All-Cap Equities)
- Backtest Cut-off Date: Data updated through September 30, 2026
- Strategy: Long / Cash Simple Moving Average (SMA) Regime Filter
- Initial Capital Assumption: $10,000 USD (0% interest on unallocated cash)
- Historical Horizons: Multi-cycle rolling windows across all available historical data
- Delivery: 3 individual .html standalone interactive dashboard files delivered directly upon checkout
⚠️ Disclaimer
This interactive research pack is provided strictly for academic, historical backtesting, and analytical reference. It does not constitute financial, legal, or investment advice. Past performance is no guarantee of future market results.