
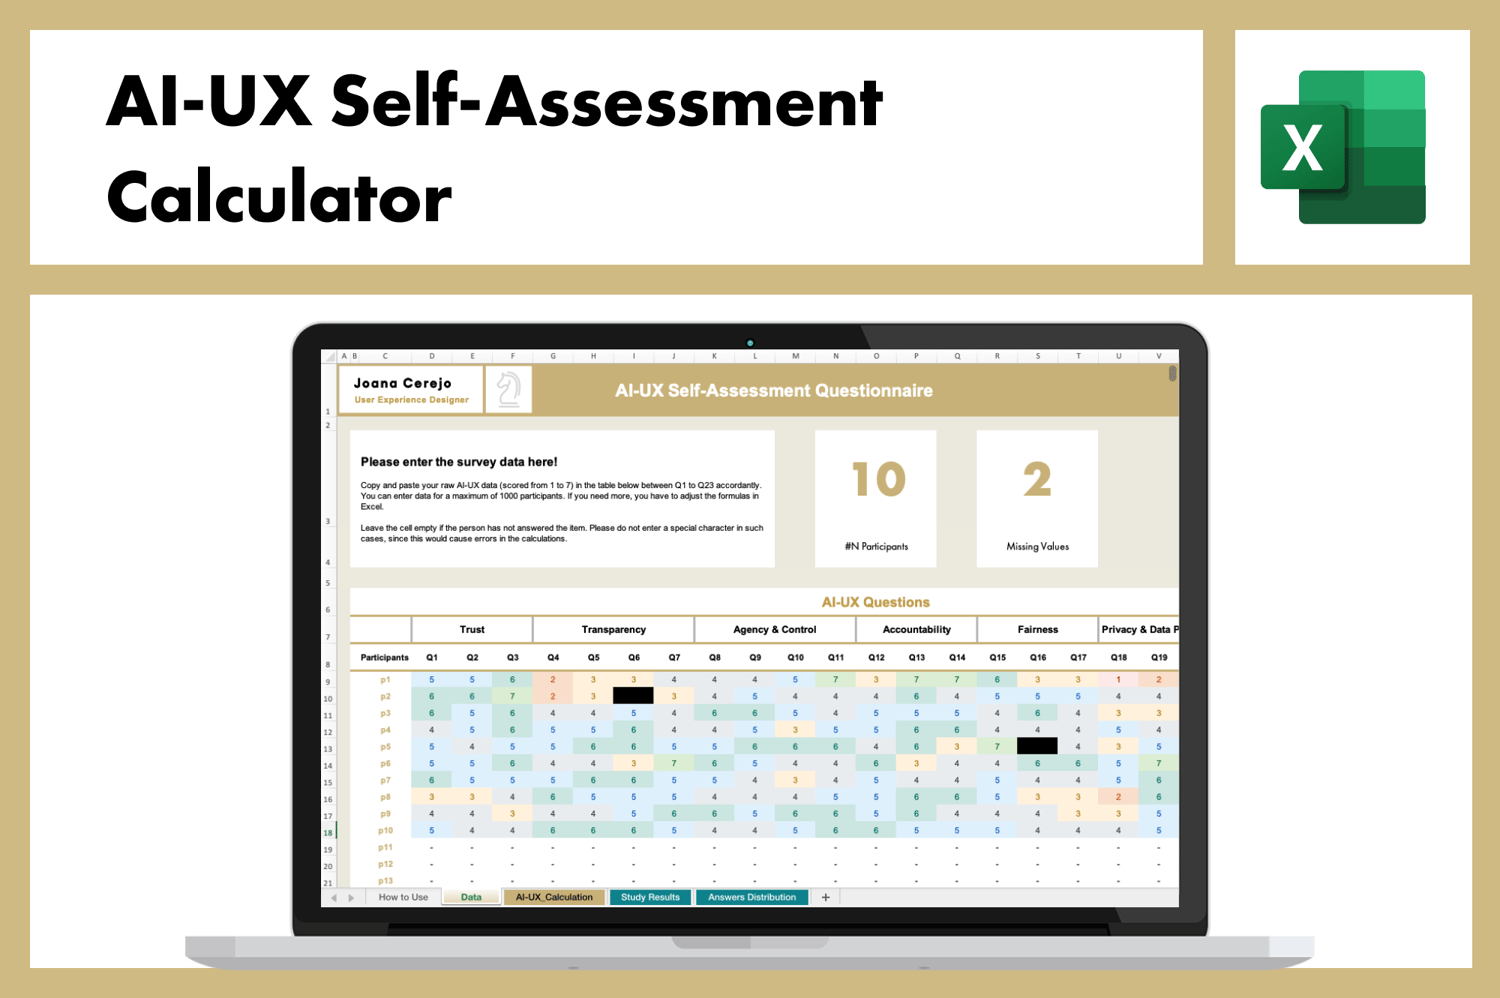


AI-UX Questionnaire Calculator
On Sale
€19.00
€19.00
This Excel file serves as a calculator for the AI-UX self-assessment questionnaire. Designed to eliminate the need for manual math and data processing, it allows you to focus on what matters most: the user needs. You just input the data collected from your respondents into the Data Worksheet. The tool then automatically performs all the necessary calculations to interpret the results. It also generates several graphs that can be useful for your presentations. You can easily copy these graphs into your word processor or presentation software.
What's inside this tool?
This Excel is composed of a few tabs:
- How to use: This is the first tab and its purpose is to give you guidance on how to use it and what are the purposes and goals of this tool.
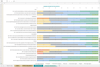
- Data: This tab is designed to support your calculation process by allowing you to enter the data from your study. Simply copy your participants' answers into the table. The calculator is equipped to handle missing data for up to three values per participant, so there's no need to clean or prepare your data beforehand. If you also included demographic questions in your study, the calculator can process this data as well. Just copy the demographic information into the table and edit the header as needed. Note that the calculator is capable of processing data for up to 1000 participants. If your sample size exceeds this limit, the formulas may not be able to handle the data accurately.
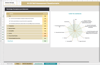
- AI-UX Calculation: This tab is where all the calculations for your AI-UX study are done automatically. You don't need to do anything here except view the results. You can also see the AI-UX score for each individual participant and how their answers deviate from the mean. Additionally, you can inspect the data for any outliers. If you find any, simply go back to the Data spreadsheet and delete those participants.
- Study Results: Welcome to the magic dashboard! This amazing tool has been prepared for you to see your AI-UX score, its corresponding grade, and what it means for your AI product or system. The dashboard also displays the distribution of your scores, allowing you to evaluate each dimension's performance and make informed decisions based on the results.
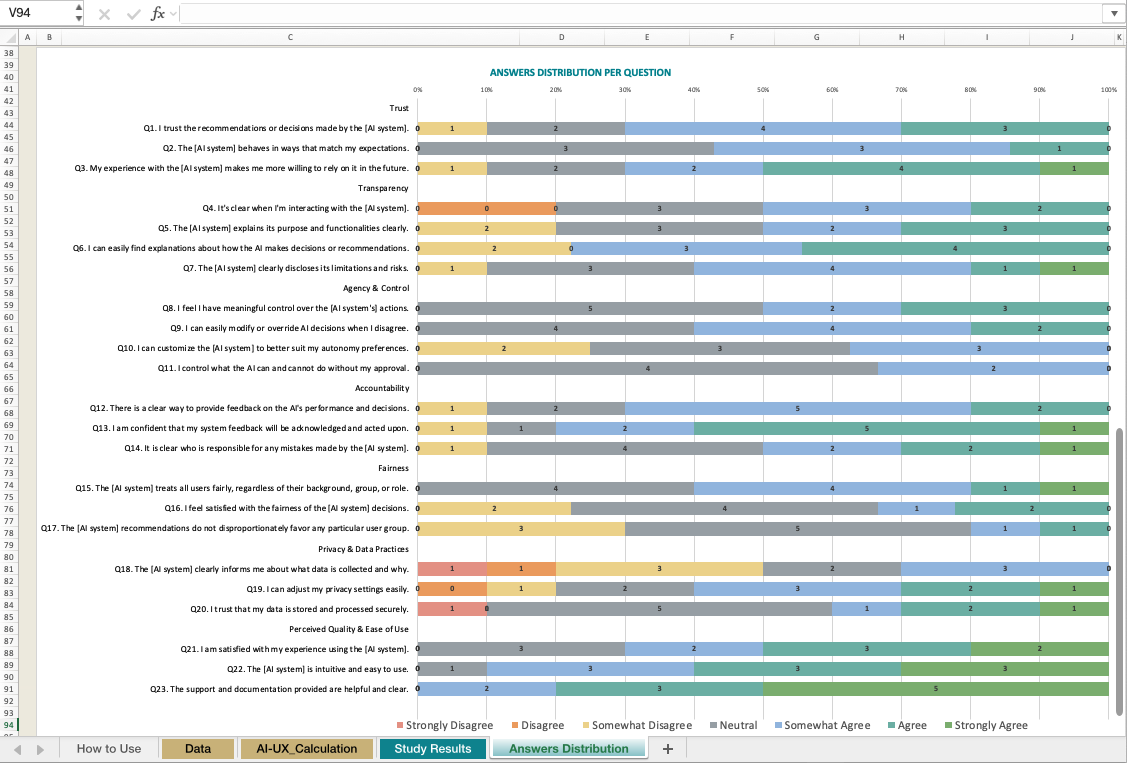
- Answers Distribution: In this tab of the spreadsheet, you can consult the distribution of results by question.