








Volume Profile Explained — Find real levels (PDF Guide)
You add Volume Profile and immediately hit two problems. There are six of them in the list and nobody says which to pick. And every explanation tells you price stalls at the fat bars and races through the thin ones, without ever showing you that it does.
Both are answered here. A decision tree for the six, and the stalling claim measured across 144 windows of real data: price spent 28 times as long in the fattest rows as the thinnest. This is a 38-page PDF that teaches Volume Profile from the first thing you see on the screen through to a written strategy with an entry, a stop and an explicit rule for when the trade is wrong.
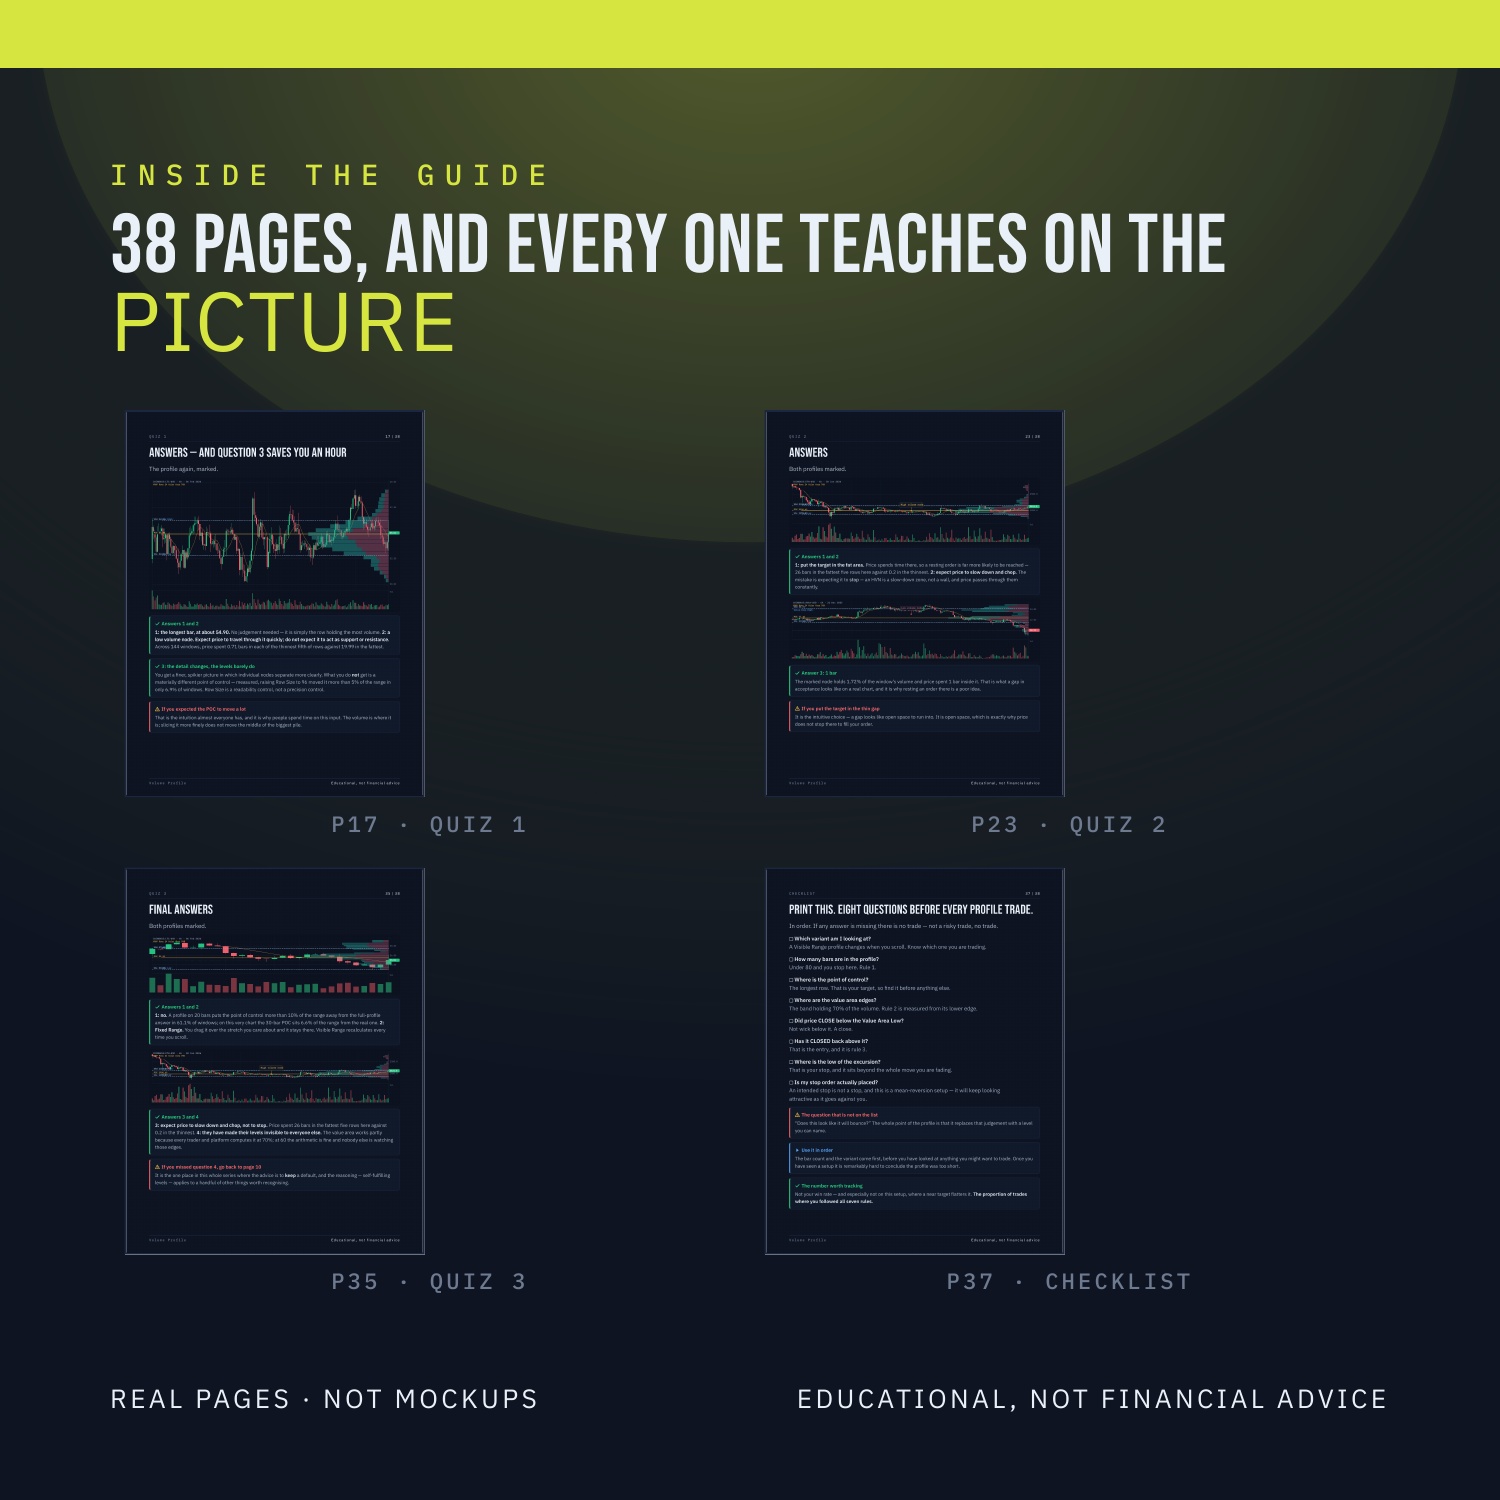
Nothing is taught underneath a chart. Every label sits on the bar, the line or the level it is describing, on real market data. There are three quizzes on real charts, each followed by the same chart re-shown annotated with the reasoning, plus faded practice pages where the first steps are filled in and you finish the rest.
WHAT'S INSIDE
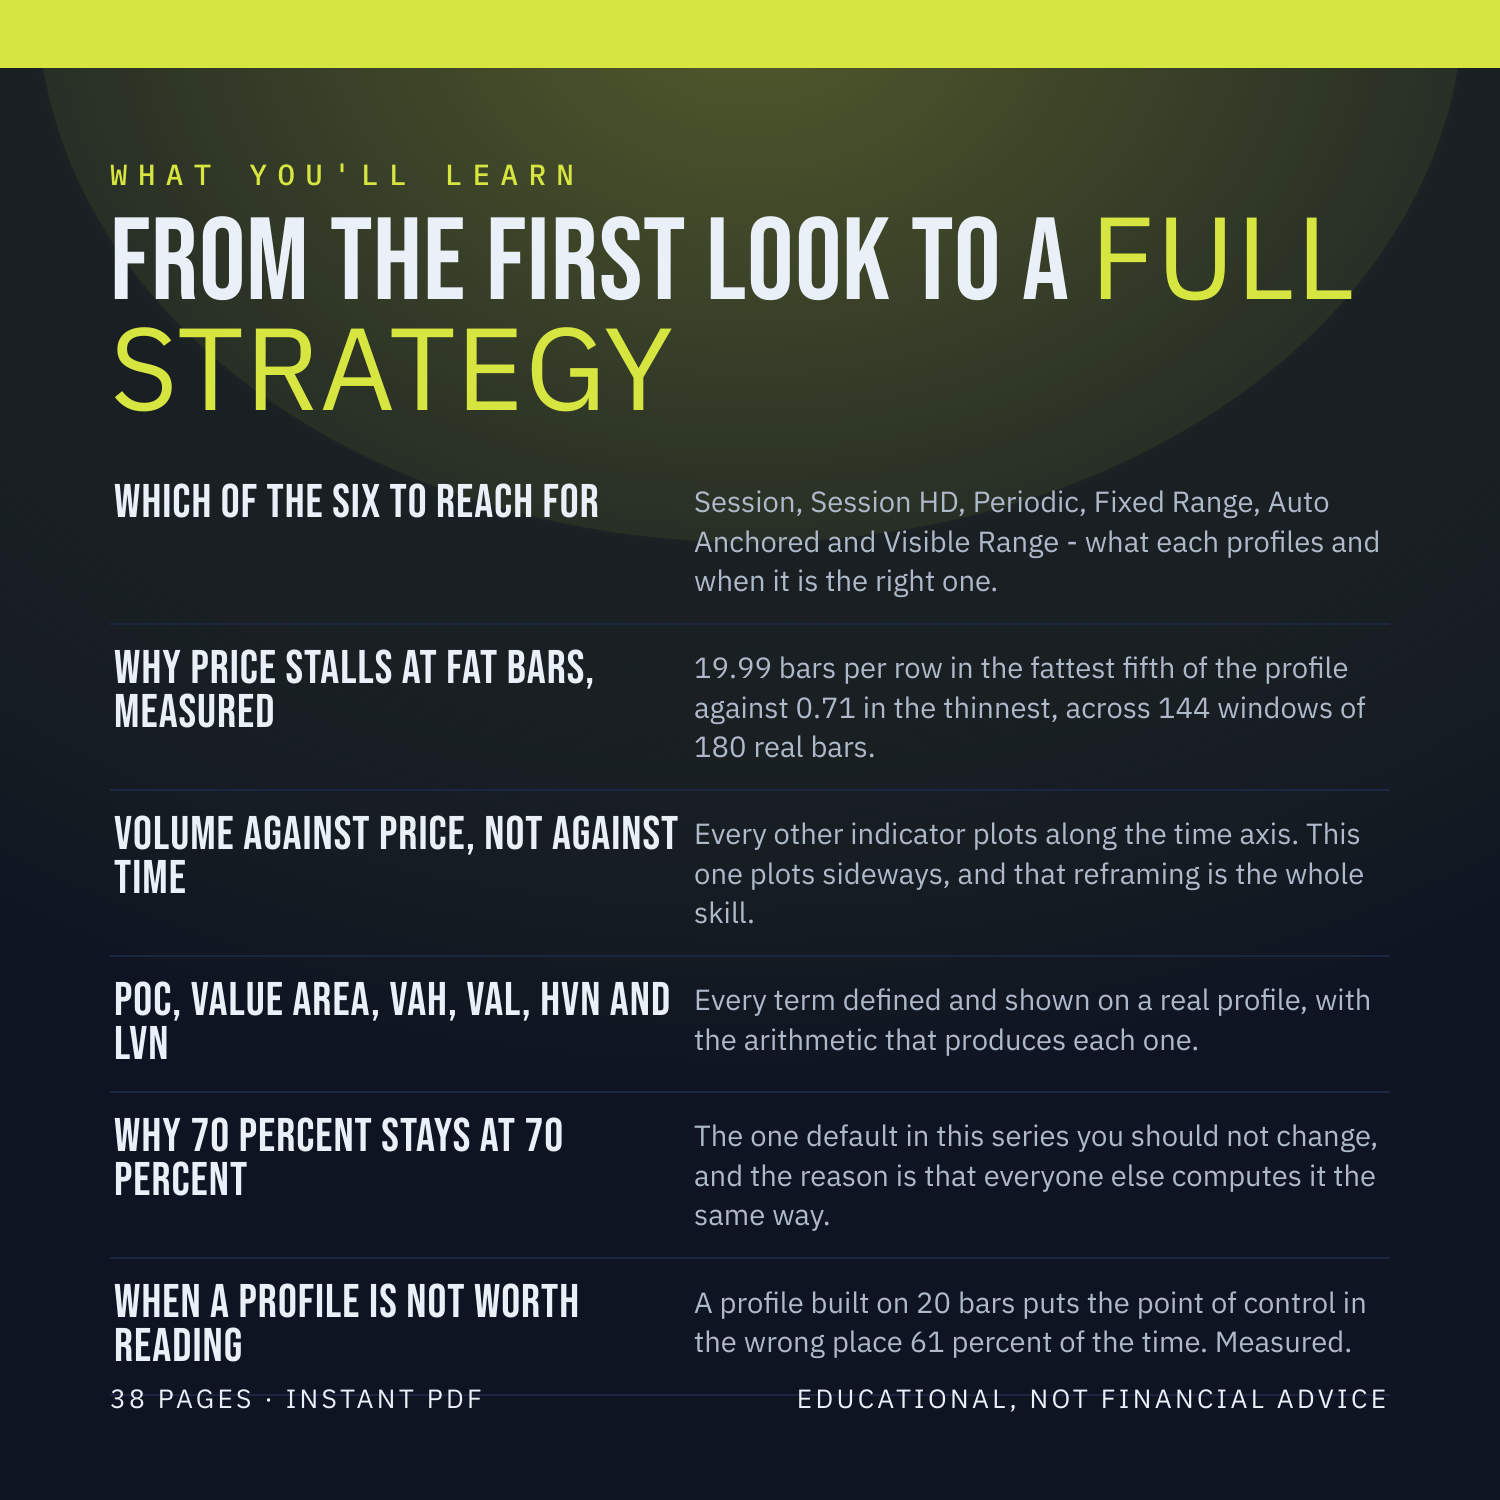
- Which of the six to reach for — Session, Session HD, Periodic, Fixed Range, Auto Anchored and Visible Range - what each profiles and when it is the right one.
- Why price stalls at fat bars, measured — 19.99 bars per row in the fattest fifth of the profile against 0.71 in the thinnest, across 144 windows of 180 real bars.
- Volume against price, not against time — Every other indicator plots along the time axis. This one plots sideways, and that reframing is the whole skill.
- POC, Value Area, VAH, VAL, HVN and LVN — Every term defined and shown on a real profile, with the arithmetic that produces each one.
- Why 70 percent stays at 70 percent — The one default in this series you should not change, and the reason is that everyone else computes it the same way.
- When a profile is not worth reading — A profile built on 20 bars puts the point of control in the wrong place 61 percent of the time. Measured.
WHAT YOU'LL BE ABLE TO DO
- Pick the right one of the six for what you are doing.
- Read a profile sideways instead of trying to read it along time.
- Name the point of control, the value area and its edges on any chart.
- Tell a high volume node from a low one and know what each implies.
- Set Row Size deliberately and know how little it moves the POC.
- Say when a profile has too little data behind it to be worth using.
AN HONEST NOTE
Volume Profile is a clue, not a crystal ball. It describes what price has already done. This guide contains no win-rates, no backtest results and no promises about what you will make, because nobody can verify those and you should not trust anyone who prints them. What it hands you instead is a set of rules you can test yourself on TradingView in an afternoon. Educational, not financial advice.
Instant download. 38 pages, PDF.