

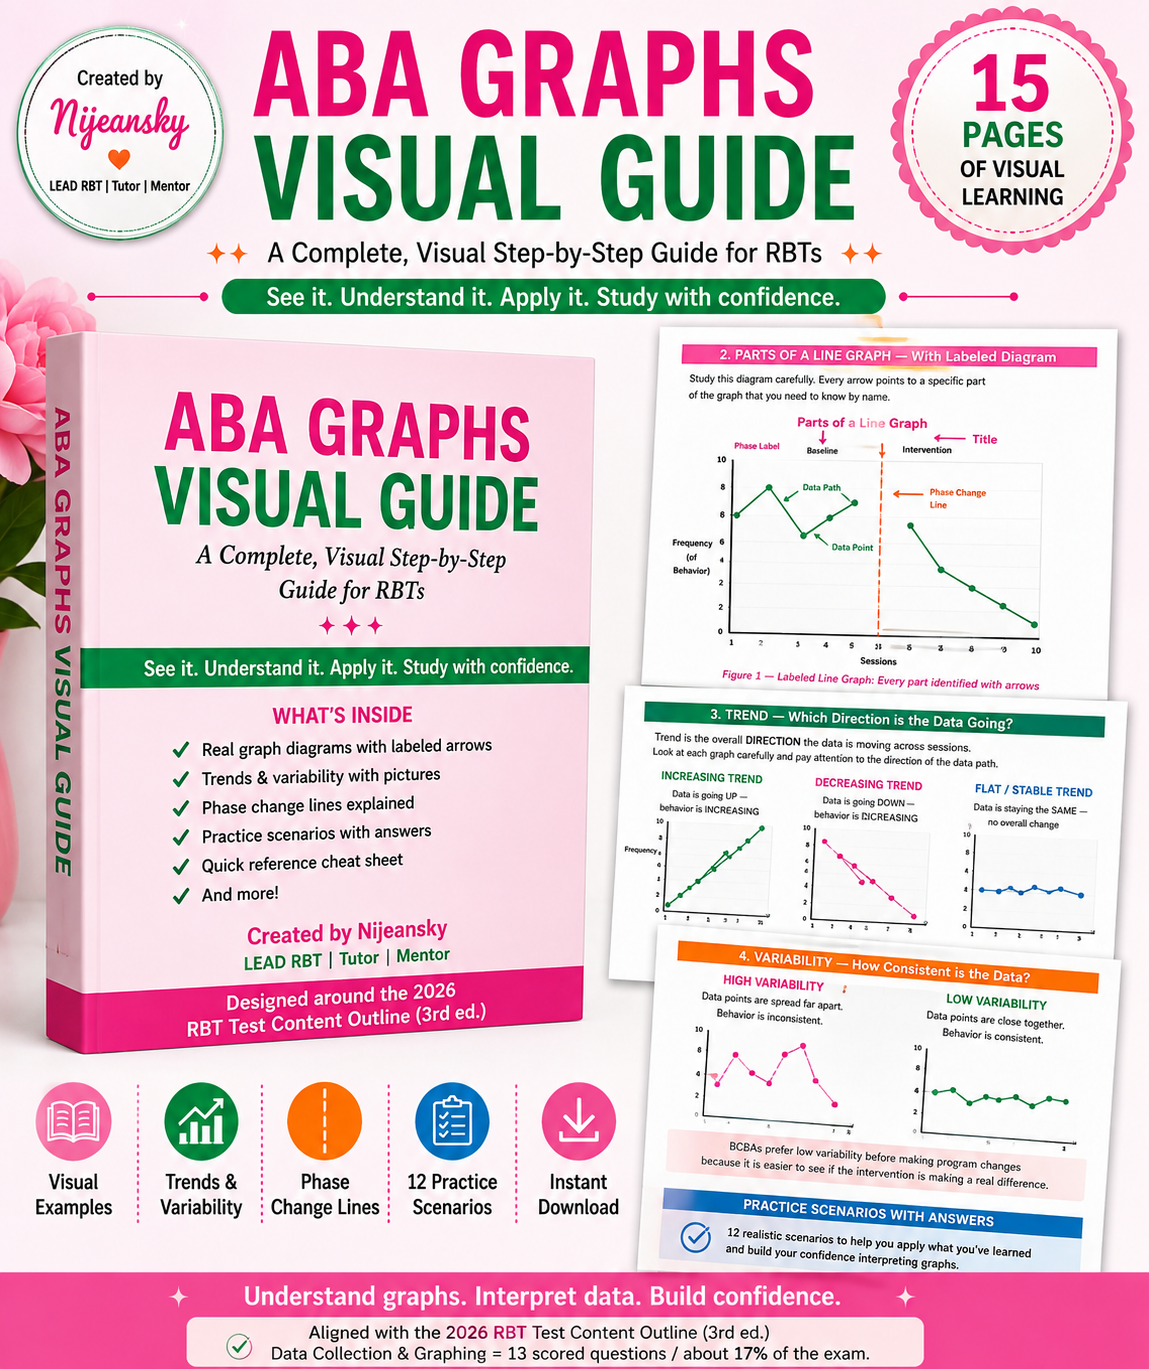
ABA Graphs Visual Guide
🎀 ABA Graphs Visual Guide — Step-by-Step Graphing Support for RBTs
Created by Nijeansky | LEAD RBT | Tutor | Mentor
Do ABA graphs feel confusing or overwhelming?
This visual guide was created to help RBT students and new RBTs understand graphing and data concepts in a simple, visual, step-by-step way.
Instead of only reading definitions, you’ll actually see what each graph concept looks like, learn how to identify important patterns, and practice applying what you’ve learned to realistic RBT situations.
This guide is designed around Data Collection & Graphing concepts from the current 2026 RBT Test Content Outline (3rd ed.).
📊 WHAT’S INCLUDED
✅ 15-page visual study guide
✅ Parts of a line graph with a fully labeled diagram
✅ X-axis, Y-axis, data points, data paths, phase labels, and phase change lines
✅ Increasing, decreasing, and flat/stable trends
✅ High vs. low variability with visual examples
✅ Phase change lines explained step by step
✅ Line graphs, bar graphs, cumulative records, and scatterplots
✅ Data-entry and graph-updating guidance
✅ Rate and percentage practice
✅ Momentary time sampling and measurement examples
✅ 12 practice scenarios with answers
✅ Data accuracy and reliability concepts
✅ Quick-reference graphing cheat sheet
✅ Realistic examples to help you become more confident interpreting ABA data
📌 WHY DATA COLLECTION & GRAPHING MATTERS
Data Collection & Graphing is one of the six areas included in the current RBT exam content.
Under the 2026 RBT Test Content Outline, this domain represents approximately 17% of the scored exam content.
RBT candidates may need to understand concepts involving:
- Frequency
- Duration
- Latency
- Rate
- Percentage
- Interval-based measurement
- Momentary time sampling
- Data entry
- Graph updating
- Trends
- Variability
- Phase changes
- Graph interpretation
- Reliable and accurate data collection
This guide gives you a focused way to review and practice those concepts visually.
💡 WHY THIS GUIDE IS DIFFERENT
Graphs are much easier to understand when you can actually see what the concepts look like.
This guide uses visual examples, labeled diagrams, simple explanations, and practice scenarios to help you understand:
What each graph element means
How to identify trends
How to recognize high and low variability
What phase change lines represent
Why data paths should not be connected across phases
When different types of graphs may be used
How to calculate basic rate and percentage values
How to interpret data without going outside the RBT role
Why accurate and reliable data collection matters
The goal is to help you move beyond memorizing terminology and start truly understanding what the data are showing you.
👩🏽💻 WHO IS THIS FOR?
This resource is ideal for:
✔️ RBT candidates preparing for the certification exam
✔️ Individuals completing the 40-hour RBT training
✔️ New RBTs who want more confidence reading ABA graphs
✔️ Current RBTs who want a quick graphing refresher
✔️ Anyone who struggles with trends, variability, graph types, measurement, or phase change lines
✔️ Visual learners who prefer diagrams and examples over long explanations
📥 WHAT YOU’LL RECEIVE
Your purchase includes:
📘 1 downloadable 15-page ABA Graphs Visual Guide
📊 Multiple labeled graph examples
📝 12 practice scenarios with answers
📌 Quick-reference graphing cheat sheet
🧠 Visual explanations of important Data Collection & Graphing concepts
📲 Instant digital access after purchase
Use this guide to review difficult graphing concepts, practice interpreting data, identify areas you still need to study, and build your confidence at your own pace.
Instant download • Visual learning • Study anytime • No expiration
With love,
Nijeansky
LEAD RBT | Tutor | Mentor
"Discipline today is your success tomorrow."
This is an independent educational study resource. It is not affiliated with, endorsed by, sponsored by, or produced by the BACB. This guide contains original educational content and is intended for supplemental study purposes. It does not contain actual BACB examination questions and does not guarantee a passing examination result.