

Flags & Pennants Explained — Measured (PDF Guide)
A sharp move and then a pause. Everyone knows the shape, everyone splits it into flags and pennants by how the pause looks, and nobody has ever written down how sharp the move has to be or how long the pause may last. Without those two numbers you cannot count them, and without a count you cannot know whether the thing works.
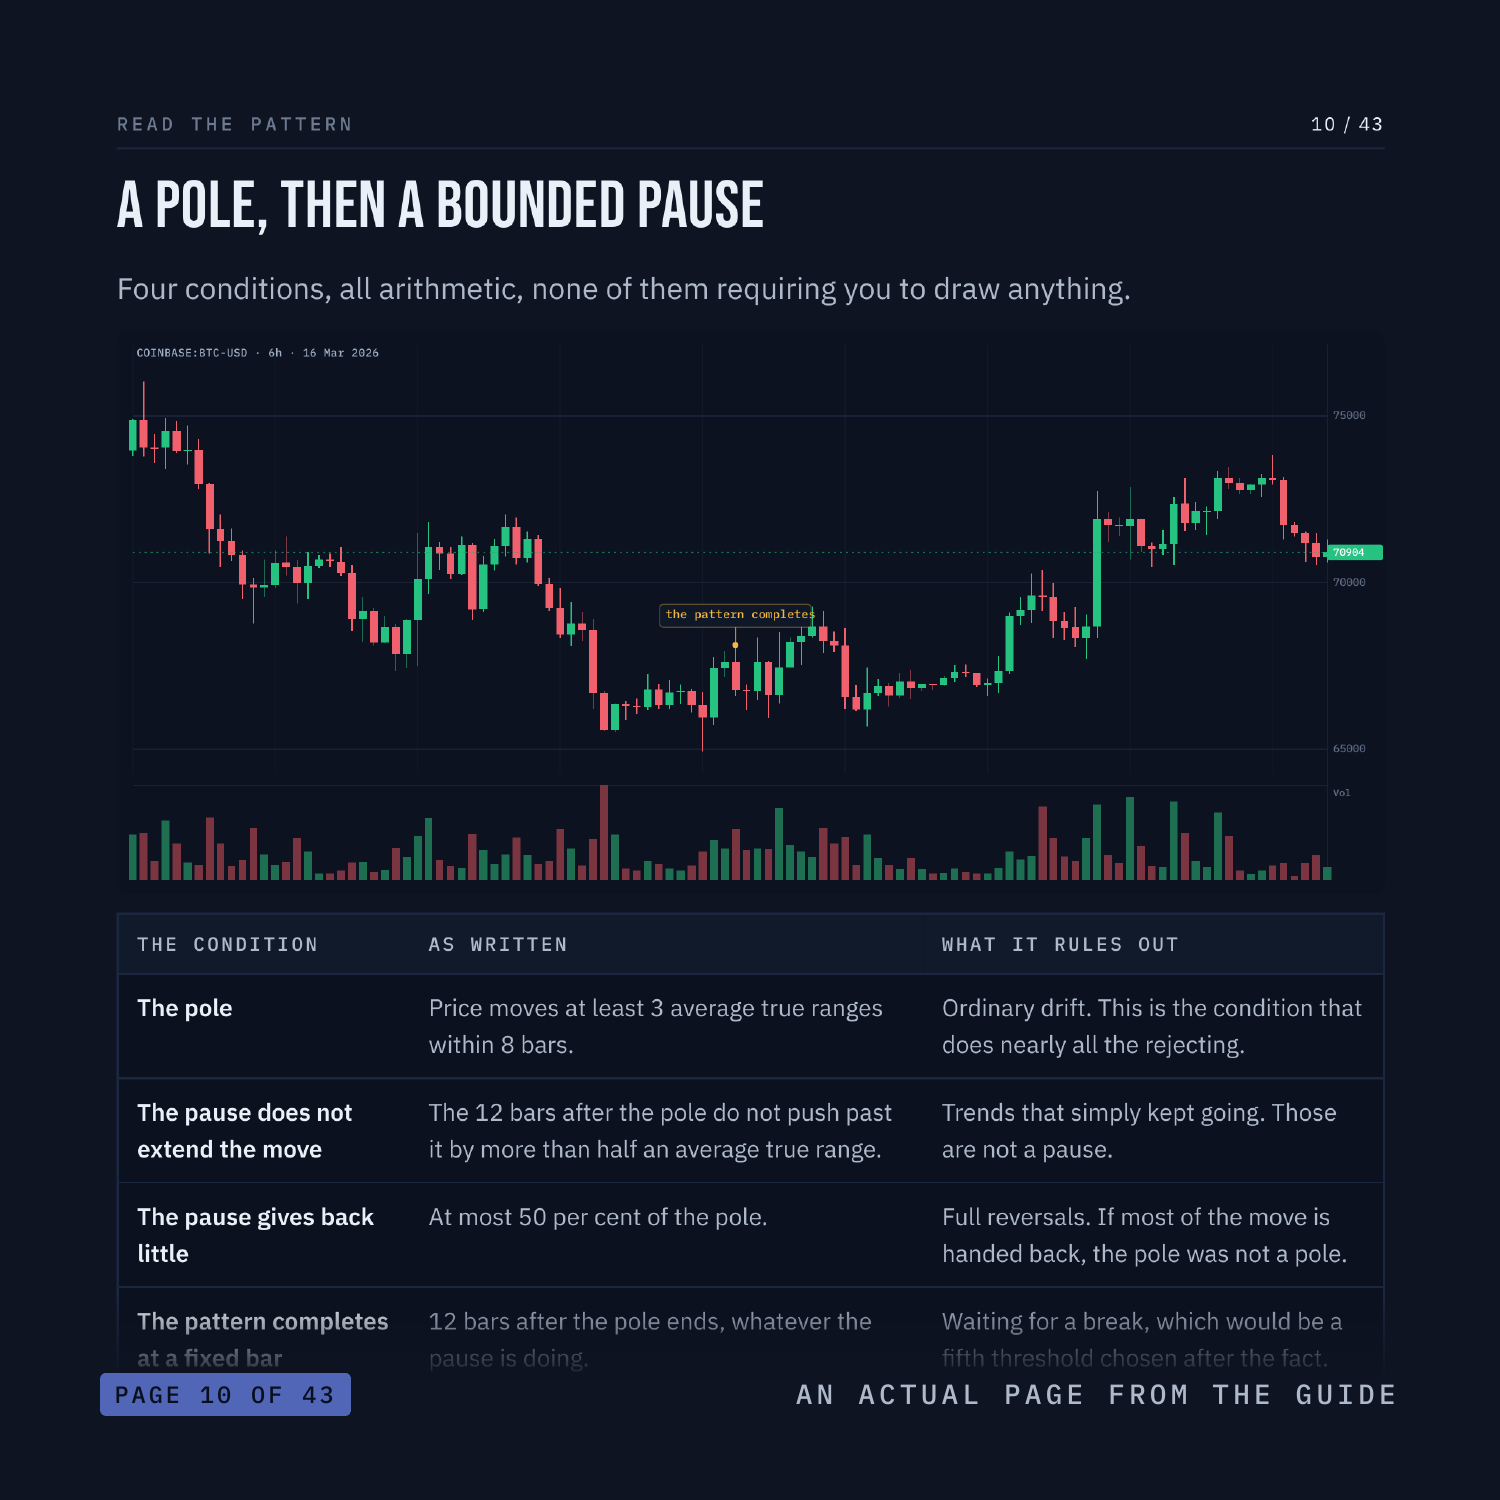
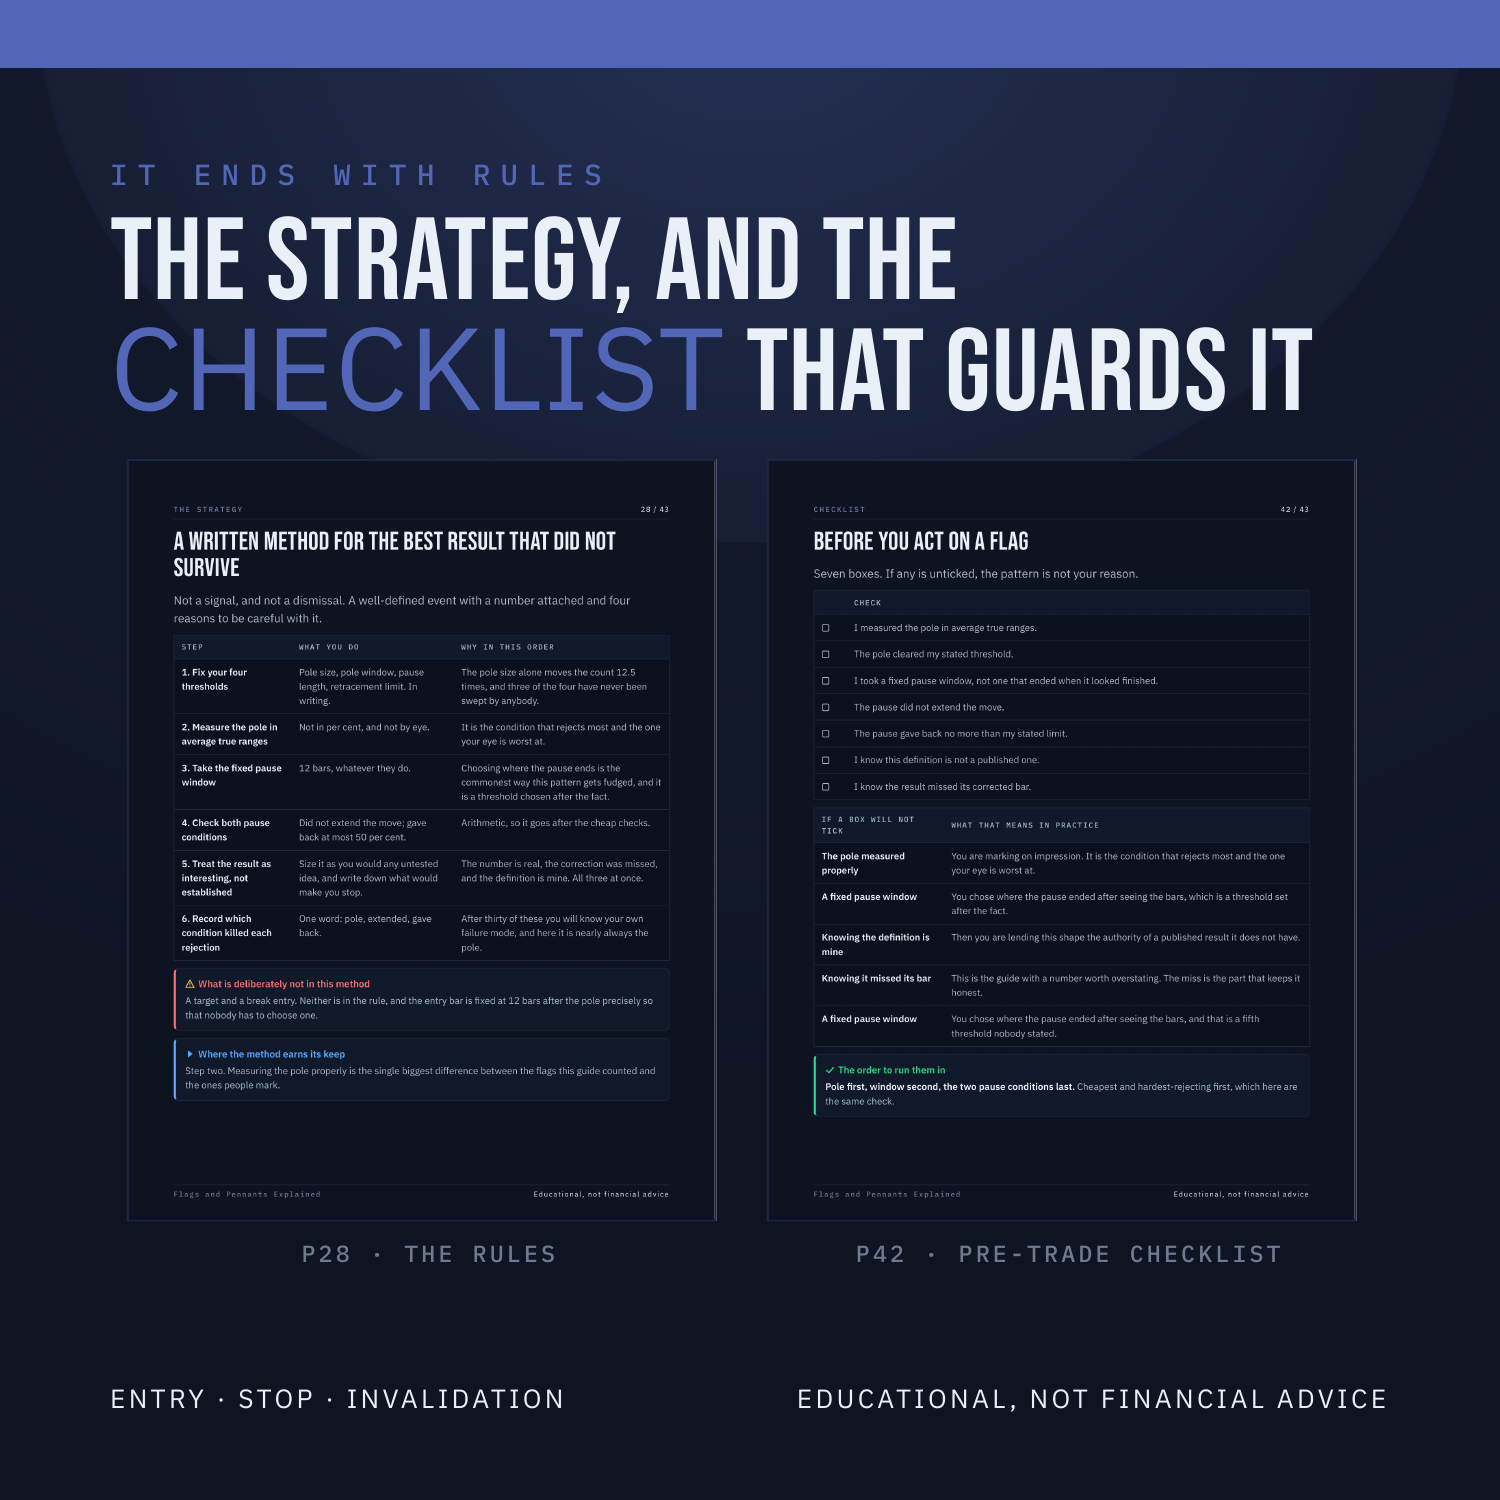
There is no published algorithmic definition of a flag, so this series wrote one and prints it: a pole of at least 3 average true ranges inside 8 bars, then 12 bars that give back no more than 50 per cent of it and do not extend it. Across 35,944 bars that gives 214 bear flags and 109 bull flags. Then it races them against a control and prints what came back, including the part where it is the largest edge in two waves and still does not survive. This is a 43-page PDF that teaches Flags & Pennants from the first thing you see on the screen through to a written strategy with an entry, a stop and an explicit rule for when the trade is wrong.
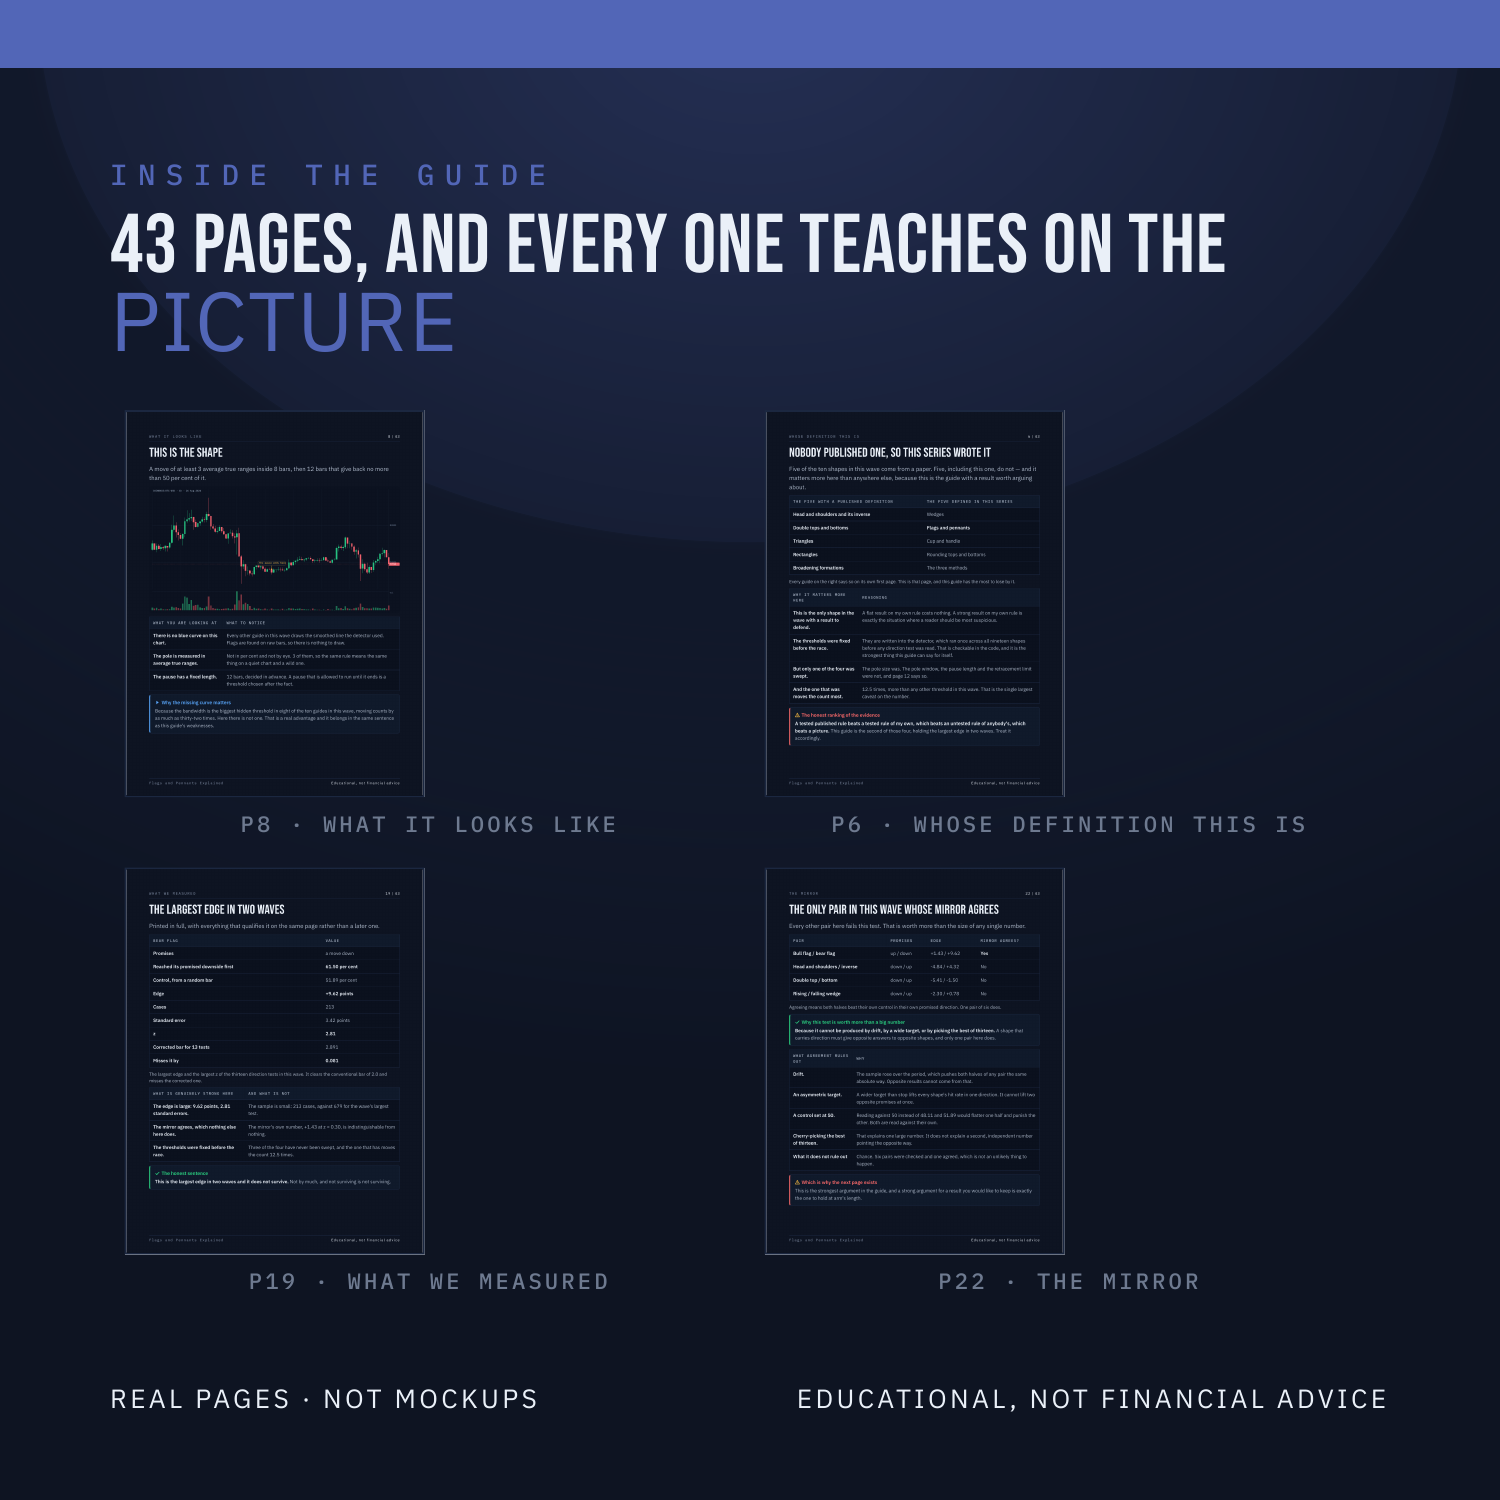
Nothing is taught underneath a chart. Every label sits on the candle, the line or the level it is describing, on real BTC, ETH, SOL and LINK charts. There are three quizzes on real charts, each followed by the same chart re-shown annotated with the reasoning, plus faded practice pages where the first steps are filled in and you finish the rest.
WHAT'S INSIDE
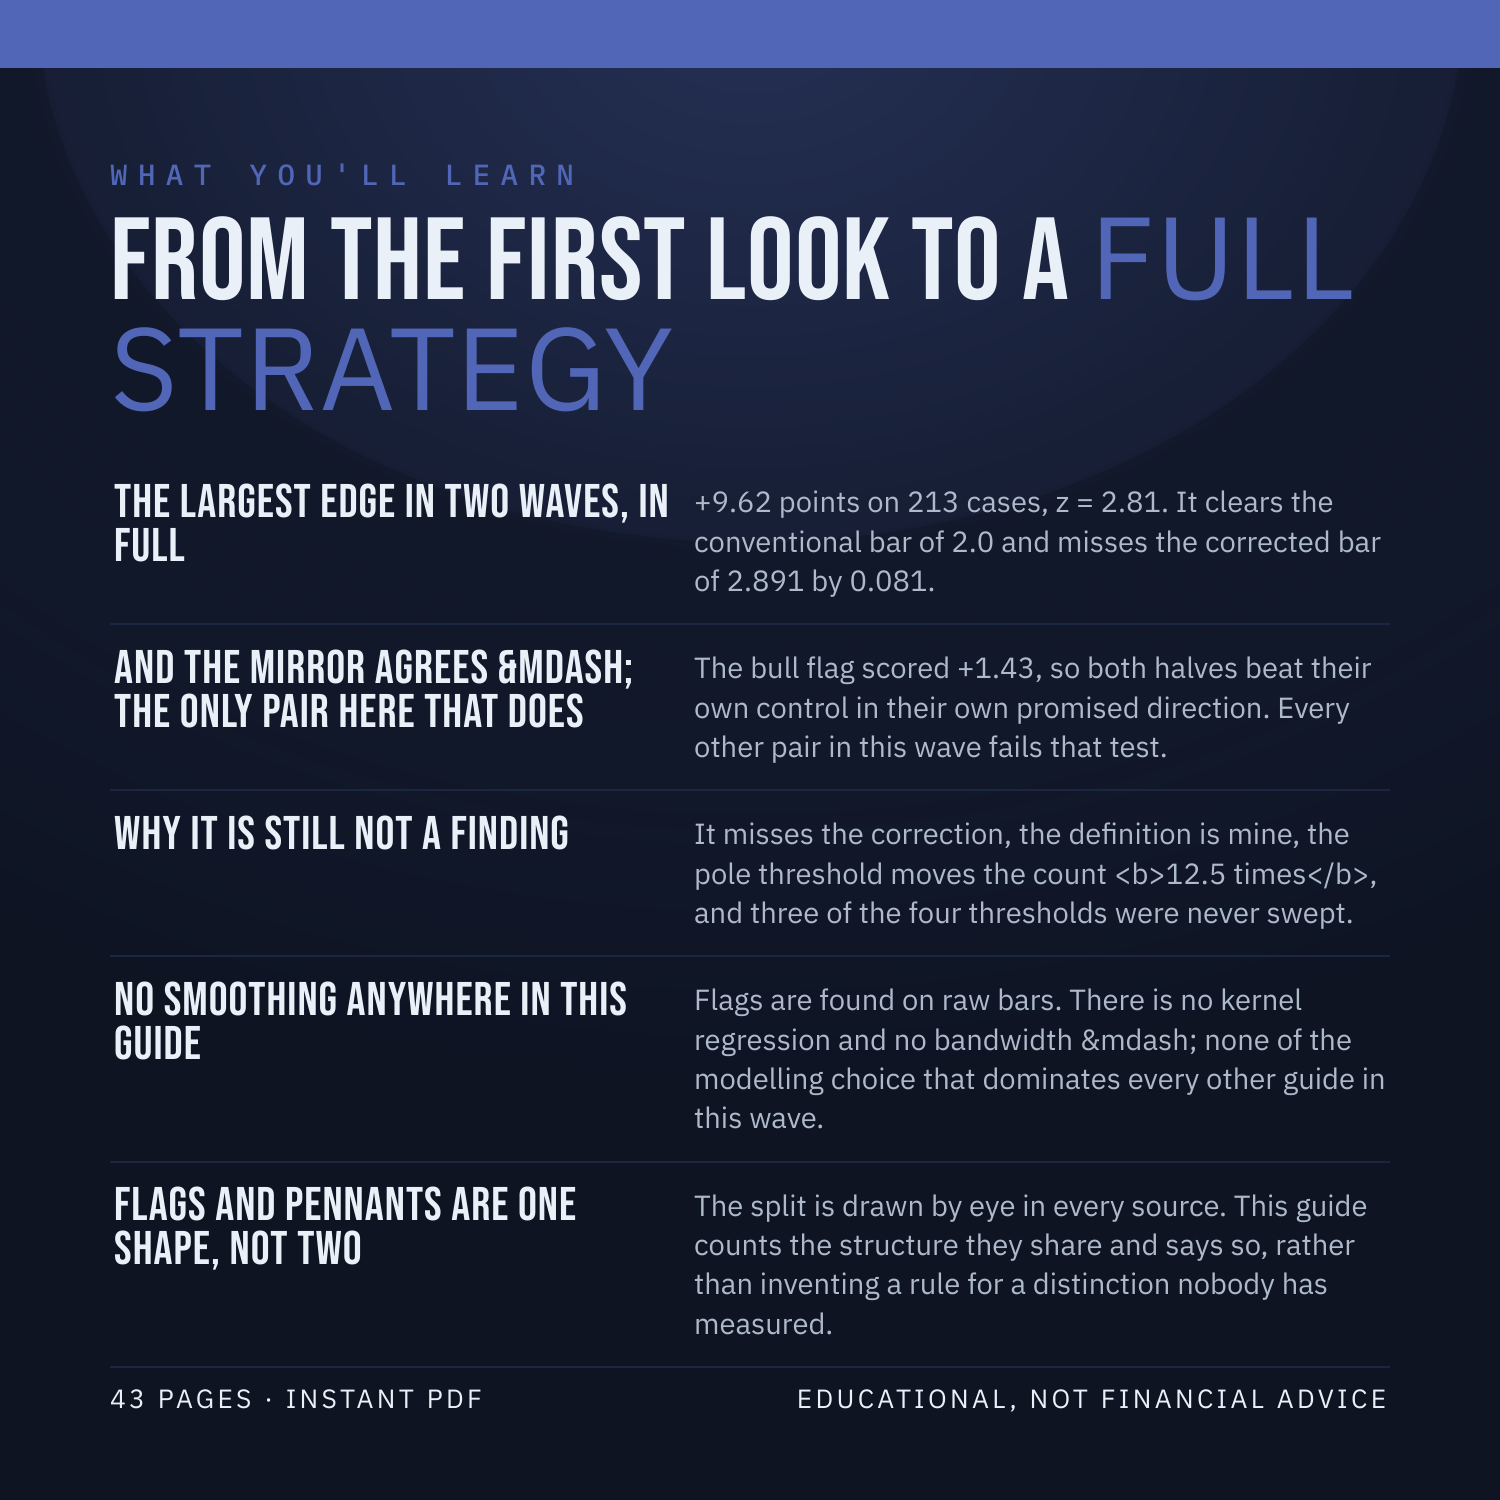
The largest edge in two waves, in full - +9.62 points on 213 cases, z = 2.81. It clears the conventional bar of 2.0 and misses the corrected bar of 2.891 by 0.081.
And the mirror agrees, the only pair here that does - the bull flag scored +1.43, so both halves beat their own control in their own promised direction. Every other pair in this wave fails that test.
Why it is still not a finding - it misses the correction, the definition is mine, the pole threshold moves the count 12.5 times, and three of the four thresholds were never swept.
No smoothing anywhere in this guide - flags are found on raw bars. There is no kernel regression and no bandwidth, none of the modelling choice that dominates every other guide in this wave.
Flags and pennants are one shape, not two - the split is drawn by eye in every source. This guide counts the structure they share and says so, rather than inventing a rule for a distinction nobody has measured.
WHAT YOU'LL BE ABLE TO DO
Mark a flag by rule: a pole in average true ranges, then a bounded pause.
Read the largest edge in two waves without over-reading it.
Say exactly what would turn it into a finding.
Explain why a mirror that agrees is worth more than a big number.
Recognise which of a rule's thresholds were tested and which were not.
AN HONEST NOTE
A flag is a clue, not a crystal ball. It describes what price has already done. This guide contains no win-rates, no backtest results and no promises about what you will make, because nobody can verify those and you should not trust anyone who prints them. What it hands you instead is a set of rules you can test yourself on TradingView in an afternoon. Educational, not financial advice.
Instant download. 43 pages, PDF.