
Supply Chain Autopsy DMAIC Project Kit: Blank Template
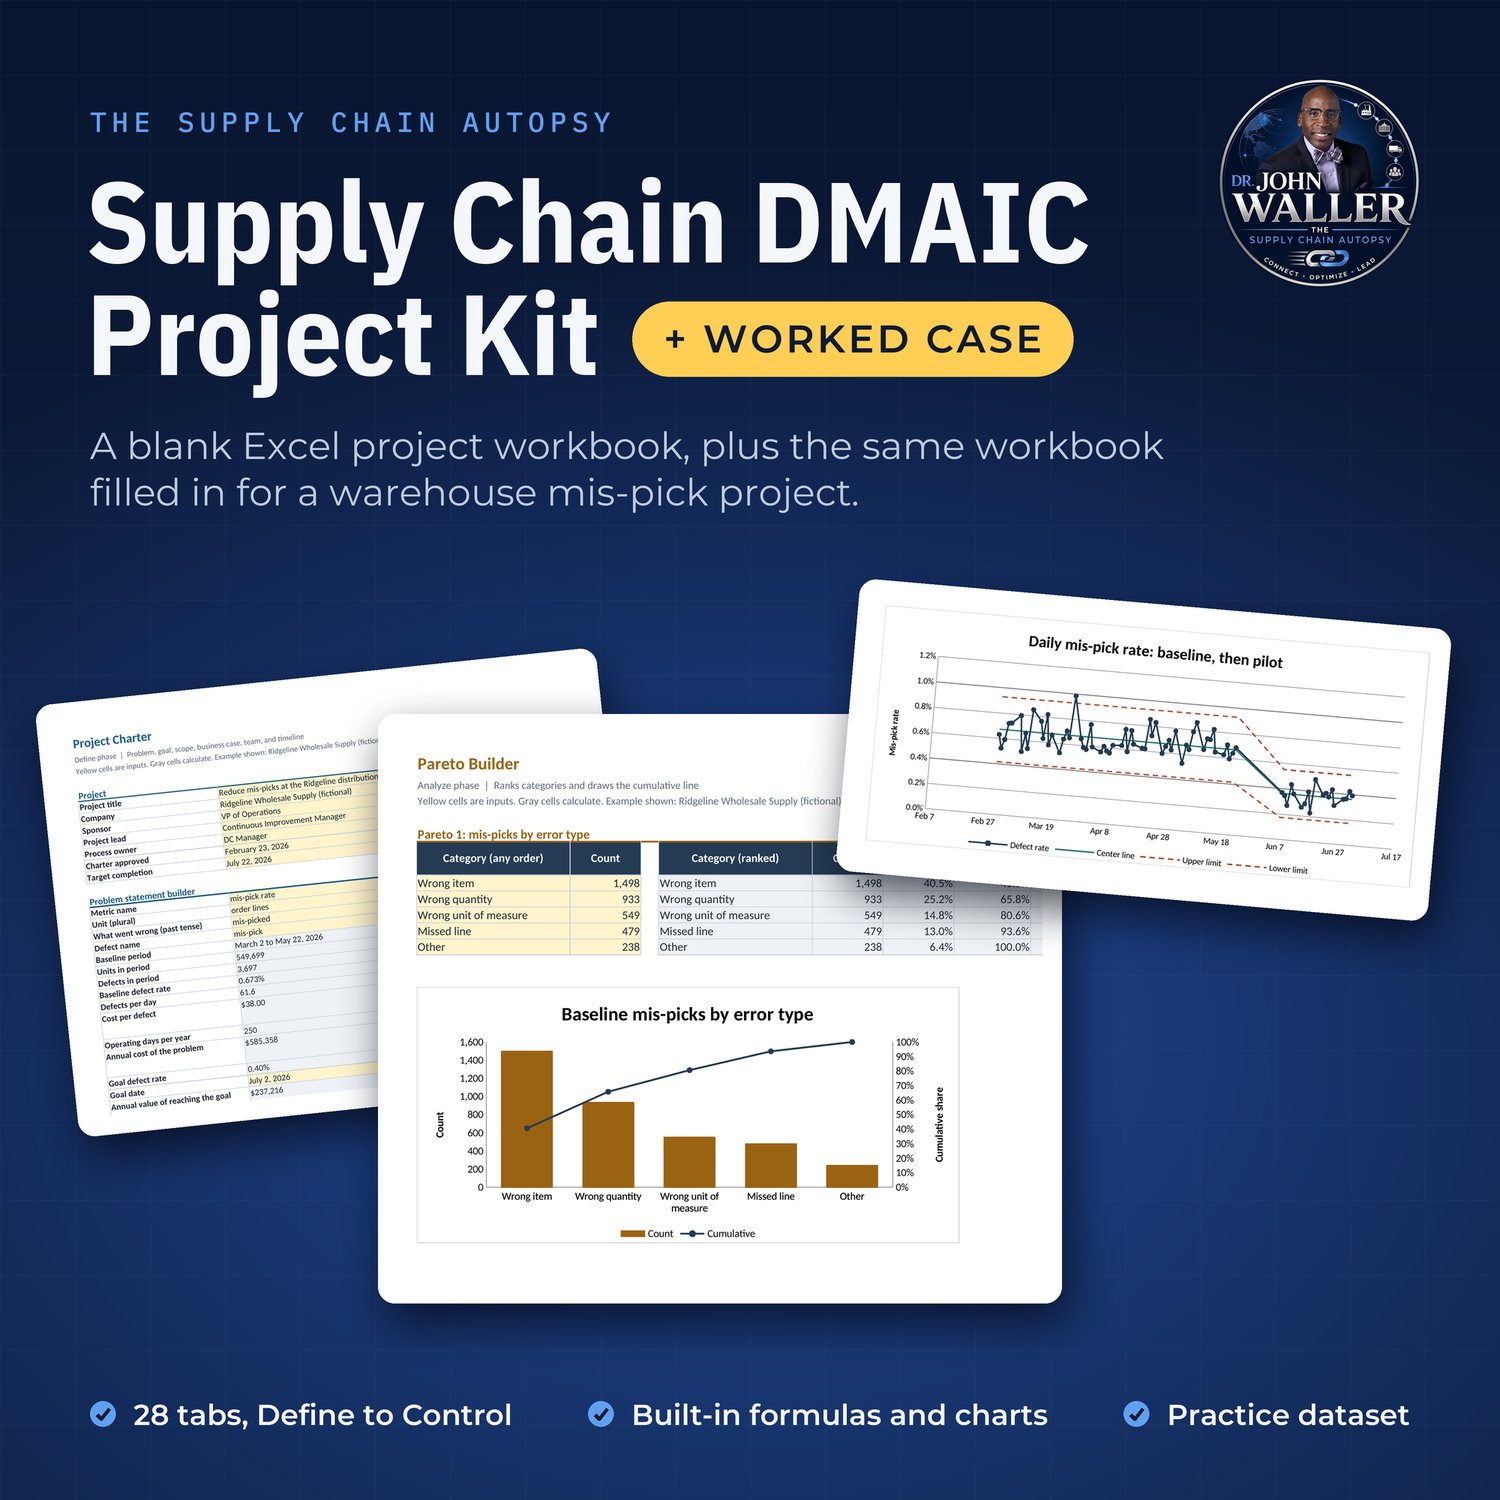
Run a full DMAIC project in one Excel workbook, and see every tab already completed for a warehouse problem.
Most DMAIC templates are written for manufacturing lines. This one is written for warehouses, transportation, and inventory. You get a blank workbook for your own project and a second copy of the same workbook completed from charter to control plan, so you can see what a finished tab looks like before you fill in yours.
What you get
Blank project workbook (Excel, .xlsx). 28 tabs that take a project from Define to Control, plus a Terms of Use tab.
Worked case workbook (Excel, .xlsx). The same 28 tabs completed for a mis-pick reduction project at Ridgeline Wholesale Supply, a fictional distribution center.
Practice dataset (CSV). The 632 rows of daily picking data behind the case, so you can rebuild the analysis yourself. The same data is on a Data tab inside the case workbook.
Inside the workbook
Start: Navigator with a status for every tab, and a Metric Library of 25 supply chain metrics such as pick accuracy, on-time in-full, dock-to-stock time, line fill rate, and inventory record accuracy.
Define: Project Charter, SIPOC, Voice of Customer to CTQ, Stakeholder and Communication Plan.
Measure: Operational Definition, Data Collection Plan, Baseline Calculator (defect rate, DPMO, yield, and sigma level), Process Map, Measurement Check, Run Chart.
Analyze: Pareto Builder, Stratification, Fishbone, 5 Whys, Hypothesis Test Helper (two-proportion, chi-square, and two-sample t tests), Root Cause Verification.
Improve: Solution Selection Matrix, FMEA, Pilot Plan and Results, Savings Calculator, Implementation Action Plan.
Control: Control Plan, Control Chart (p-chart), Response Plan, Standard Work, Project Storyboard.
How it works
Yellow cells are your inputs. Gray cells calculate.
Five charts draw themselves as you enter data: a run chart, two Pareto charts, a p-chart, and an optional subgroup chart.
Standard Excel formulas only. No macros and no add-ins.
Every tab is set up to print.
The worked case
Ridgeline's distribution center mis-picks 0.67% of its order lines: 3,697 of 549,699 over 60 working days. The case follows the project from the charter through the data, the root causes, a 19-day pilot of four fixes, and the control plan that holds the gain.
Pilot mis-pick rate of 0.363%, which is 46.1% below baseline
Projected savings of about $270,000 a year
One-time cost of $11,800
Ridgeline Wholesale Supply is a fictional company and its data is synthetic, built for teaching.
Who it is for
Warehouse, transportation, and inventory managers running an improvement project
Analysts and continuous improvement leads who want a consistent project format
Students and Green Belt candidates who want a complete example to learn from
What you need
Microsoft Excel. Some familiarity with DMAIC helps. This is a toolkit, not a course or a certification.
License
One purchase is a license for one person. Use the workbook for as many of your own projects as you like, at work or for clients, and share your finished output with your team. Please do not share or resell the workbook itself. The full terms are on the Terms of Use tab.
About the author
Dr. John Waller has more than 20 years of leadership experience in logistics, distribution, and transportation, and teaches supply chain management. He hosts The Supply Chain Autopsy.
Instant digital download.