



MuleSoft API Monitoring & Production Support Mastery (530 Pages PDF) | 🇮🇳 ₹999 | 🇺🇸 ~$10 USD
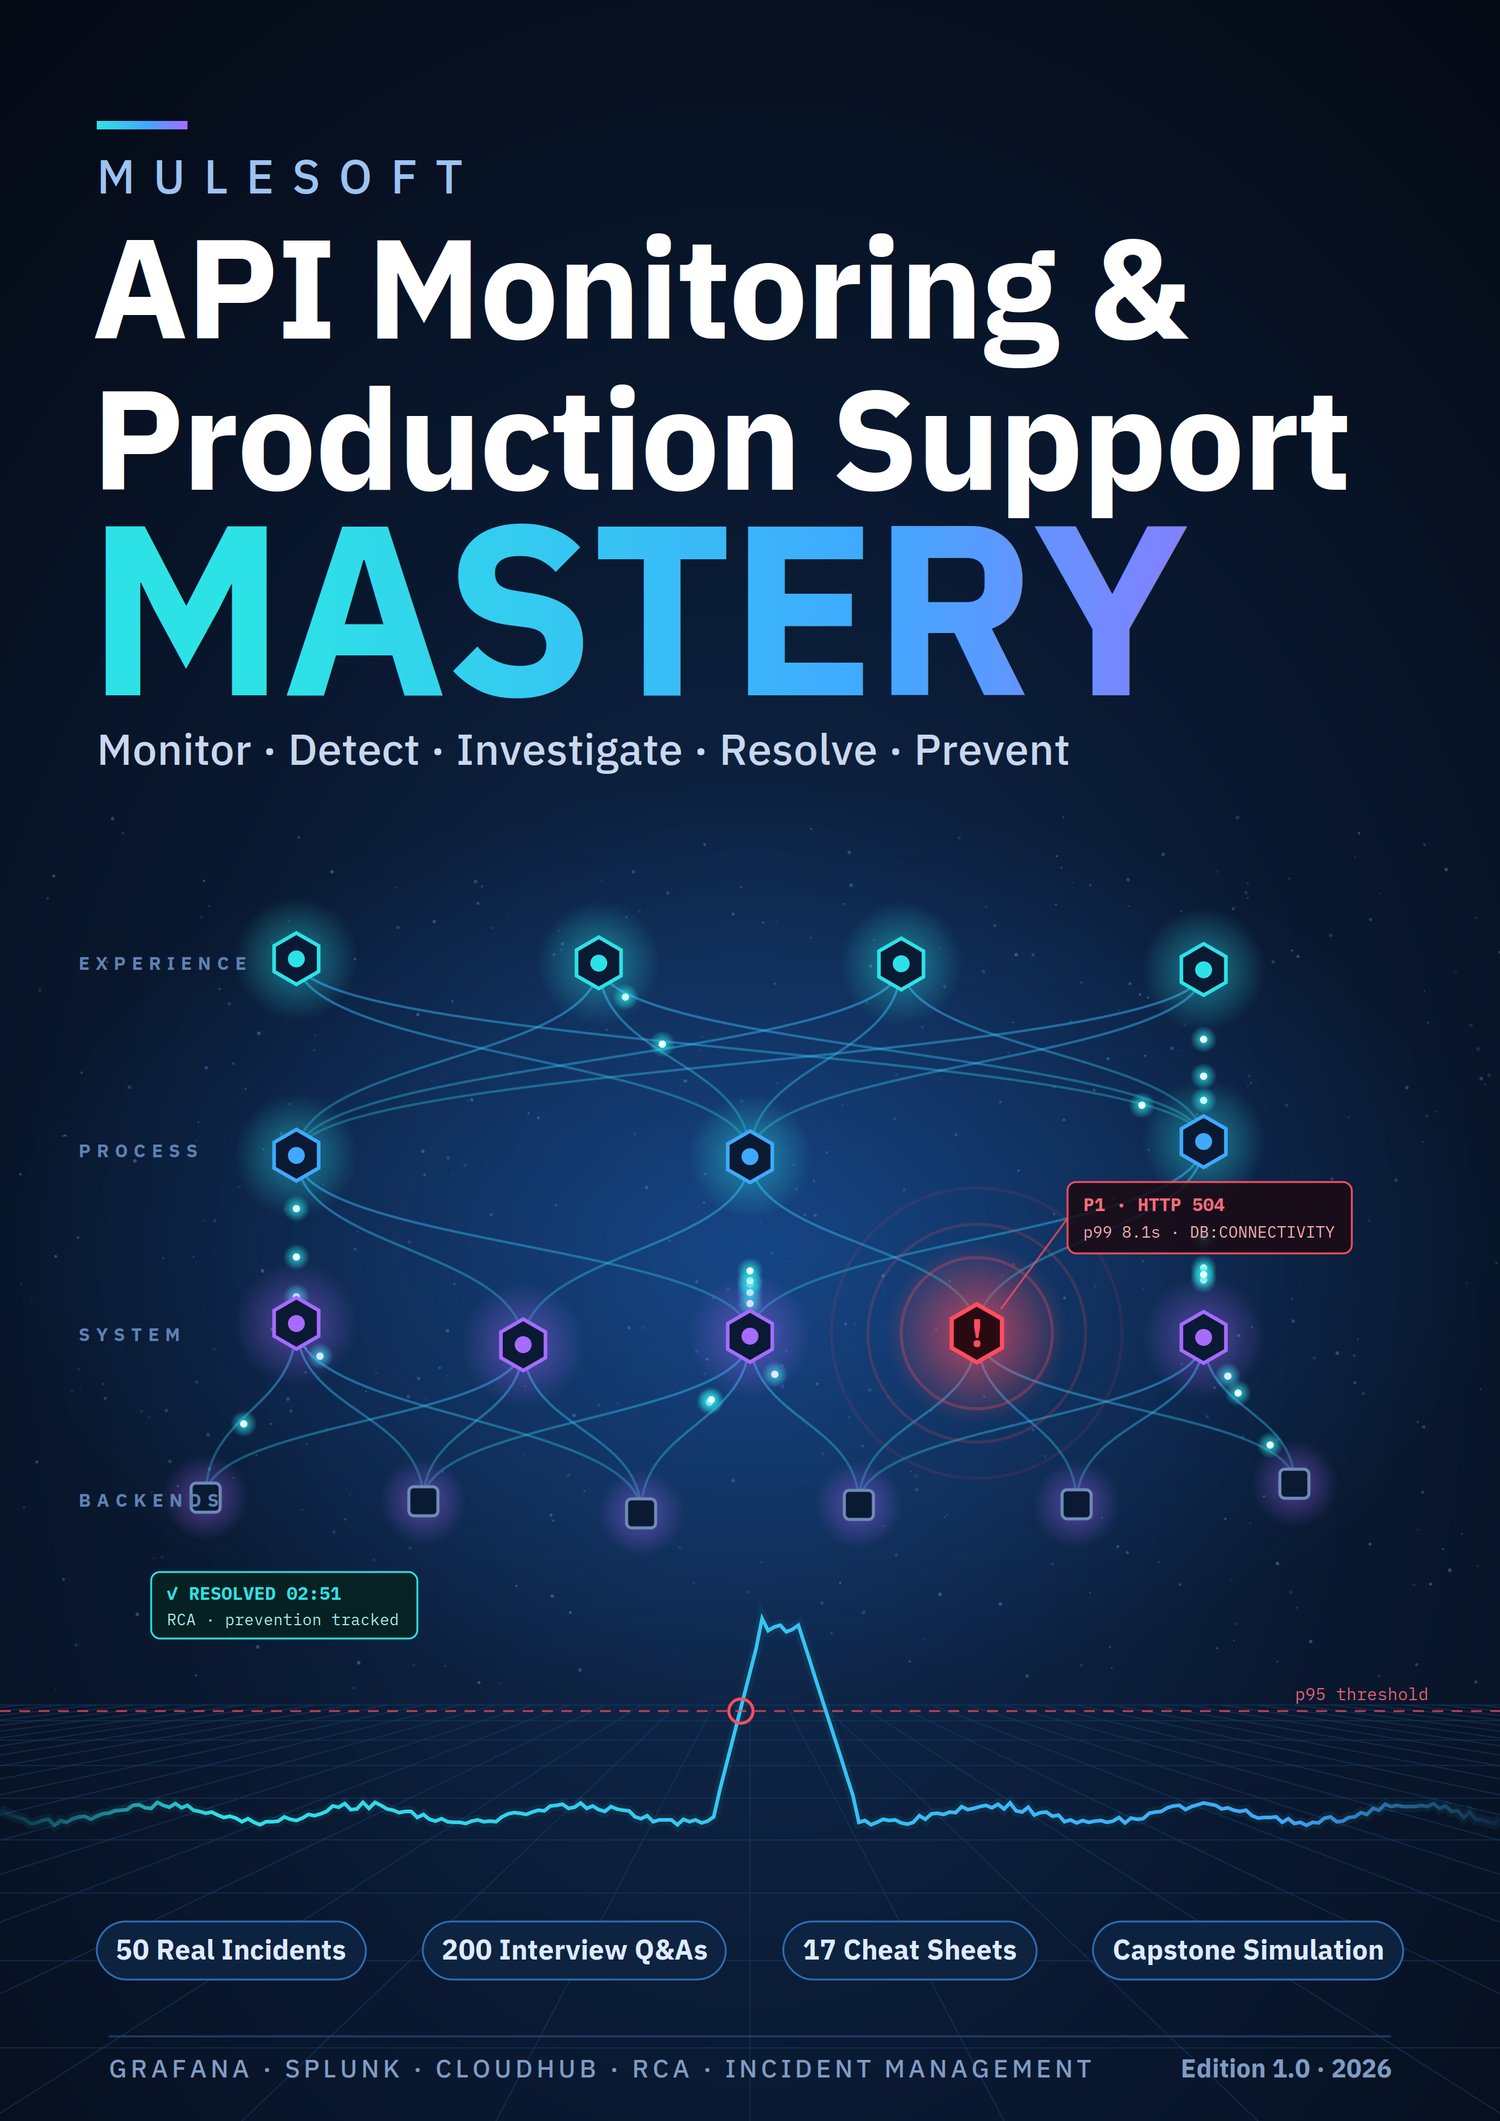
🚀 MuleSoft API Monitoring & Production Support Mastery
🛠️ The complete practical guide to API monitoring, Grafana, Splunk, CloudHub, troubleshooting, incident management, RCA, production operations and interview preparation
🔥 It's 3 a.m. An API is failing in production. What do you do?
The dashboard is red. Three alerts fire at once. The business says "orders aren't going through." The database team says it isn't them, the network team says the same, and everyone is looking at you. 😰
Most MuleSoft books teach you how to build integrations. This book teaches you how to keep them running: how to detect problems early, find the real root cause fast, restore service safely, communicate clearly, and make sure it never happens again. 💪
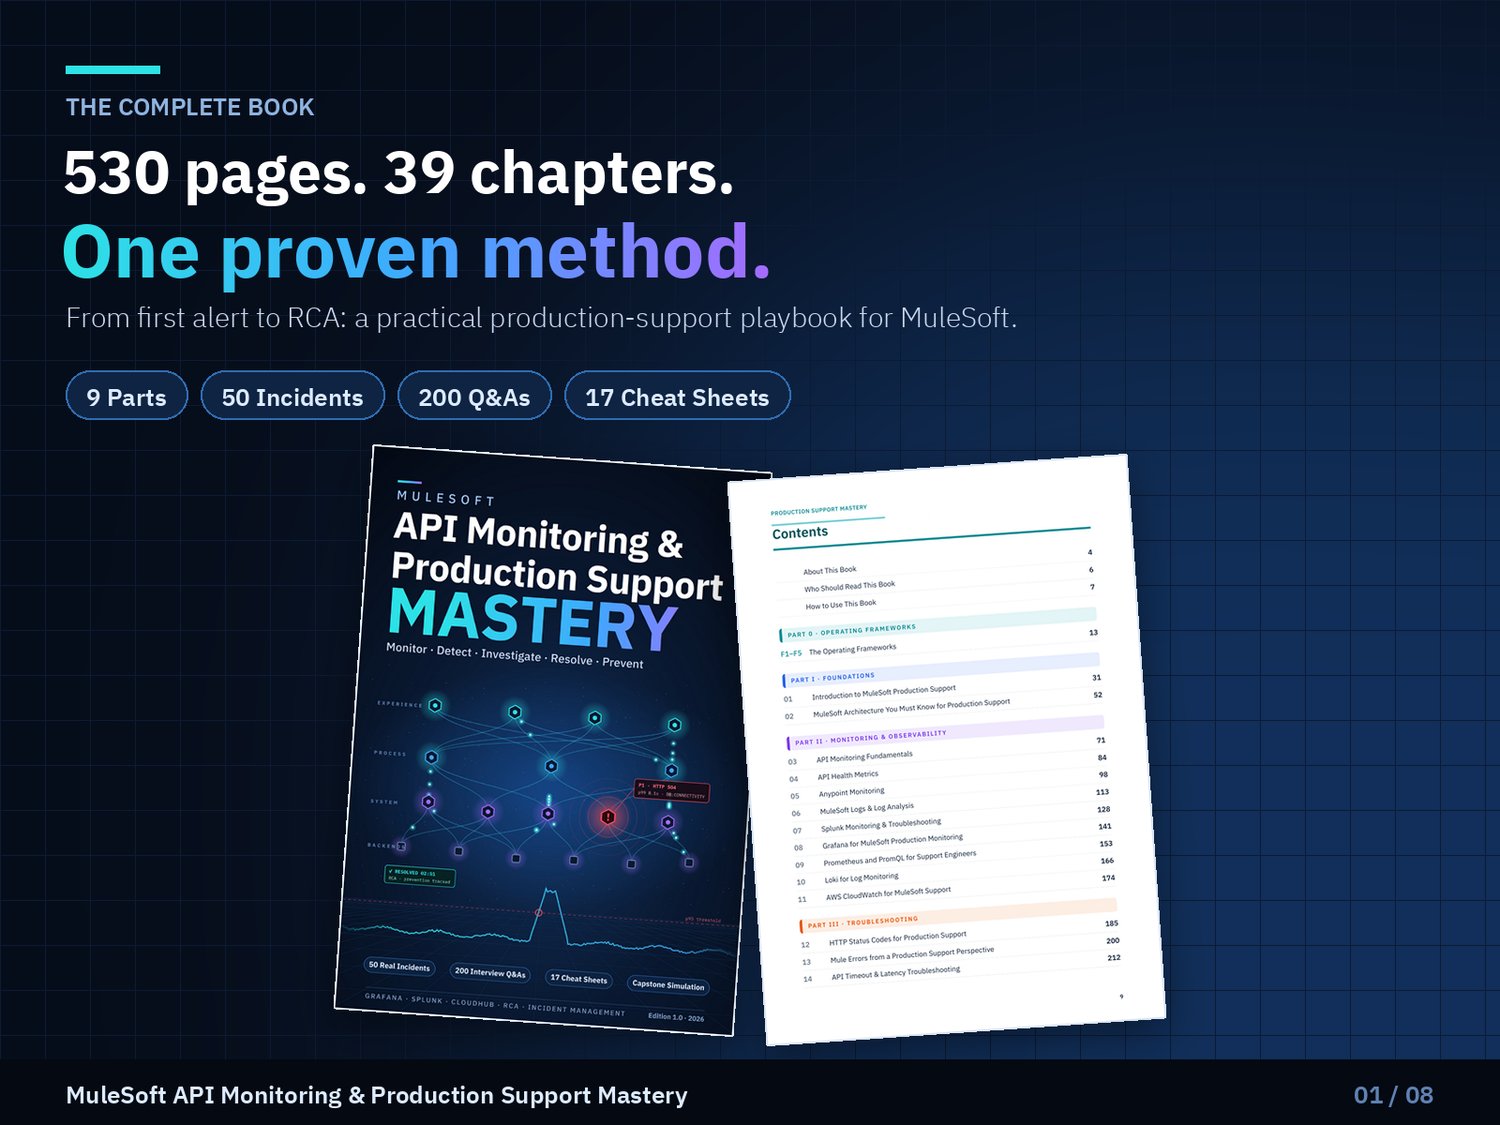
Written from the viewpoint of an experienced production support architect, this 530-page, 39-chapter guide turns production chaos into a calm, repeatable method you can use on every incident, with any tool, on any MuleSoft platform. 🧭
💡 Why this book is different
✅ Production-first. Every topic is explained through how it fails in production, where the evidence lives, and what to do next.
✅ One method, reused everywhere. Five operating frameworks are introduced up front and applied in every chapter, so your approach stays consistent while the technology changes.
✅ Honest about versions. MuleSoft capabilities vary by runtime, CloudHub generation, subscription and deployment model. The book separates lasting principles from version-specific behavior and tells you exactly where to verify. 🔎
✅ Scenario-driven. 50 worked incidents, a 10-incident capstone simulation and 200 interview answers, all grounded in realistic enterprise situations. 🏢
✅ No filler, no fake screenshots, no invented features. Just practical knowledge you can use on your next shift. 🎯
🧭 Part 0 · The Operating Frameworks
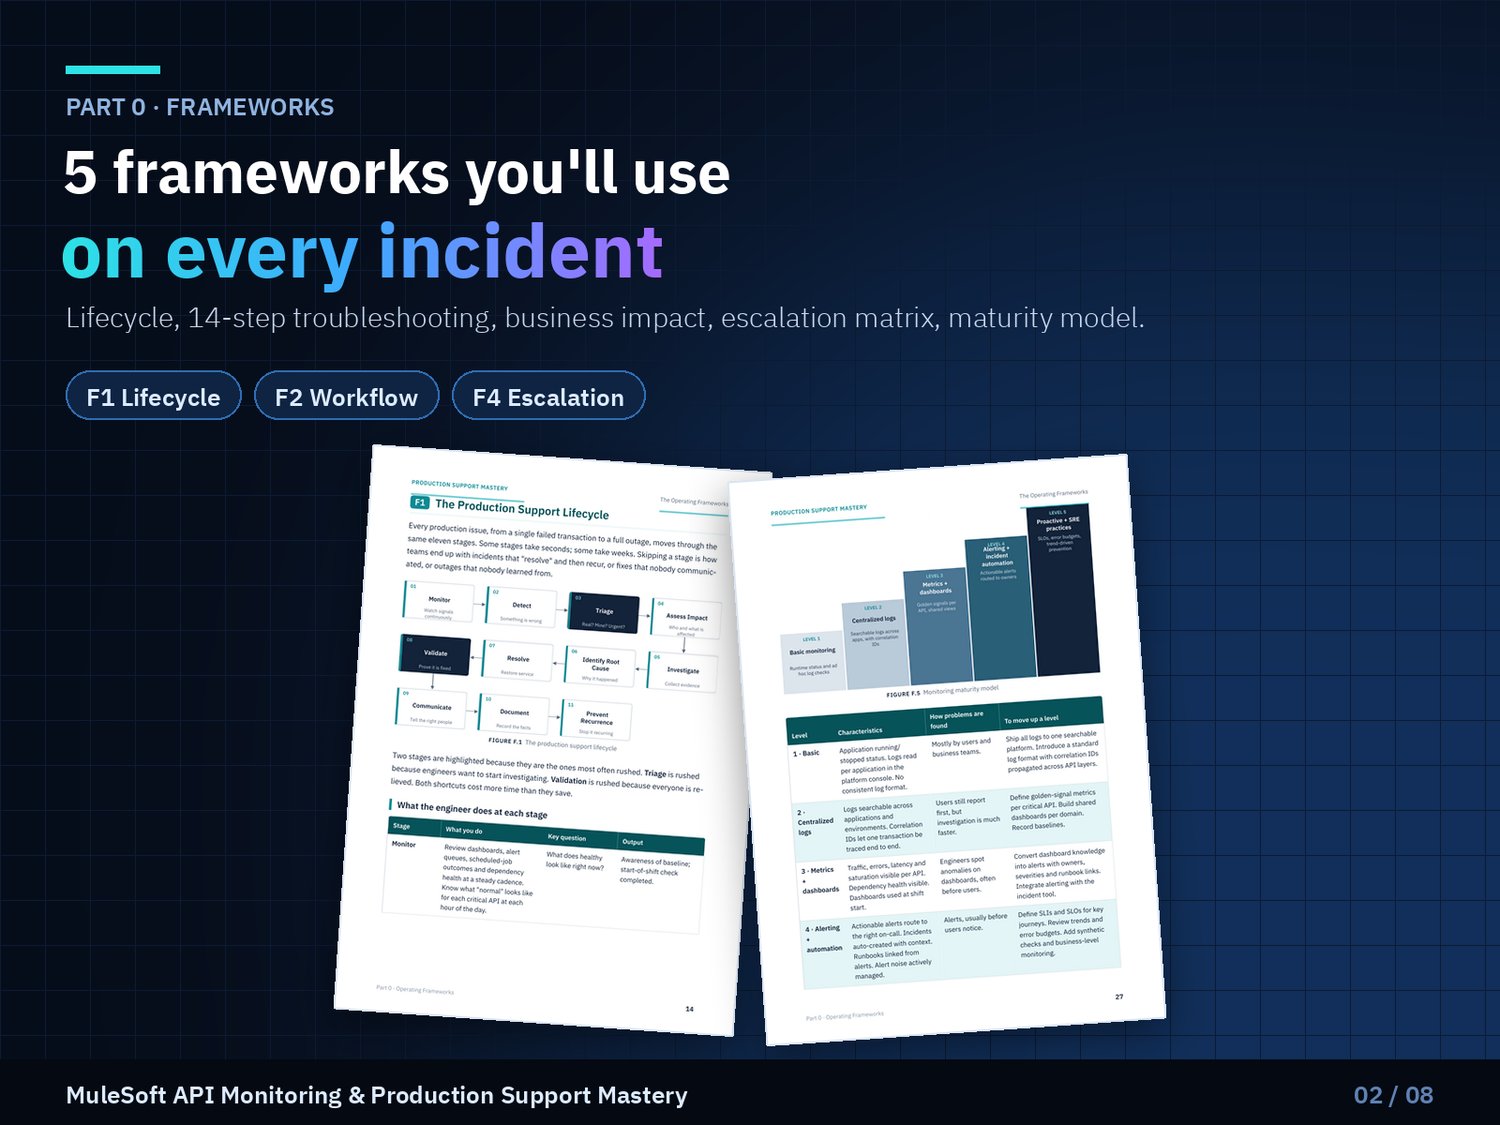
Five frameworks that shape how you think in production:
🔄 F1 · Production Support Lifecycle: Monitor → Detect → Triage → Assess Impact → Investigate → Root Cause → Resolve → Validate → Communicate → Document → Prevent
🧩 F2 · 14-Step Troubleshooting Workflow: the investigation method, including the step most engineers skip: check recent changes
💼 F3 · Business Impact Analysis: why a "1% error rate" can be harmless, serious or critical depending on which transactions fail
📞 F4 · Escalation Framework: a full escalation matrix, the "escalation packet" of evidence to bring, and how to get fast answers from other teams
📶 F5 · Monitoring Maturity Model: five levels from basic status checks to proactive, SLO-driven monitoring
🏗️ Part I · Foundations
👨💻 What a MuleSoft production support engineer actually does, including a realistic day in the life
🎚️ L1, L2 and L3 support, shift vs on-call work, and incident, problem and change management
🏛️ The MuleSoft architecture you need for support: runtime, flows, error handlers, API-led layers, connectors, CloudHub, CloudHub 2.0, Runtime Fabric and API Manager
🔗 How one database problem becomes errors at three API layers, and how to trace it back to where it started
📊 Part II · Monitoring & Observability
📈 API monitoring fundamentals: golden signals, RED and USE, availability, latency, throughput, baselines and seasonality
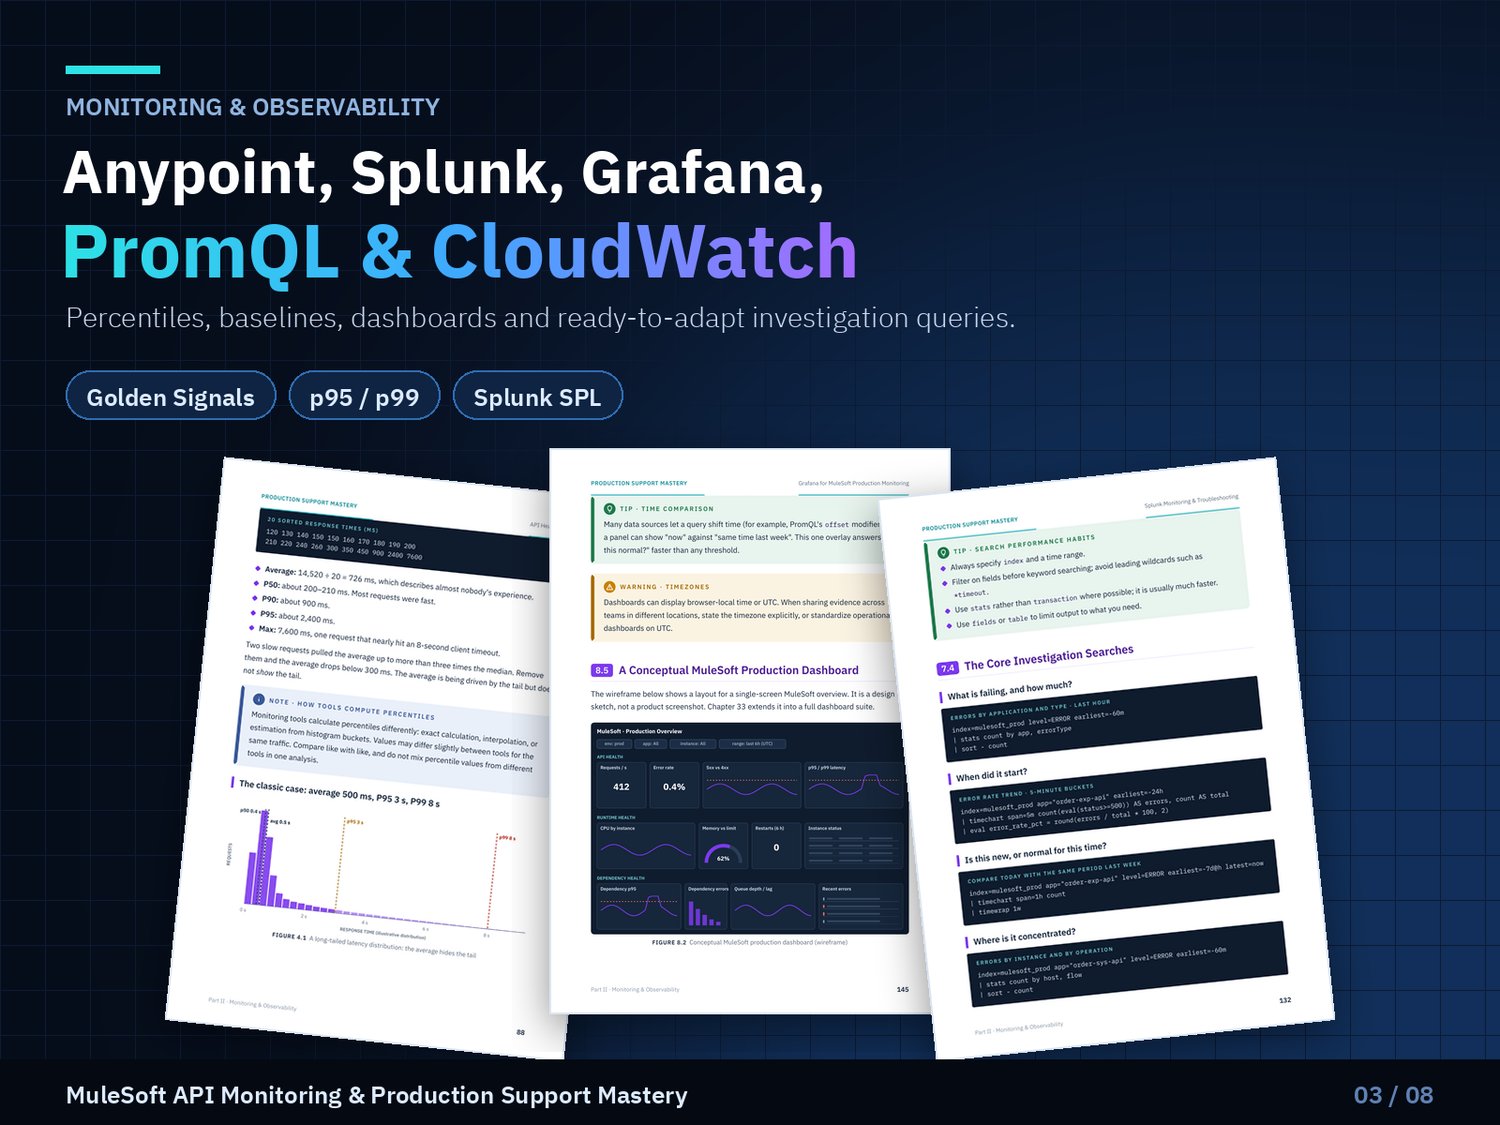
📐 Health metrics: why averages mislead, how to read p50/p95/p99, availability maths, and how a slow backend fills up every connection pool
🖥️ Anypoint Monitoring: dashboards, logs and alerts, with a full walkthrough of a 500 ms → 5 s latency incident
📜 Log analysis: how to read Mule error blocks and stack traces, and how to trace one request across services with correlation IDs
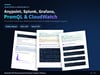
🔍 Splunk: efficient searches, error trends, week-over-week comparisons, percentiles, and search patterns for every common failure
📉 Grafana: panels, variables, alerting, and a complete conceptual MuleSoft dashboard
🧮 Prometheus & PromQL: rate vs increase, error percentages, histogram percentiles, and CPU, memory, restart and lag queries
🪵 Loki: labels, LogQL filters, and turning logs into metrics
☁️ AWS CloudWatch: SQS, SNS, Lambda and API Gateway metrics, Logs Insights, and the line between MuleSoft and AWS responsibilities
🔧 Part III · Troubleshooting
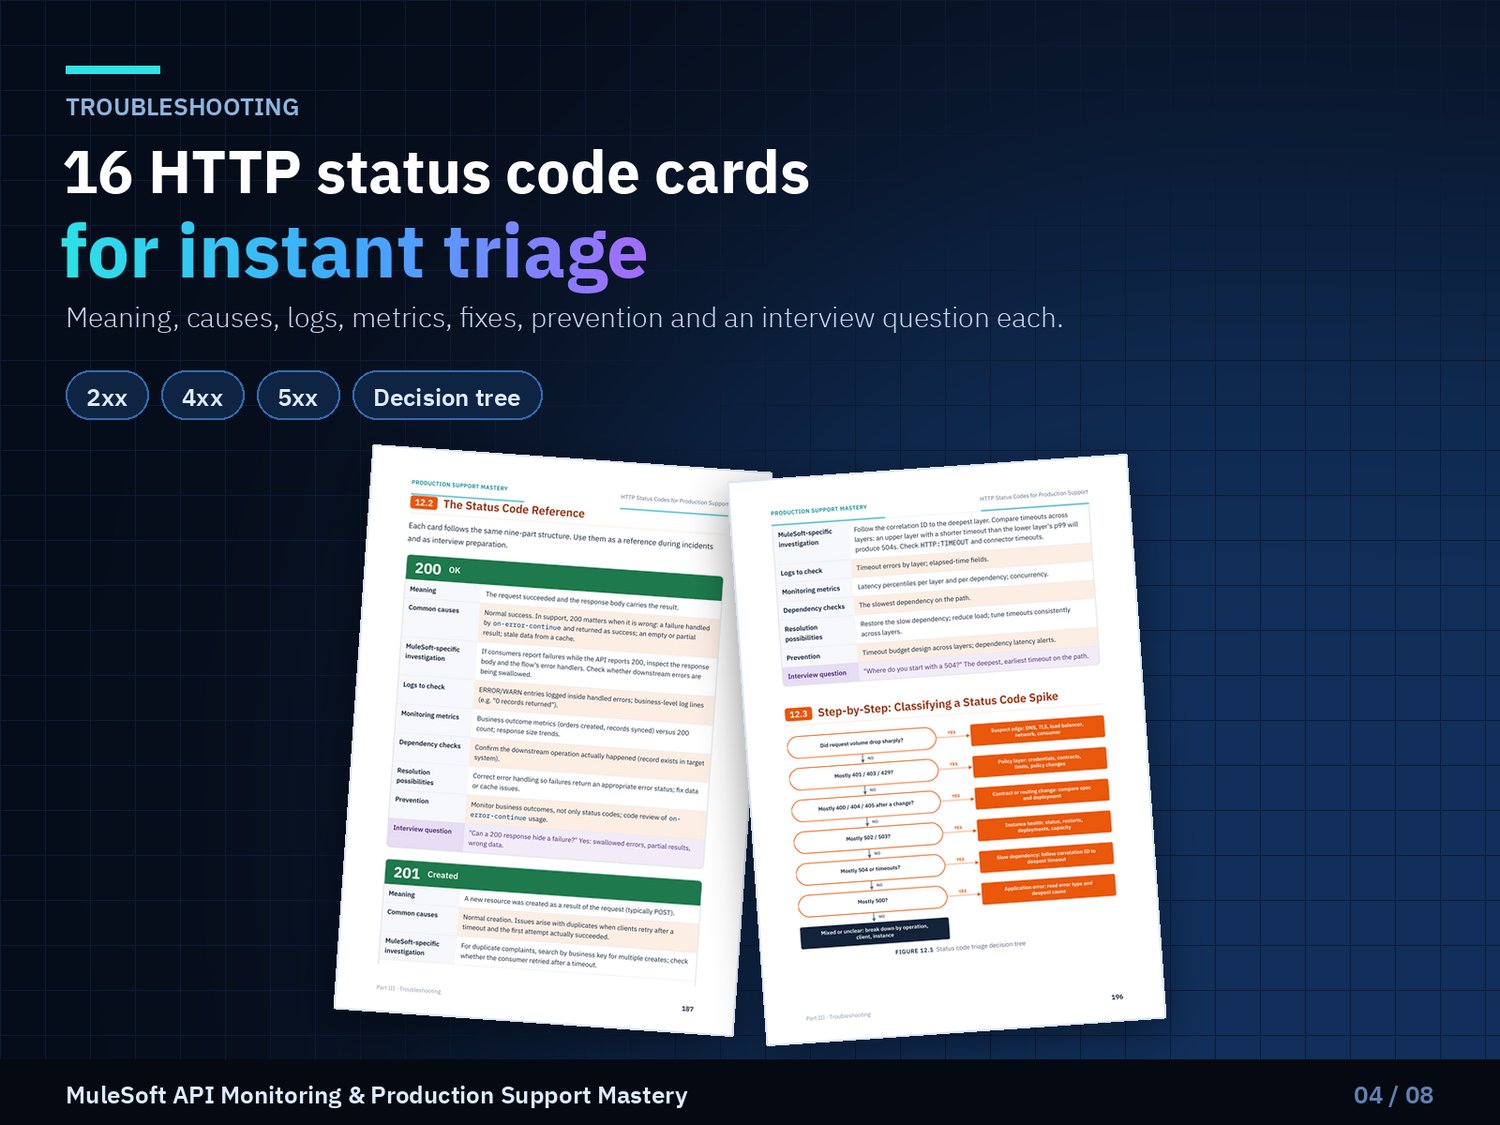
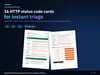
🚦 HTTP status codes: 16 colour-coded reference cards (200 to 504), each covering meaning, causes, MuleSoft investigation, logs, metrics, dependencies, resolution, prevention and an interview question
⚠️ Mule errors: error types and hierarchy, business vs technical errors, and when to retry, replay, escalate, restart or roll back
⏱️ Timeouts & latency: connection vs read timeouts, setting timeouts consistently across API layers, retries that multiply load, and a decision path to the real bottleneck
🗄️ Databases: pool exhaustion, leaks, deadlocks and slow queries, with error codes for Oracle, MySQL and PostgreSQL
☁️ Salesforce: OAuth failures, INVALID_SESSION_ID, API limits, record errors, Bulk API and a full authentication-outage workflow
🏭 SAP: RFC/BAPI, IDocs, connectivity, logon and application errors, and when to call the SAP team
📬 Messaging: Anypoint MQ, Kafka and JMS: backlogs, DLQs, consumer lag, duplicates and poison messages
🚀 Performance and memory: threads, back-pressure, streaming, OutOfMemoryError variants, memory leaks, and exactly what to gather before escalating
☁️ Part IV · Platform Support
🌐 CloudHub: workers, properties, load balancers, VPCs and VPNs, plus a step-by-step playbook for "the production app is unavailable"
📦 CloudHub 2.0: replicas, private spaces, ingress and egress, with a CloudHub 1.0 vs 2.0 support comparison
☸️ Runtime Fabric: pods, nodes and scheduling, with a clear split between MuleSoft support and Kubernetes team responsibilities
🔐 API security: client ID enforcement, OAuth, JWT, TLS and certificates, IP restrictions, rate limiting and spike control, with 5 real scenarios
🧰 API Manager: autodiscovery, policies, contracts, SLA tiers and policy violations
🚨 Part V · Incident, Problem & Change
🆘 Incident lifecycle, P1 to P4 severity with realistic examples, and major incident roles
📣 Ready-to-use communication templates: initial notification, investigation update, escalation, resolution, closure and executive summary
🧪 RCA: 5 Whys, fishbone diagrams, timeline analysis, and a complete RCA template
🔁 Change management: a full before- and after-deployment checklist, plus rollback strategy
🎯 SLA, SLO and SLI: error budgets and MTTD, MTTA, MTTR and MTBF with worked calculations
🌙 On-call: a readiness checklist, on-call workflow and shift handover template
📉 Part VI · Dashboards & Alerting
🖼️ A four-dashboard production suite covering API health, runtime health, integration health and business health, each built as Metric → Visualization → Threshold → Alert → Action
🔔 Alert design that works: why "CPU > 80%" is a bad alert, how to set thresholds from real baselines, and how to fight alert fatigue and alert storms
🎮 Part VII · Playbooks & Simulation
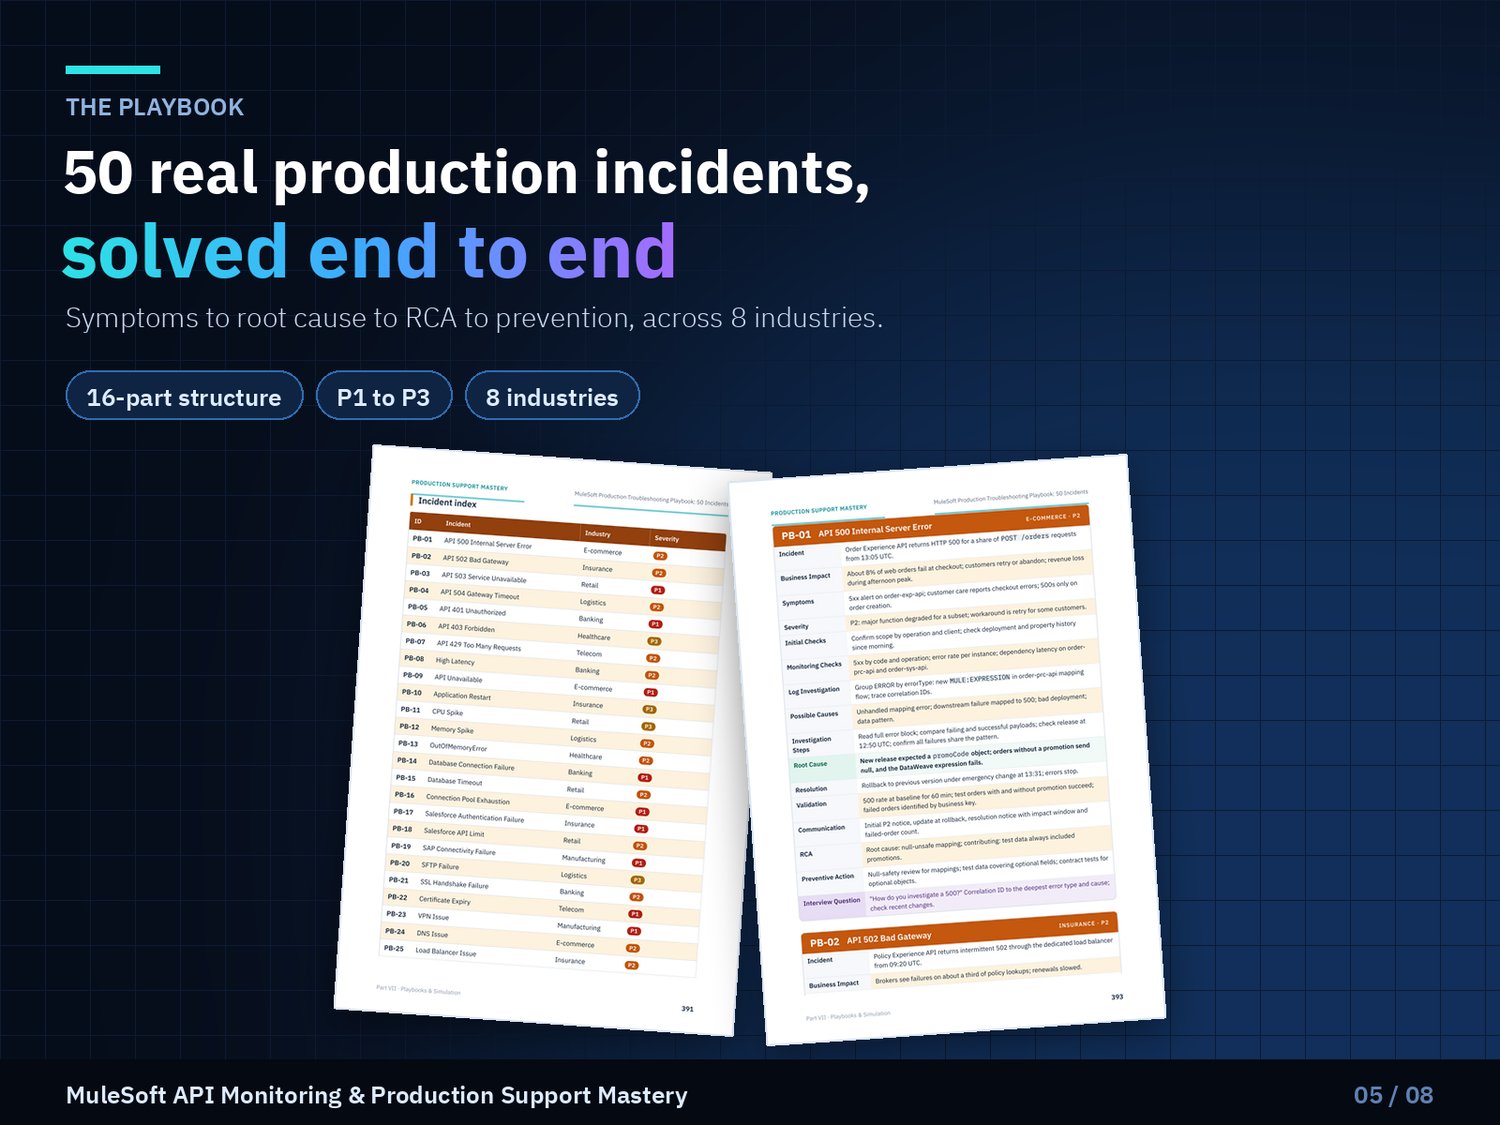
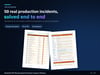
🔥 50 real-world production incidents, each with the same 16-part structure: Incident, Business Impact, Symptoms, Severity, Initial Checks, Monitoring Checks, Log Investigation, Possible Causes, Investigation Steps, Root Cause, Resolution, Validation, Communication, RCA, Preventive Action and an Interview Question.
The incidents cover banking 🏦, retail 🛒, e-commerce 📦, healthcare 🏥, insurance 📑, logistics 🚚, telecom 📡 and manufacturing 🏭.
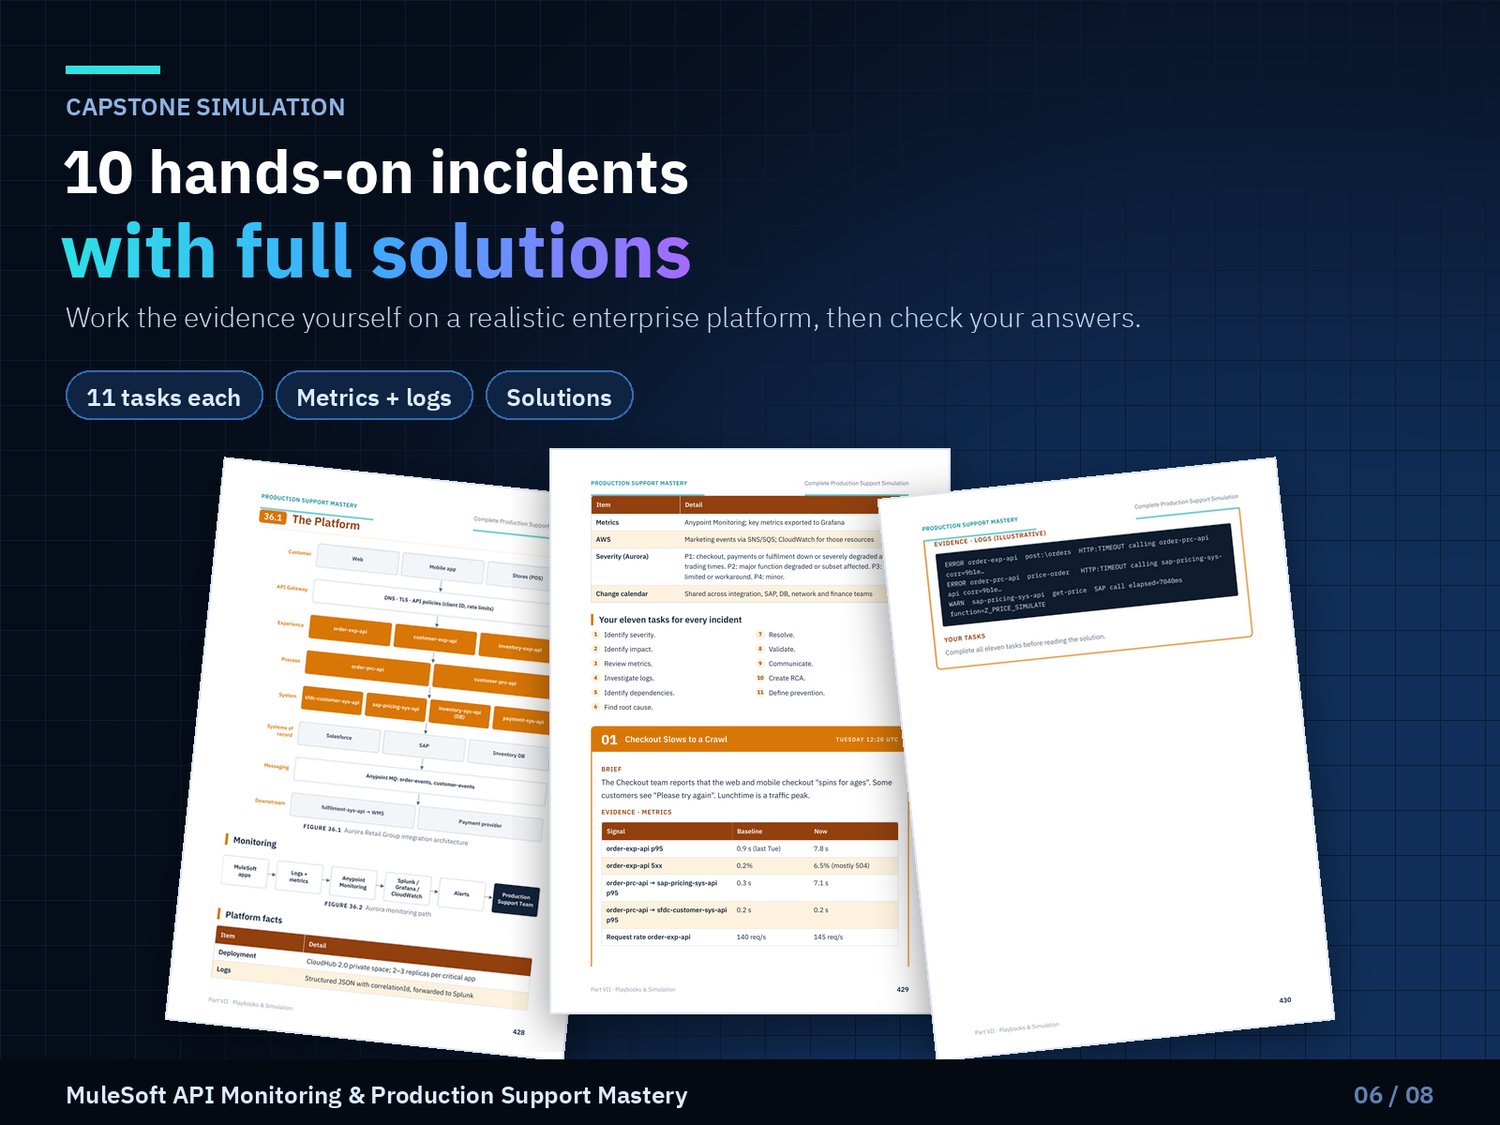
🏆 Capstone simulation: join the support team at a fictional enterprise retailer and work through 10 production incidents yourself, from SAP locks and API-limit exhaustion to certificate expiry, memory leaks and silent job failures. Each exercise comes with a full solution.
🎤 Part VIII · Interview Preparation
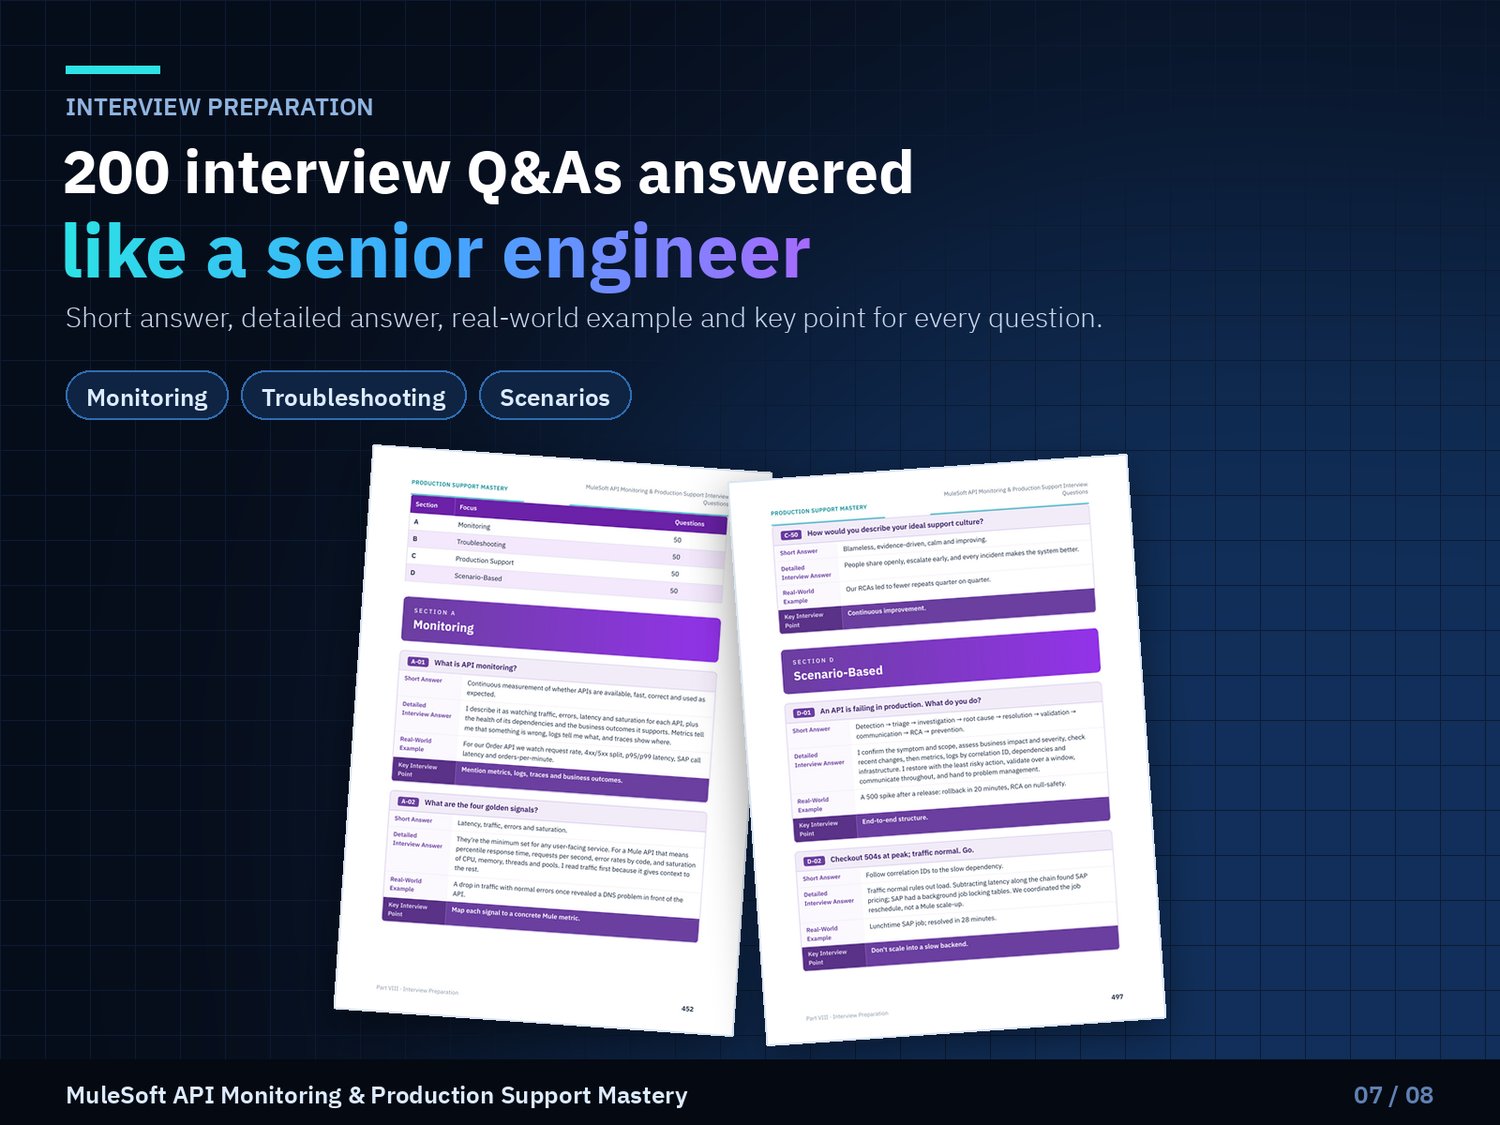
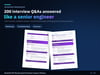
💬 200 interview questions, each with a short answer, a detailed first-person answer, a real-world example and the key point interviewers listen for:
📊 50 on monitoring
🔧 50 on troubleshooting
🛡️ 50 on production support
🎭 50 scenario-based questions
📋 Part IX · Reference
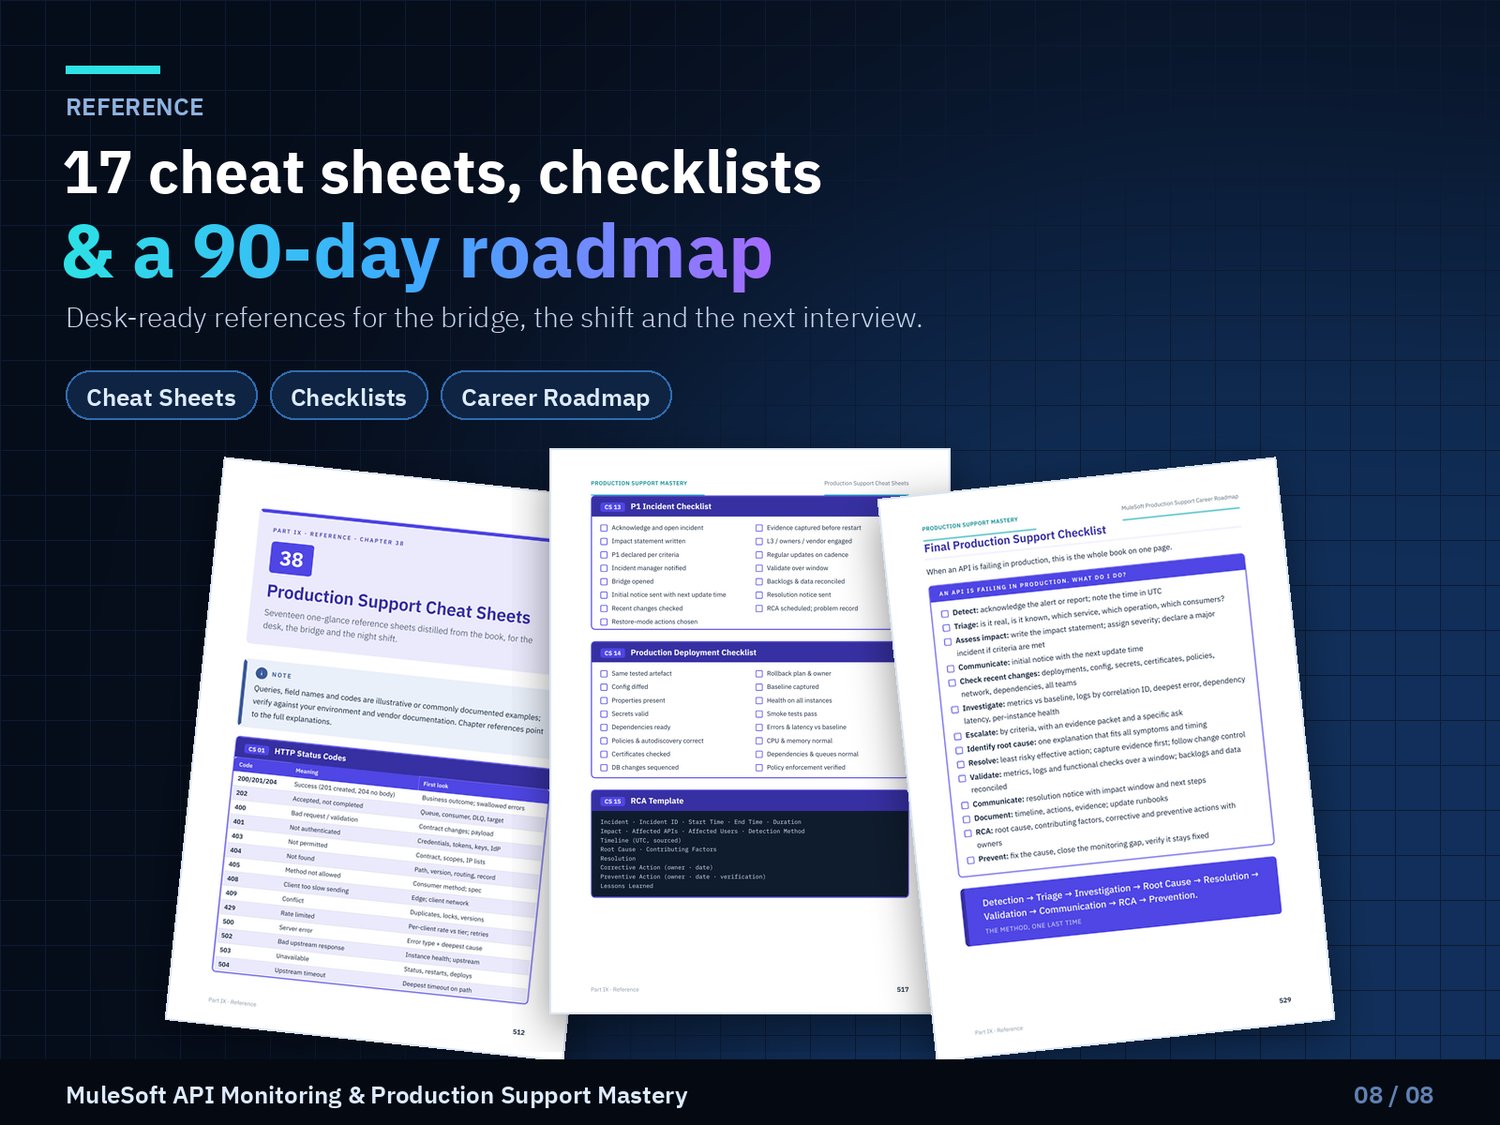
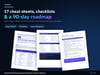
🗂️ 17 one-page cheat sheets: HTTP codes, Mule errors, metrics, Splunk, Grafana, CloudWatch, CloudHub, API Manager, MQ, database, Salesforce, SAP, P1 checklist, deployment checklist, RCA template, shift handover and daily monitoring
✅ Start-of-shift, daily, weekly and monthly checklists
🗺️ Career roadmap: from MuleSoft developer to support lead, SRE and integration architect, with 30/60/90-day learning plans
⭐ Top 50 concepts, top 50 production scenarios and top 50 interview questions for quick revision
👥 Who this book is for
🔄 MuleSoft developers moving into production support
🛠️ L1, L2 and L3 support engineers
☁️ CloudHub, Runtime Fabric and platform administrators
⚙️ DevOps, SRE and monitoring engineers working with MuleSoft
👔 Support leads who want to standardize their team's practices
🎓 Professionals with 2–8 years of MuleSoft experience preparing for support interviews
🎁 What you'll be able to do after reading
✔️ Read any dashboard and quickly tell healthy from quietly degrading
✔️ Trace a failure through the API layers to the component that actually caused it
✔️ Judge business impact and severity correctly under pressure
✔️ Escalate with evidence that gets fast answers
✔️ Restore service safely without destroying evidence or creating duplicates
✔️ Write clear incident updates and blameless, useful RCAs
✔️ Design dashboards and alerts your team trusts
✔️ Walk into a support interview and answer scenario questions with confidence
⚡ Stop guessing during outages. Start resolving them with a proven method.
📖 Your next production incident is coming. Be the engineer who knows exactly what to do. 💪🚀