


FFT Spectrum Analyzer
FFT Spectrum Analyzer
FFT Spectrum Analyzer is a browser-based audio analysis tool that shows the frequency content of live microphone input in real time. It includes a live spectrum view, a live spectrogram view, and an impulse response measurement mode, helping visitors see how sound energy is distributed, how frequencies change over time, and how a room or playback system responds to a test sweep.
What the App Does
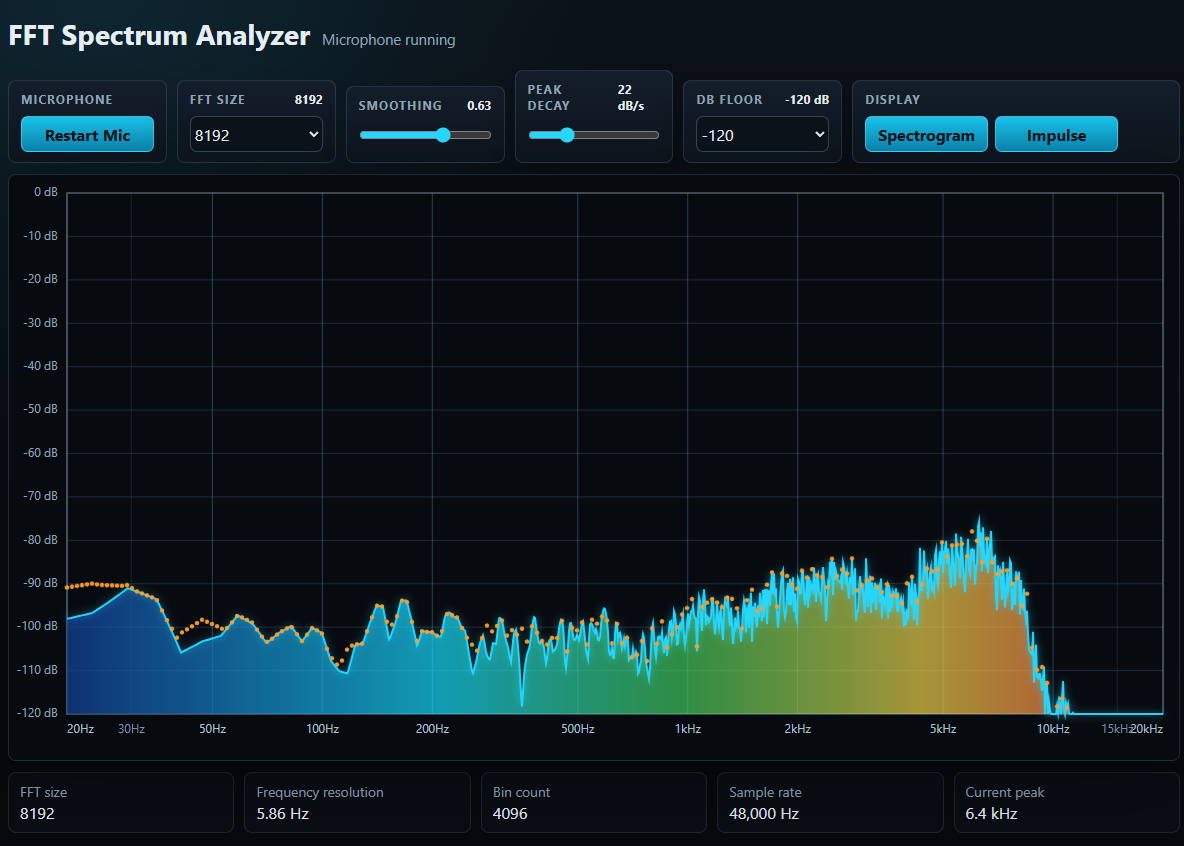
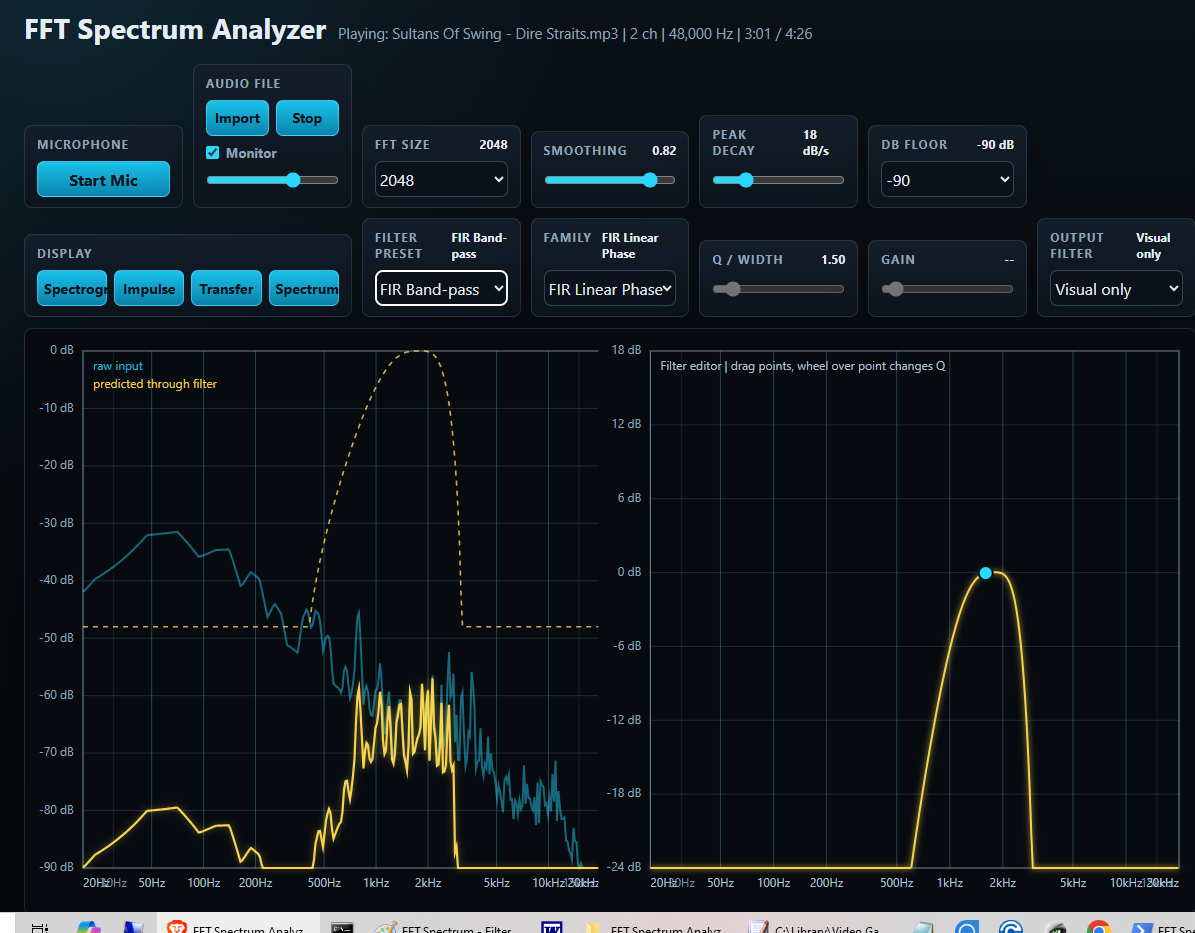
The app listens to microphone input, performs a Fast Fourier Transform (FFT), and displays the result as either a live spectrum graph or a live spectrogram. In spectrum view, the horizontal axis shows frequency from 20 Hz to 20 kHz on a logarithmic scale, which matches how audio engineers and musicians commonly view sound. The vertical axis shows amplitude in dBFS, from the selected noise floor up to 0 dBFS.
In spectrogram view, the app shows frequency vertically and time horizontally, with newer audio appearing at the right side of the display. A warm color scale shows amplitude, from very quiet dark tones through red, orange, yellow, and bright white for the loudest sounds.
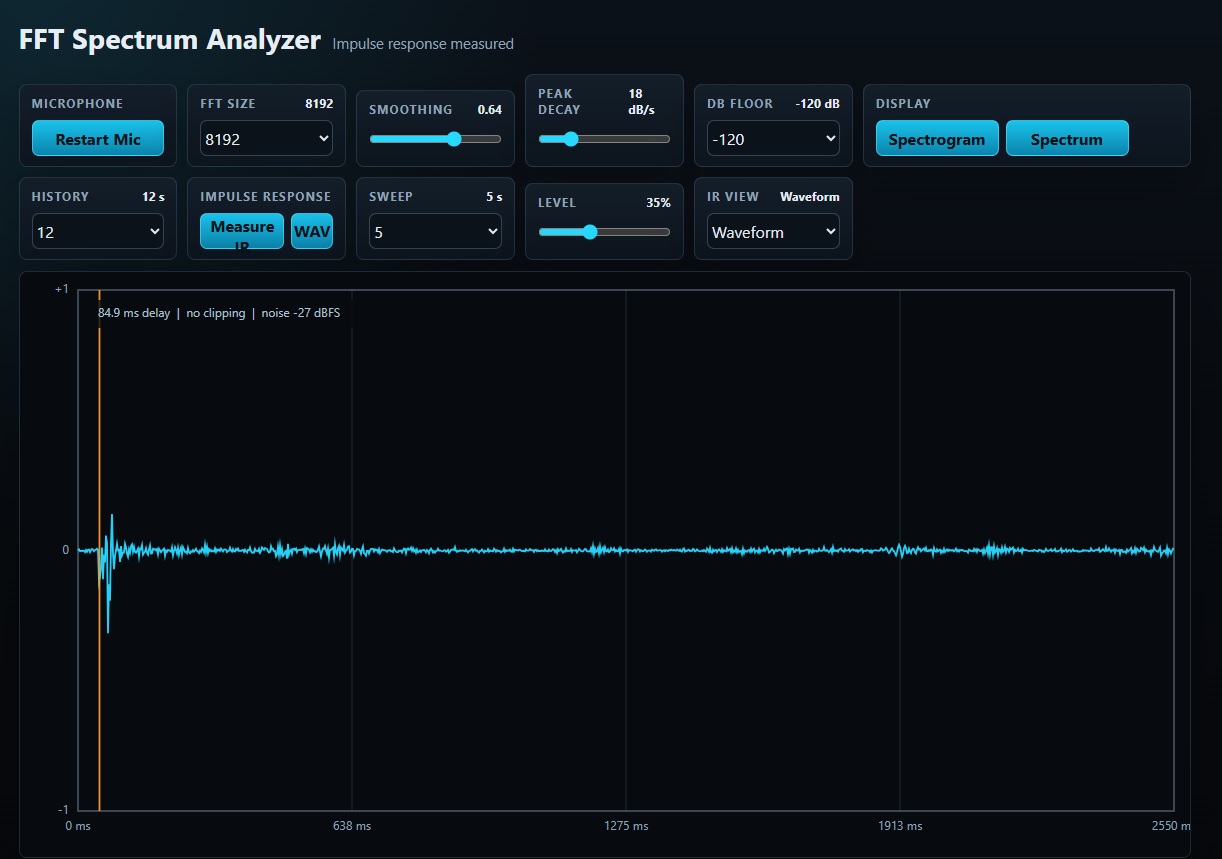
In impulse response mode, the app plays a logarithmic sweep through the speakers, records the microphone response, and calculates an impulse response. The result can be viewed as a waveform, a decay curve, or a frequency response, and it can be exported as a WAV file.
This makes it useful for observing tones, room noise, speech, music, speaker output, hum, feedback, sweeps, transients, changing harmonics, early reflections, room decay, and other audio signals in real time.
Main Features
- Live microphone input: The analyzer requests microphone permission from the browser and processes the audio locally in the user's browser tab.
- FFT spectrum display: Converts incoming sound into frequency-domain data so users can see which frequencies are present.
- Live spectrogram display: Shows how frequencies change over time, making moving tones, speech patterns, bursts, sweeps, and short events easier to inspect.
- One-click display switching: Users can switch between the spectrum graph, spectrogram view, and impulse response mode without restarting the app.
- Impulse response measurement: Plays a logarithmic sweep, records the microphone response, and derives an impulse response for room and system analysis.
- Adjustable sweep settings: Users can choose sweep length and output level before measuring.
- Impulse response result views: Displays the measured response as a waveform, decay curve, or frequency response.
- Measurement status checks: Shows useful measurement feedback such as delay, clipping status, and noise estimate.
- WAV export: Lets users export the measured impulse response as a WAV file for use in other audio tools.
- Log-scaled frequency axis: Displays 20 Hz to 20 kHz with meaningful frequency labels such as 20, 50, 100, 200, 500, 1k, 2k, 5k, 10k, and 20k Hz.
- dB amplitude scale: Shows signal level using a dBFS-style vertical scale with grid lines for easier reading.
- Gradient-filled spectrum: Uses deep blue, cyan, green, yellow, and red colors to make intensity and frequency regions easy to distinguish.
- Warm spectrogram amplitude colors: Uses dark red, red, orange, yellow, and bright white to show increasing signal strength over time.
- Adjustable spectrogram history: Users can choose how much recent audio history is visible, with options from 5 seconds to 120 seconds.
- Clear spectrogram history: A dedicated clear button appears in spectrogram view so users can reset the time history before a new measurement.
- Cyan trace line: Draws a clear real-time line over the spectrum for precise visual tracking.
- Peak hold dots: Orange dots show recent peak levels across the frequency range and decay over time.
- Adjustable FFT size: Users can choose from 256 to 16384 points while the analyzer is running.
- Smoothing control: Lets users choose whether the display reacts quickly or moves more steadily.
- Peak decay control: Controls how quickly the orange peak-hold indicators fall back down.
- Selectable dB floor: Lets users choose a display floor from -60 dB to -120 dB depending on the signal level and noise environment.
- Live technical readouts: The footer shows FFT size, frequency resolution, bin count, sample rate, and the current peak frequency.
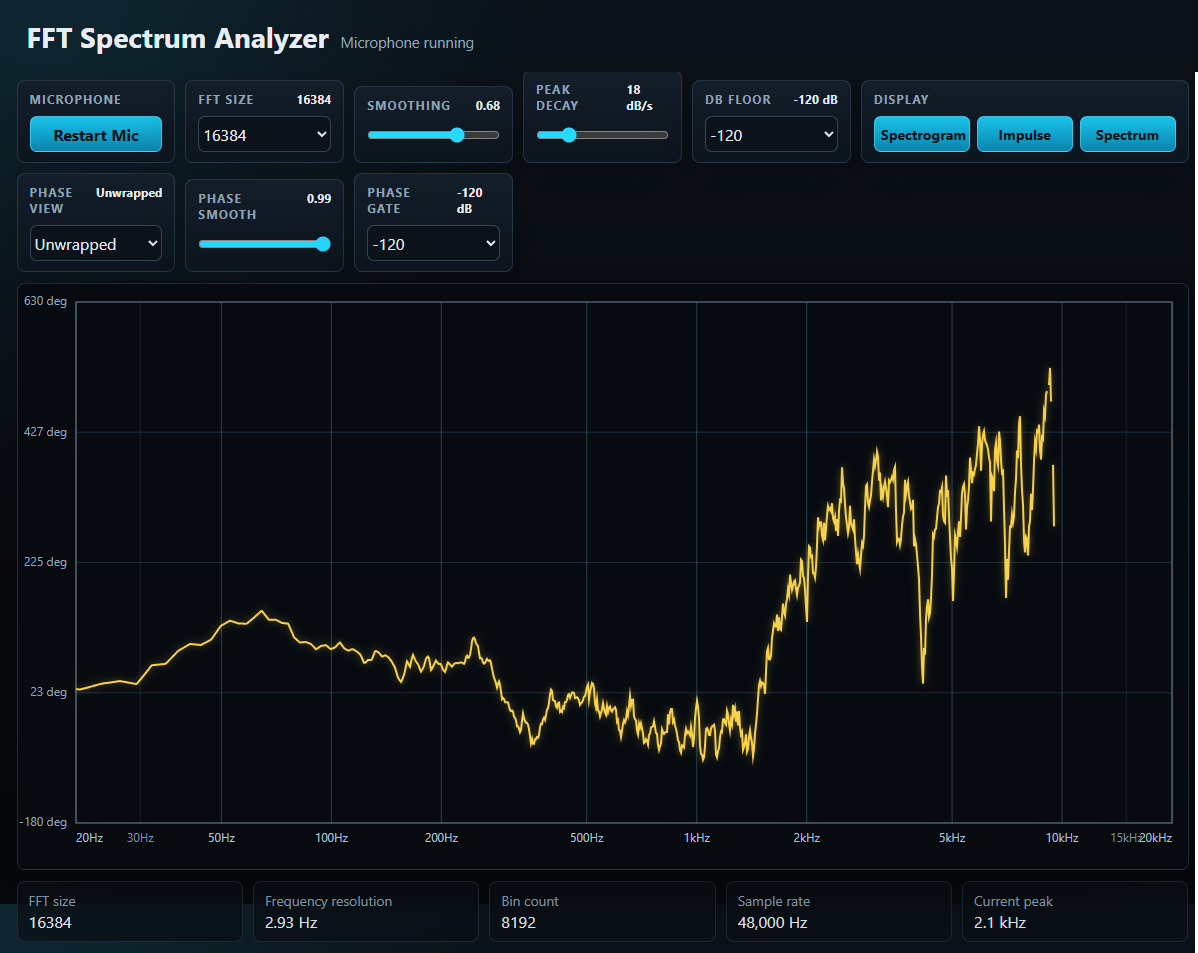
- Phase, wrapped, unwrapped. Phase smooth. Phase gate.
How to Use It
- Open the FFT Spectrum Analyzer page in a modern browser.
- Click Start Mic.
- When the browser asks for permission, allow microphone access.
- Play a sound, speak into the microphone, or measure sound from a nearby speaker or environment.
- Watch the live spectrum display. Low frequencies appear on the left, high frequencies appear on the right, and louder signals rise higher on the graph.
- Click Spectrogram to switch to the time-history view. New audio appears on the right, older audio scrolls left, and louder sounds appear in warmer, brighter colors.
- Use History to choose how many seconds of spectrogram data remain visible.
- Use the clear history button in spectrogram view to reset the display before checking a new sound or event.
- Click Spectrum to return to the live spectrum graph.
- Click Impulse to open impulse response mode.
- Choose the sweep length and output level. Start with a moderate level to avoid speaker discomfort or microphone clipping.
- Click Measure IR. The app plays a sweep, records the microphone response, and calculates the impulse response after the sweep finishes.
- Use IR View to inspect the result as a waveform, decay curve, or frequency response.
- Use WAV to export the measured impulse response for use in other audio applications.
- Use FFT Size to adjust the tradeoff between frequency detail and response speed. Larger FFT sizes provide finer frequency resolution, while smaller sizes respond faster.
- Use Smoothing to make the trace steadier or more responsive.
- Use Peak Decay to control how long the orange peak indicators remain visible.
- Use dB Floor to adjust the visible noise floor for quiet or loud environments.
Understanding the Display
Frequency axis: The bottom axis is logarithmic from 20 Hz to 20 kHz. This gives more visual space to the lower and middle frequencies, where many musical and room-acoustic details are easier to inspect.
Amplitude axis: The left axis shows level in dBFS. Values closer to 0 dB are louder. Lower values represent quieter sound or background noise.
Spectrogram view: Frequency is shown vertically from 20 Hz to 20 kHz, while time moves from left to right with the newest audio at the right edge. Dark colors indicate quiet energy, and warmer brighter colors indicate stronger energy.
Spectrogram history: The History control changes the visible time window. Shorter windows show fast changes with more visual detail, while longer windows make it easier to compare events over a longer period.
Impulse response waveform: Shows the measured response over time, including the main arrival and reflections that follow it.
Impulse response decay: Shows how the measured sound energy falls over time, which helps users compare room decay and reverberation behavior.
Impulse response frequency response: Shows the relative frequency response derived from the measured impulse response.
Impulse response export: The measured impulse response can be exported as a WAV file for additional analysis, convolution, or documentation.
Peak frequency: The footer reports the strongest frequency currently detected in the measured range.
Peak hold: Orange dots show recent maximum levels and slowly decay, making short peaks easier to notice.
Privacy and Browser Requirements
The microphone audio is analyzed locally in the browser. The app does not need to upload audio to a server for the spectrum, spectrogram, or impulse response tools to work.
Microphone access requires browser permission. Some browsers may require the page to be served from HTTPS or from localhost before microphone access is allowed.
Impulse response measurement plays an audible sweep through the selected playback device. Measurement quality depends on the speaker, microphone, room noise, browser audio path, and playback level, so results should be treated as practical room and system measurements rather than laboratory calibration data.
Suggested website note: For best results, measure in a quiet environment and use a moderate playback level. Browser microphone processing, device microphones, speakers, and room acoustics can affect what appears on the spectrum, spectrogram, and impulse response displays.
FEATURES
Live FFT spectrum analyzer from microphone input.
- Spectrogram display with scrolling frequency history.
- Impulse response measurement using a generated log sweep.
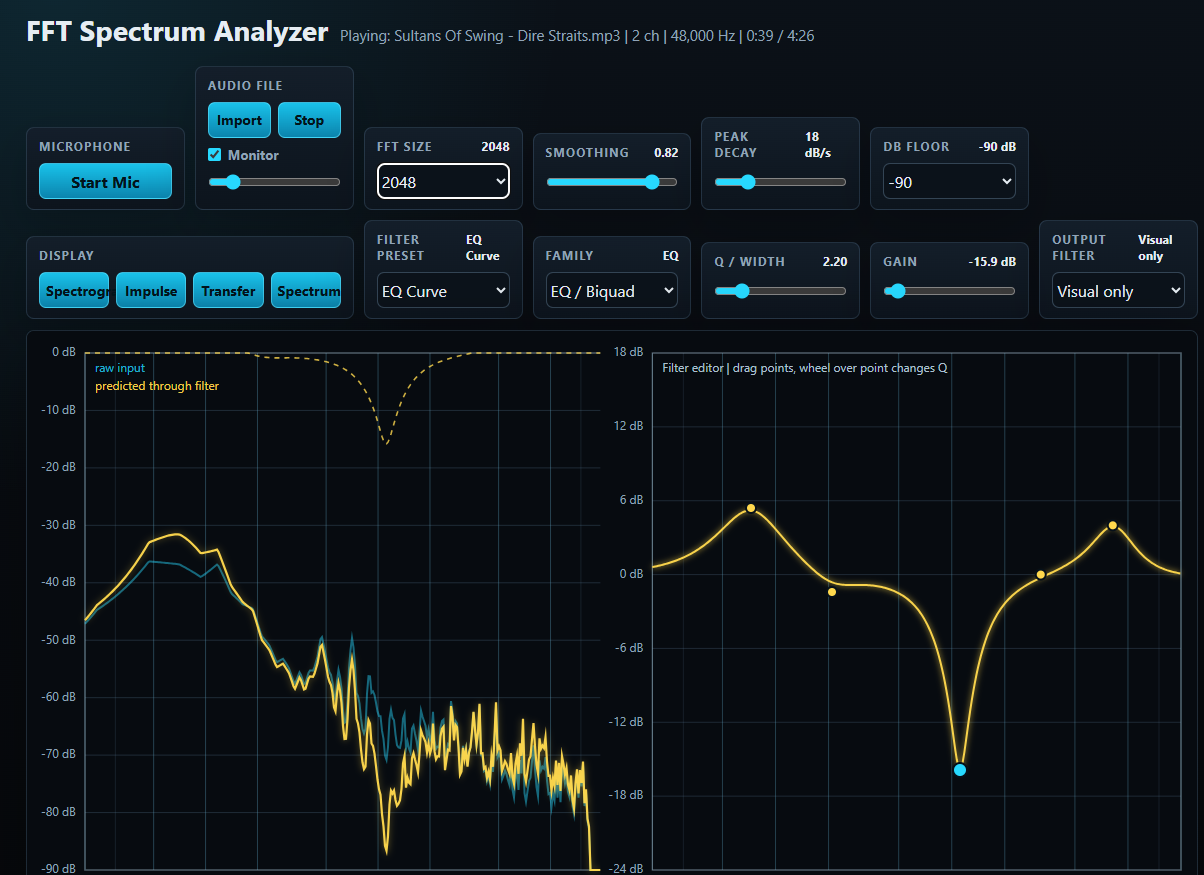
- Transfer Function mode using two-channel input:
- reference/input signal on left channel
- measurement/output signal on right channel
- mono fallback duplicates the same channel when stereo is unavailable
- Transfer magnitude display: 20 * log10(|H(f)|).
- Transfer phase display:
- wrapped transfer phase
- unwrapped transfer phase
- Raw FFT phase display:
- wrapped raw FFT phase
- unwrapped raw FFT phase
- Group delay display from unwrapped transfer phase:
- tau_g(f) = -d(phi) / d(omega)
- shown in milliseconds
- Magnitude-squared coherence display:
- estimates Sxx, Syy, and Sxy over averaged FFT frames
- computes gamma²(f) = |Sxy|² / (Sxx * Syy)
- Reliability gating:
- hides low-reference bins
- hides low-coherence transfer phase and group-delay bins
- dims weaker/unreliable magnitude/coherence regions where applicable
- Log-frequency plotting for acoustic-style frequency display.
- Peak hold indicators in spectrum view.
- Live readouts for FFT size, frequency resolution, bin count, sample rate, and current peak.