


Content Creator Income and Tax Tracker
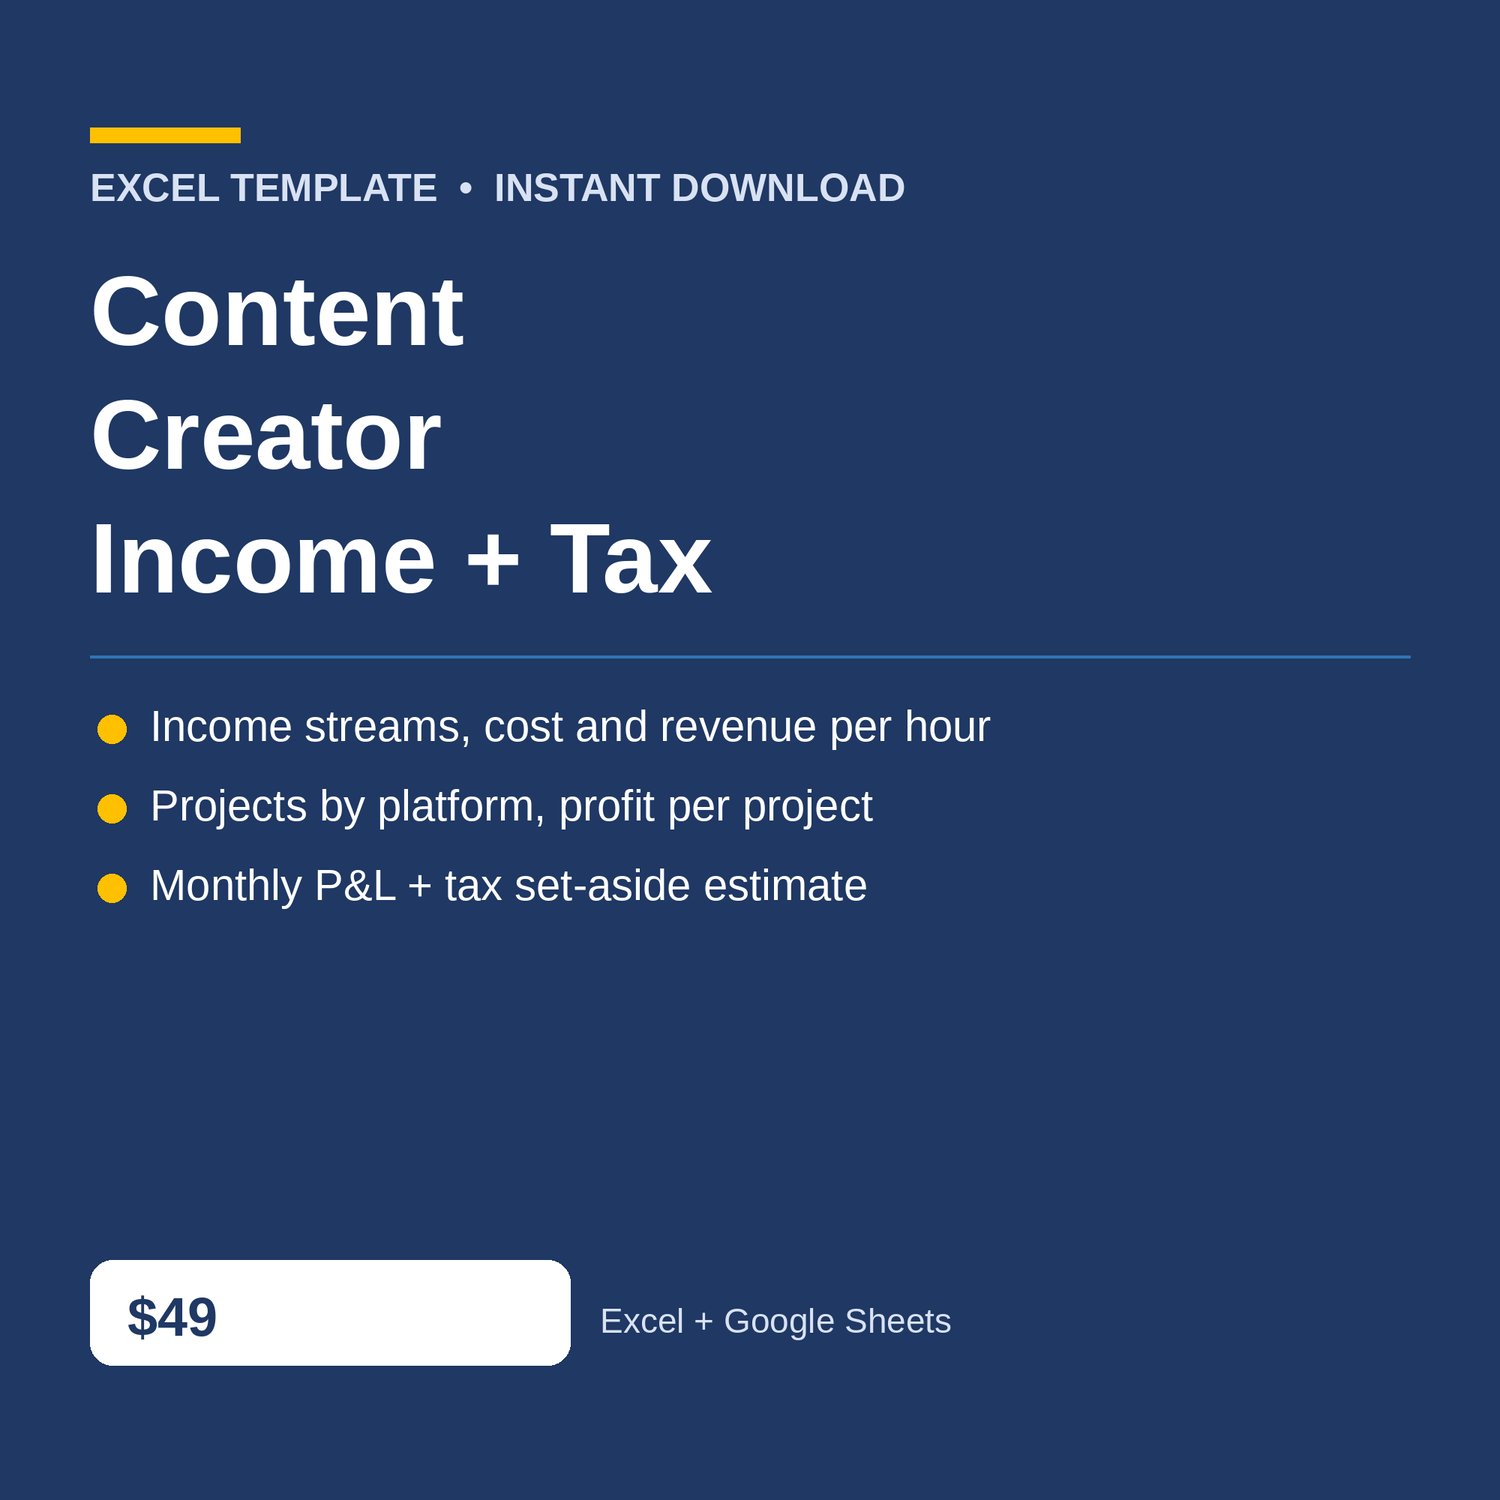
Content Creator Income and Tax Tracker Excel for creators — income streams and rates per hour, project profit by platform, gear inventory, a monthly P and L dashboard, and a tax set-aside planning estimate. Know what every hour of creating actually earns — and what to set aside before tax time.
Built for YouTubers, podcasters, streamers, and social creators who need to know, content type by content type and project by project, whether the revenue per hour covers production, editing, and rent share — without accounting software. If a content type is losing money, this workbook shows it before you make the next one.
WHAT'S INCLUDED (6 sheets):
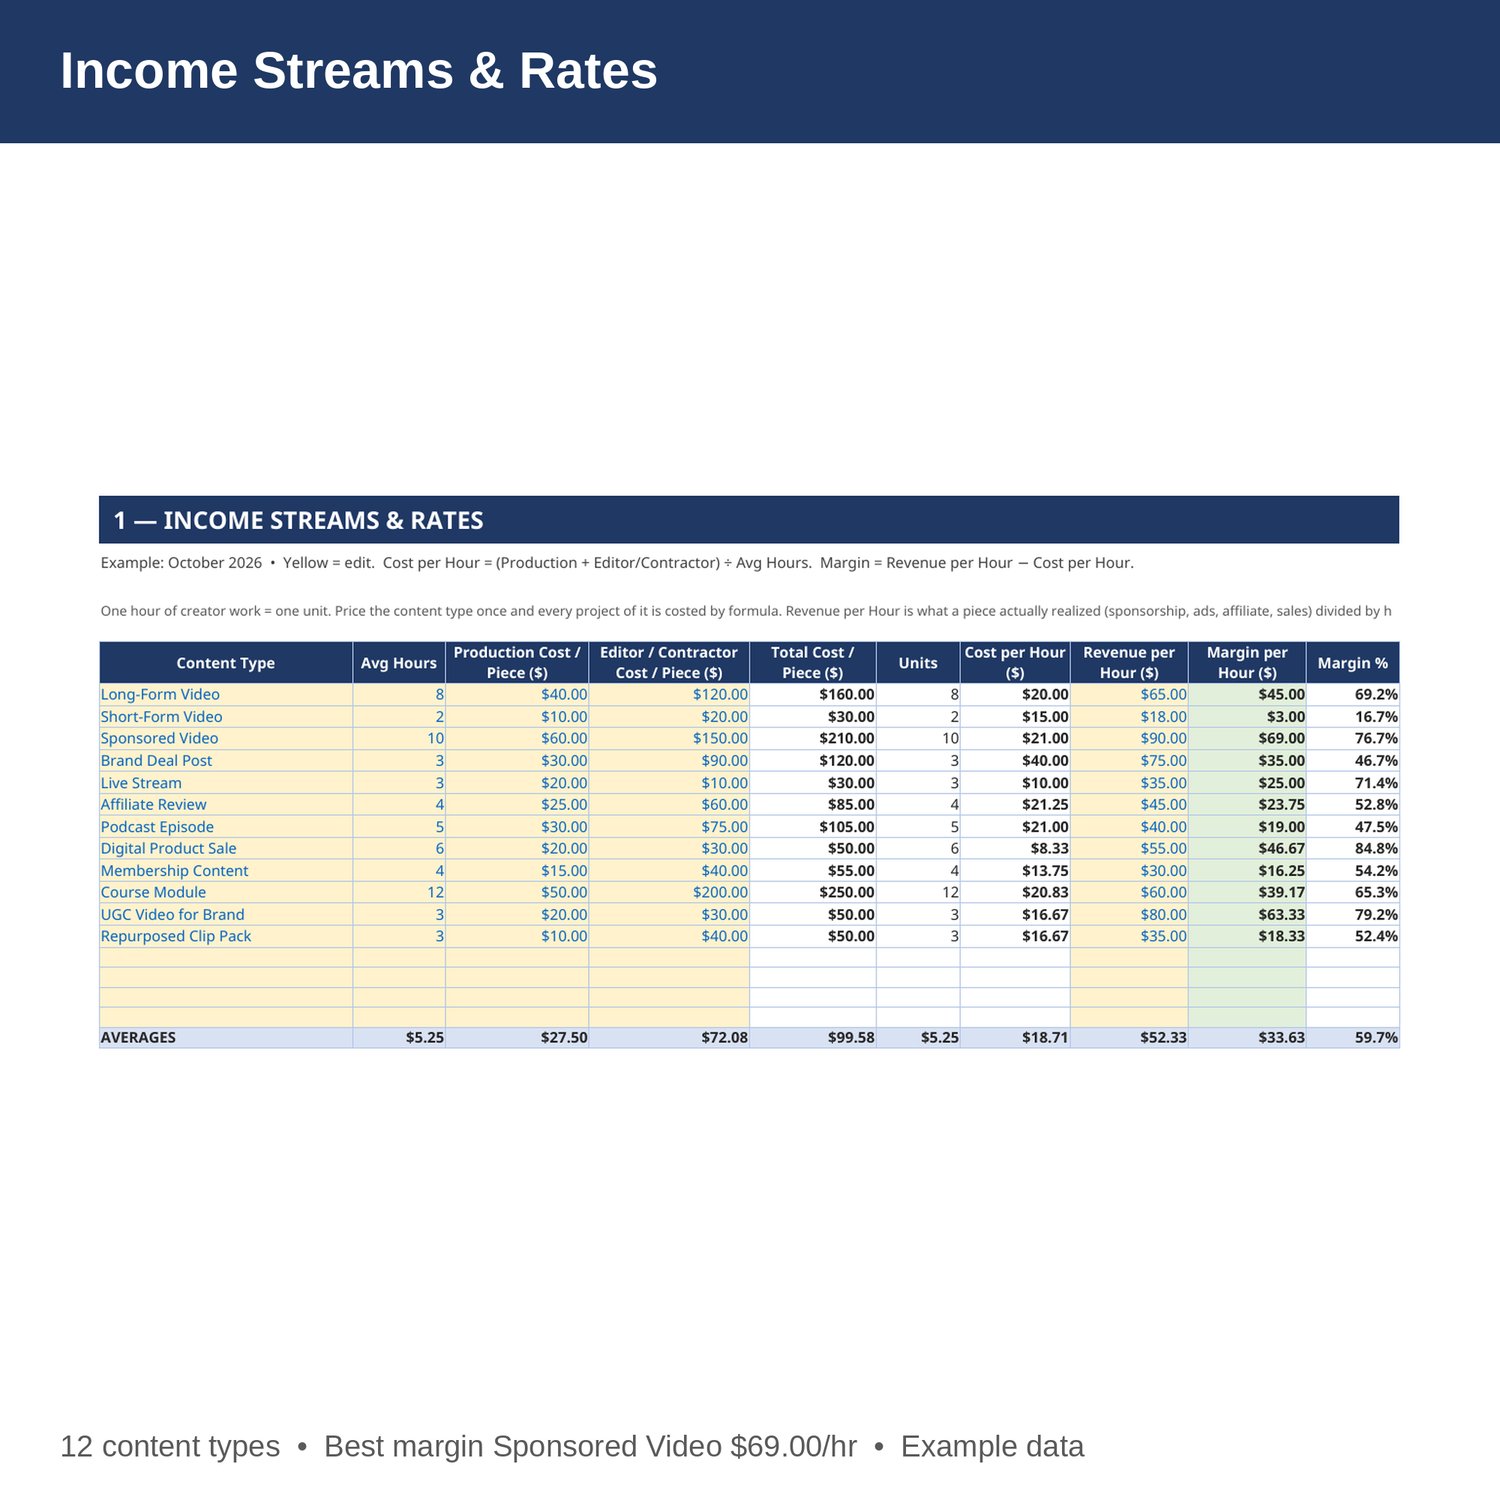
- Income Streams and Rates — average hours per piece, production cost and editor or contractor cost per piece, cost per hour, realized revenue per hour, and margin in dollars and percent for every content type. Change a cost and every project profit updates by formula.
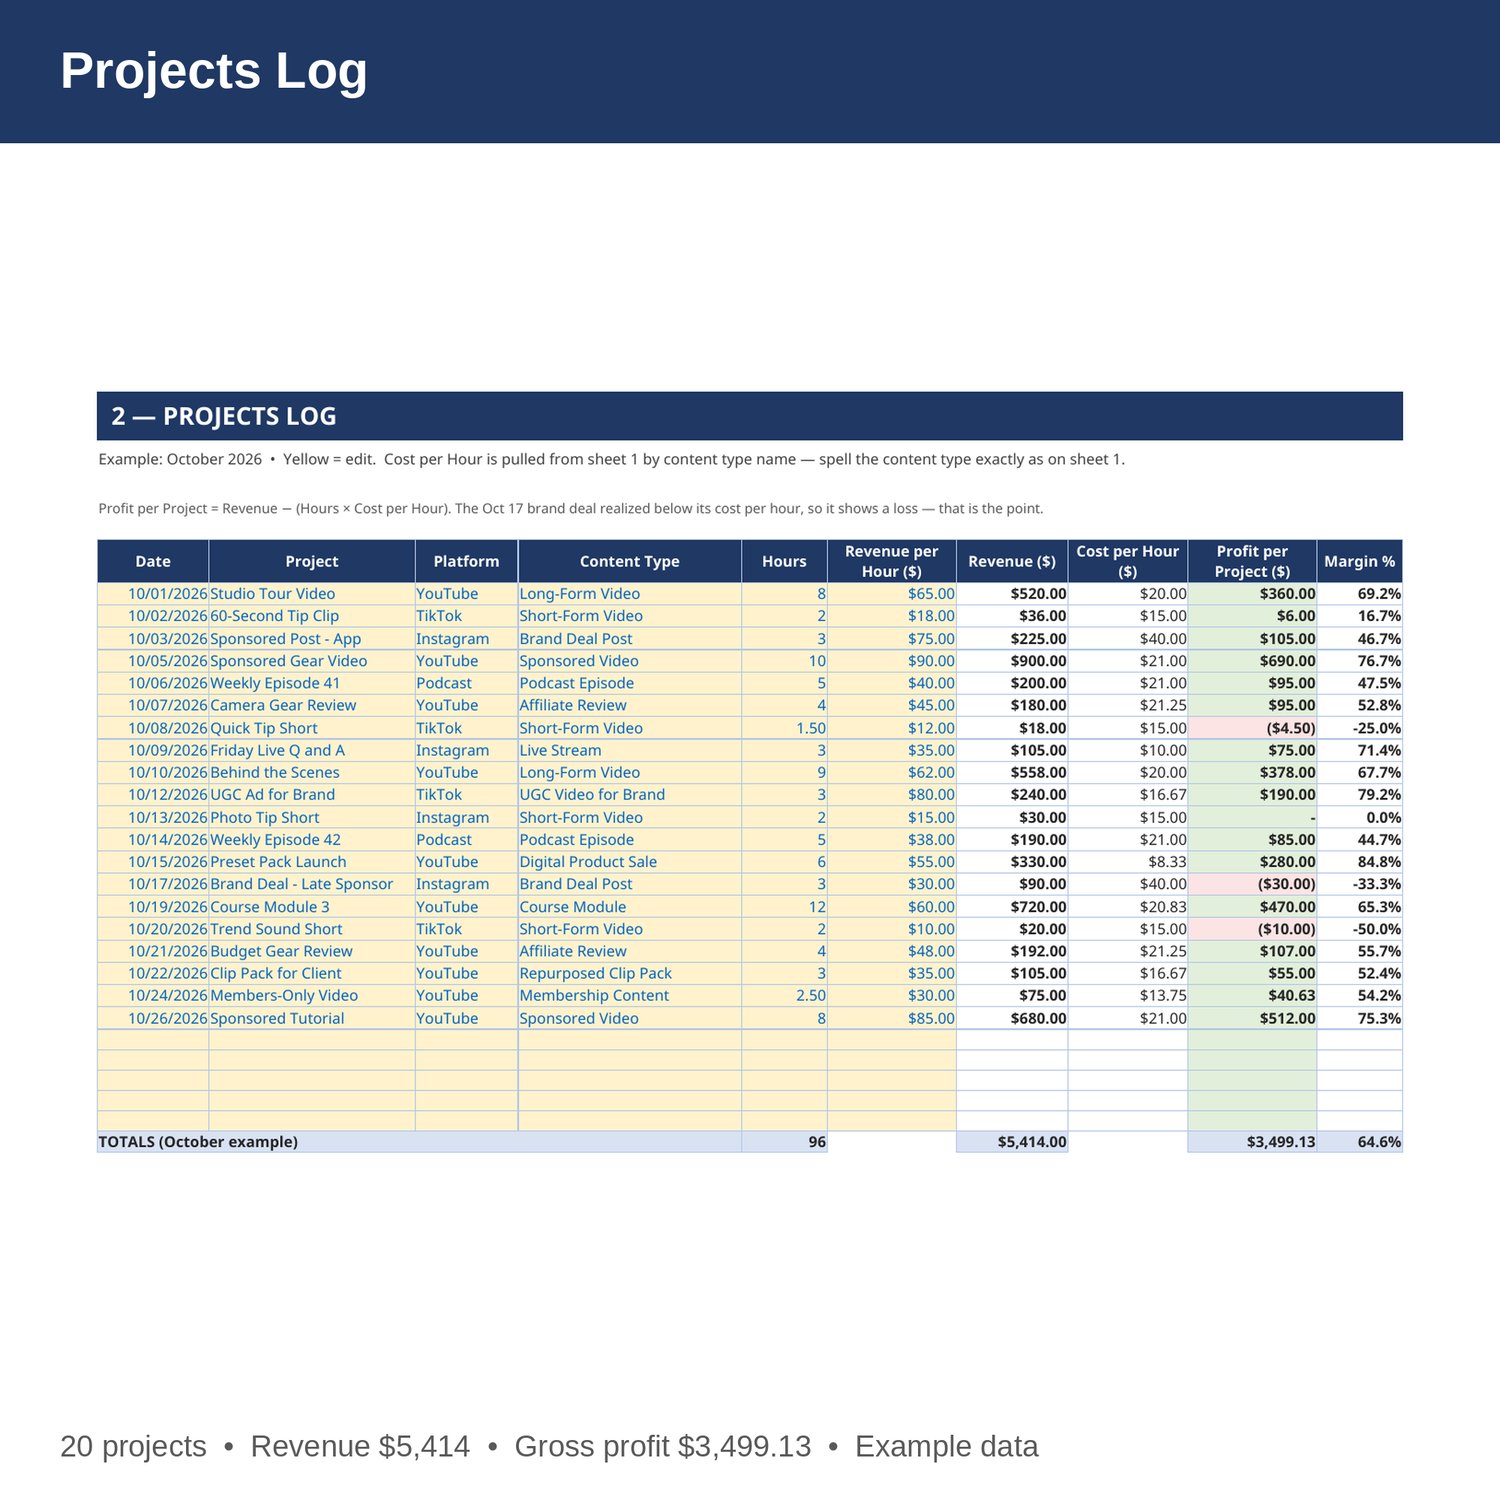
- Projects Log — date, project, platform, content type, hours worked, realized revenue per hour, revenue, cost per hour pulled from the rates sheet, profit per project, and margin. Log long-form, shorts, sponsored work, brand deals, and live streams in one place.
- Gear and Supplies — supply, unit, quantity on hand, reorder point, cost per unit, and stock value. Anything at or below its reorder point is flagged LOW STOCK so you buy it before the next shoot.
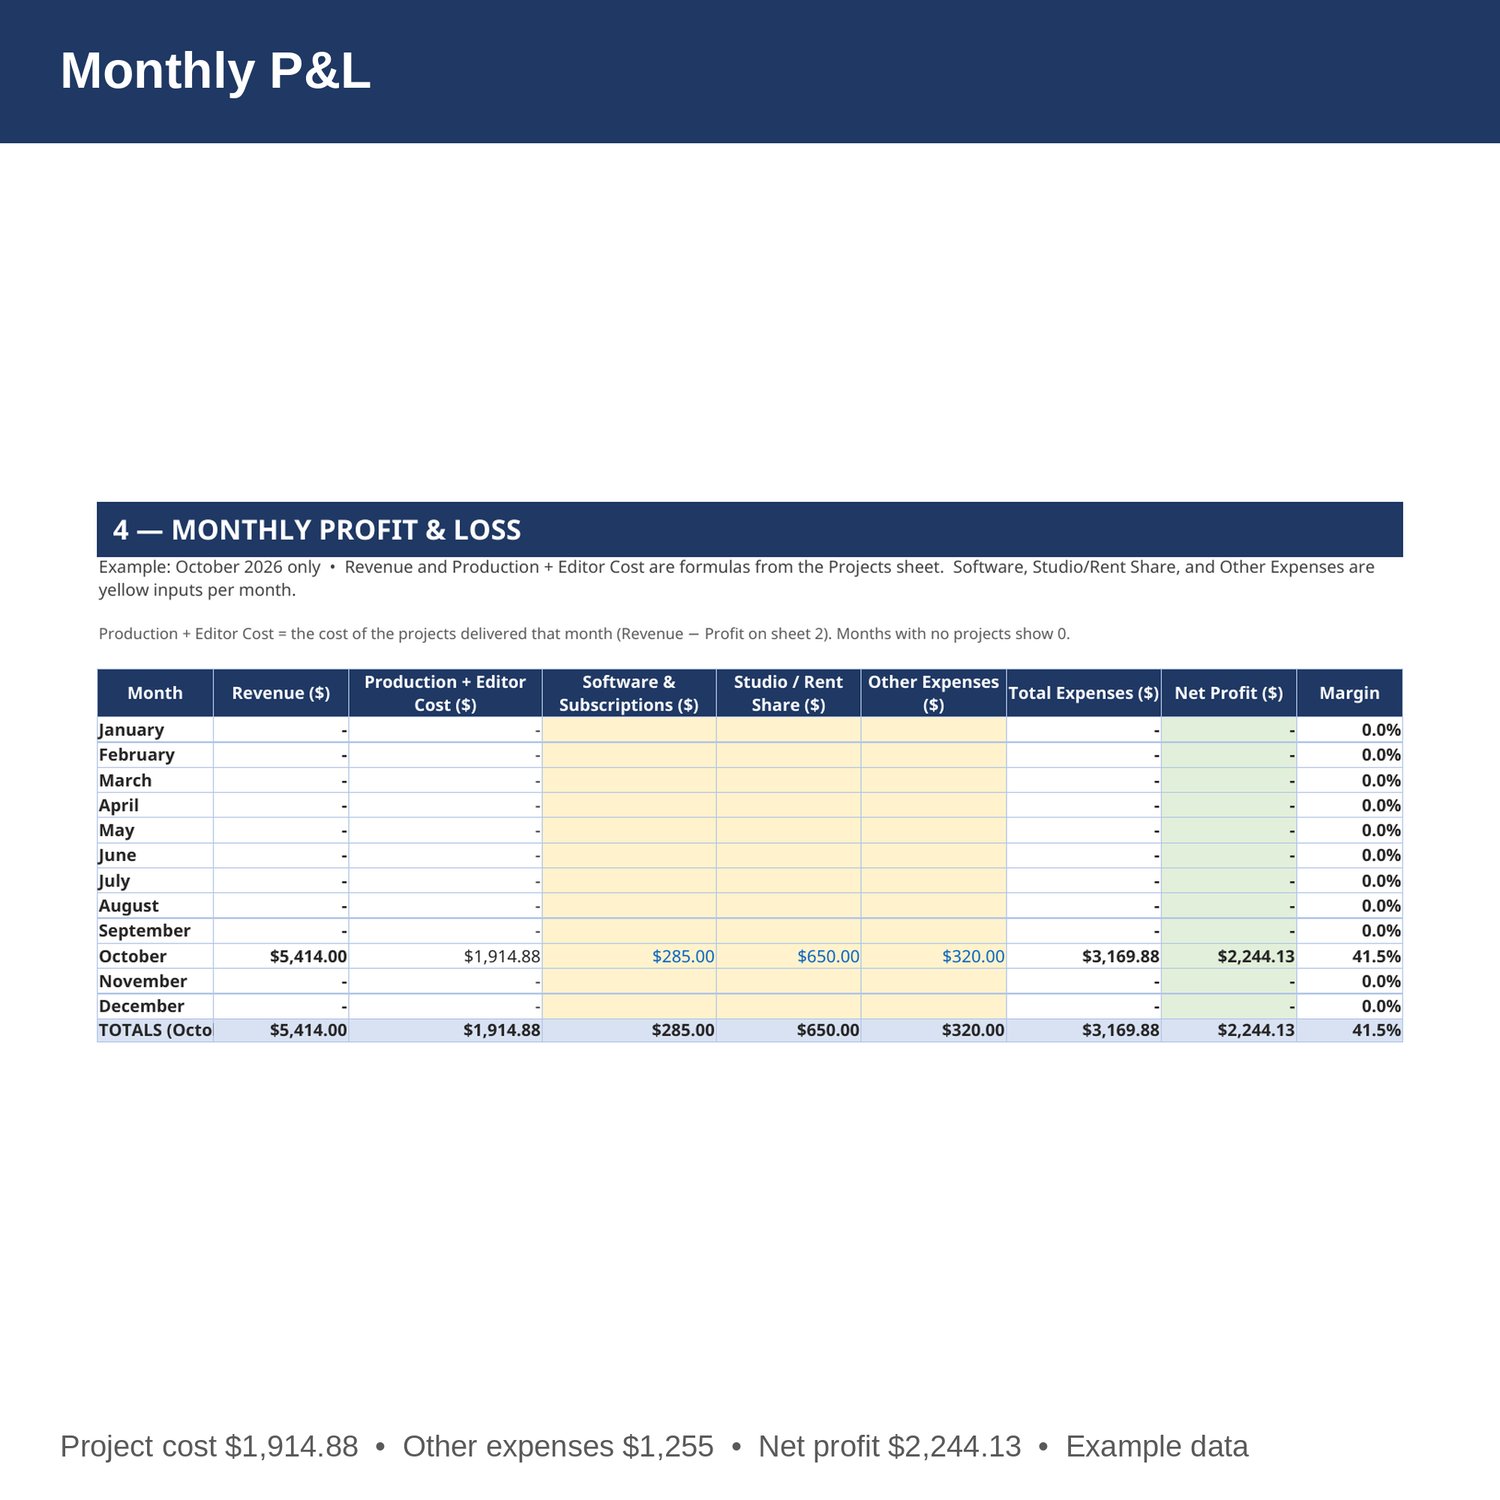
- Monthly P and L — revenue, production and editor cost, software and subscriptions, studio or rent share, and other expenses by month, Jan-Dec, with net profit and margin. Revenue and project cost are formulas from the Projects sheet.
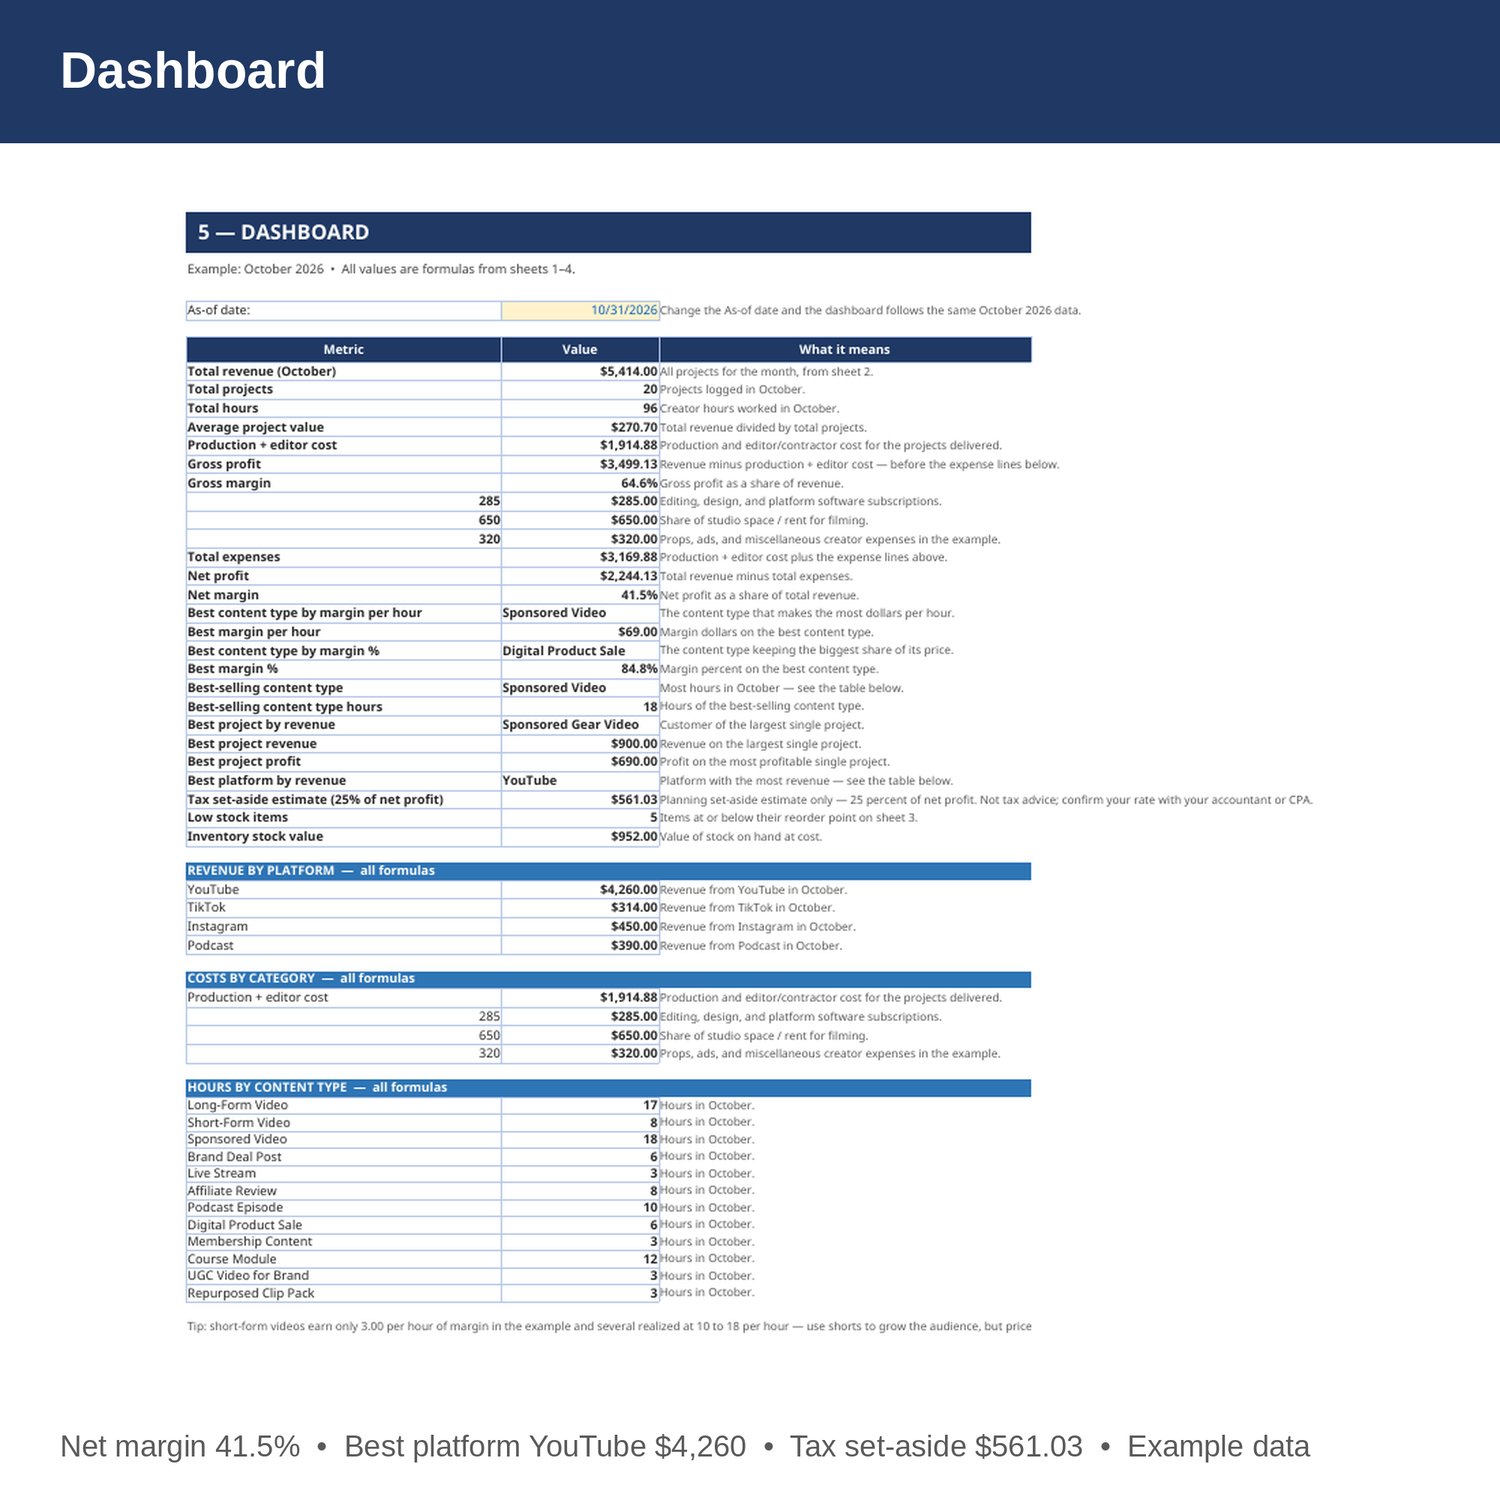
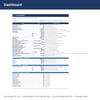
- Dashboard — total revenue, projects, hours, average project value, gross and net profit and margin, best content type by margin per hour and by margin percent, best-selling content type, best project and best platform, costs by category, low stock count, and a tax set-aside planning estimate of 25 percent of net profit.
- Cover and How to Use — start here. Yellow cells are the only ones you edit.
EXAMPLE DATA (October 2026 — replace with your own numbers):
- Total revenue 5,414 from 20 projects and 96 hours; average project value 270.70.
- Production plus editor cost 1,914.88; gross profit 3,499.13; gross margin 64.6 percent.
- Software and subscriptions 285, studio or rent share 650, other expenses 320; total expenses 3,169.88; net profit 2,244.13; net margin 41.5 percent.
- Tax set-aside planning estimate: 25 percent of net profit, 561.03 in the example. A planning estimate only, not tax advice.
- Revenue by platform: YouTube 4,260 (best), Instagram 450, Podcast 390, TikTok 314.
- Best content type by margin per hour: Sponsored Video, margin 69.00 per hour. Best by margin percent: Digital Product Sale, 84.8 percent (cost 8.33 per hour, revenue 55 per hour).
- Best-selling content type: Sponsored Video, 18 hours. Next: Long-Form Video 17, Course Module 12.
- Best project: Sponsored Gear Video, October 5, Sponsored Video x10 hours — revenue 900, profit 690.
- Inventory example: stock value 952, with 5 items at or below their reorder point — SD Memory Cards 128GB, AA Batteries, LED Light Bulbs, USB-C Cables, and Ring Light Bulbs.
HOW IT WORKS:
1. Download the Excel file instantly after purchase.
2. On sheet 1, enter each content type's average hours per piece, production cost per piece, editor or contractor cost per piece, and realized revenue per hour. Cost per hour and margin fill in by formula.
3. On sheet 2, log every project: date, project, platform, content type (spelled exactly as on sheet 1), hours, and realized revenue per hour. Revenue, cost per hour, and profit fill in by formula.
4. On sheet 3, keep quantities on hand current and set a reorder point for each supply. Buy more of anything flagged LOW STOCK before the next shoot.
5. On sheet 4, enter software, studio or rent share, and other expenses each month, then check gross and net profit and the tax set-aside estimate on the Dashboard.
HOW THE NUMBERS WORK:
Cost per hour is (production cost per piece plus editor or contractor cost per piece) divided by average hours per piece. Margin per hour is revenue per hour minus cost per hour. Margin percent is margin per hour divided by revenue per hour. Gross profit is revenue minus production and editor cost; net profit is revenue minus production and editor cost, software, studio or rent share, and other expenses. One hour of creator work is one unit. The tax set-aside is 25 percent of net profit, shown as a planning estimate only.
WHO IT'S FOR:
YouTubers, TikTok and Instagram creators, podcasters, streamers, and course creators who want income by stream, project profit, gear inventory, and a monthly P and L in one workbook — without accounting software.
PLEASE NOTE:
- This is a digital download. No physical item will be shipped.
- Works in Microsoft Excel and Google Sheets (upload to Google Drive to open in Sheets).
- Example data for October 2026 is included (12 content types, 20 projects, 96 hours, 4 platforms, 12 supplies). Replace it with your own numbers.
- The example is honest about the weak spots: short-form videos earn very little per hour — only 3.00 of margin per hour on sheet 1, and several October shorts realized at just 10 to 18 per hour — one brand deal on October 17 realized at 30 per hour against a 40.00 cost per hour and lost money, and one sponsor payment in the example arrived late, after the video posted.
- This is a bookkeeping and planning tool only, not tax, legal, or CPA advice. The tax set-aside is a planning estimate only.
- Due to the nature of digital downloads, refunds are not available. Message me before buying if you have a question.
Built by an accountant: B.S. Accountancy, ASU W. P. Carey, with revenue-reconciliation experience at Marriott and audit work at PwC.