

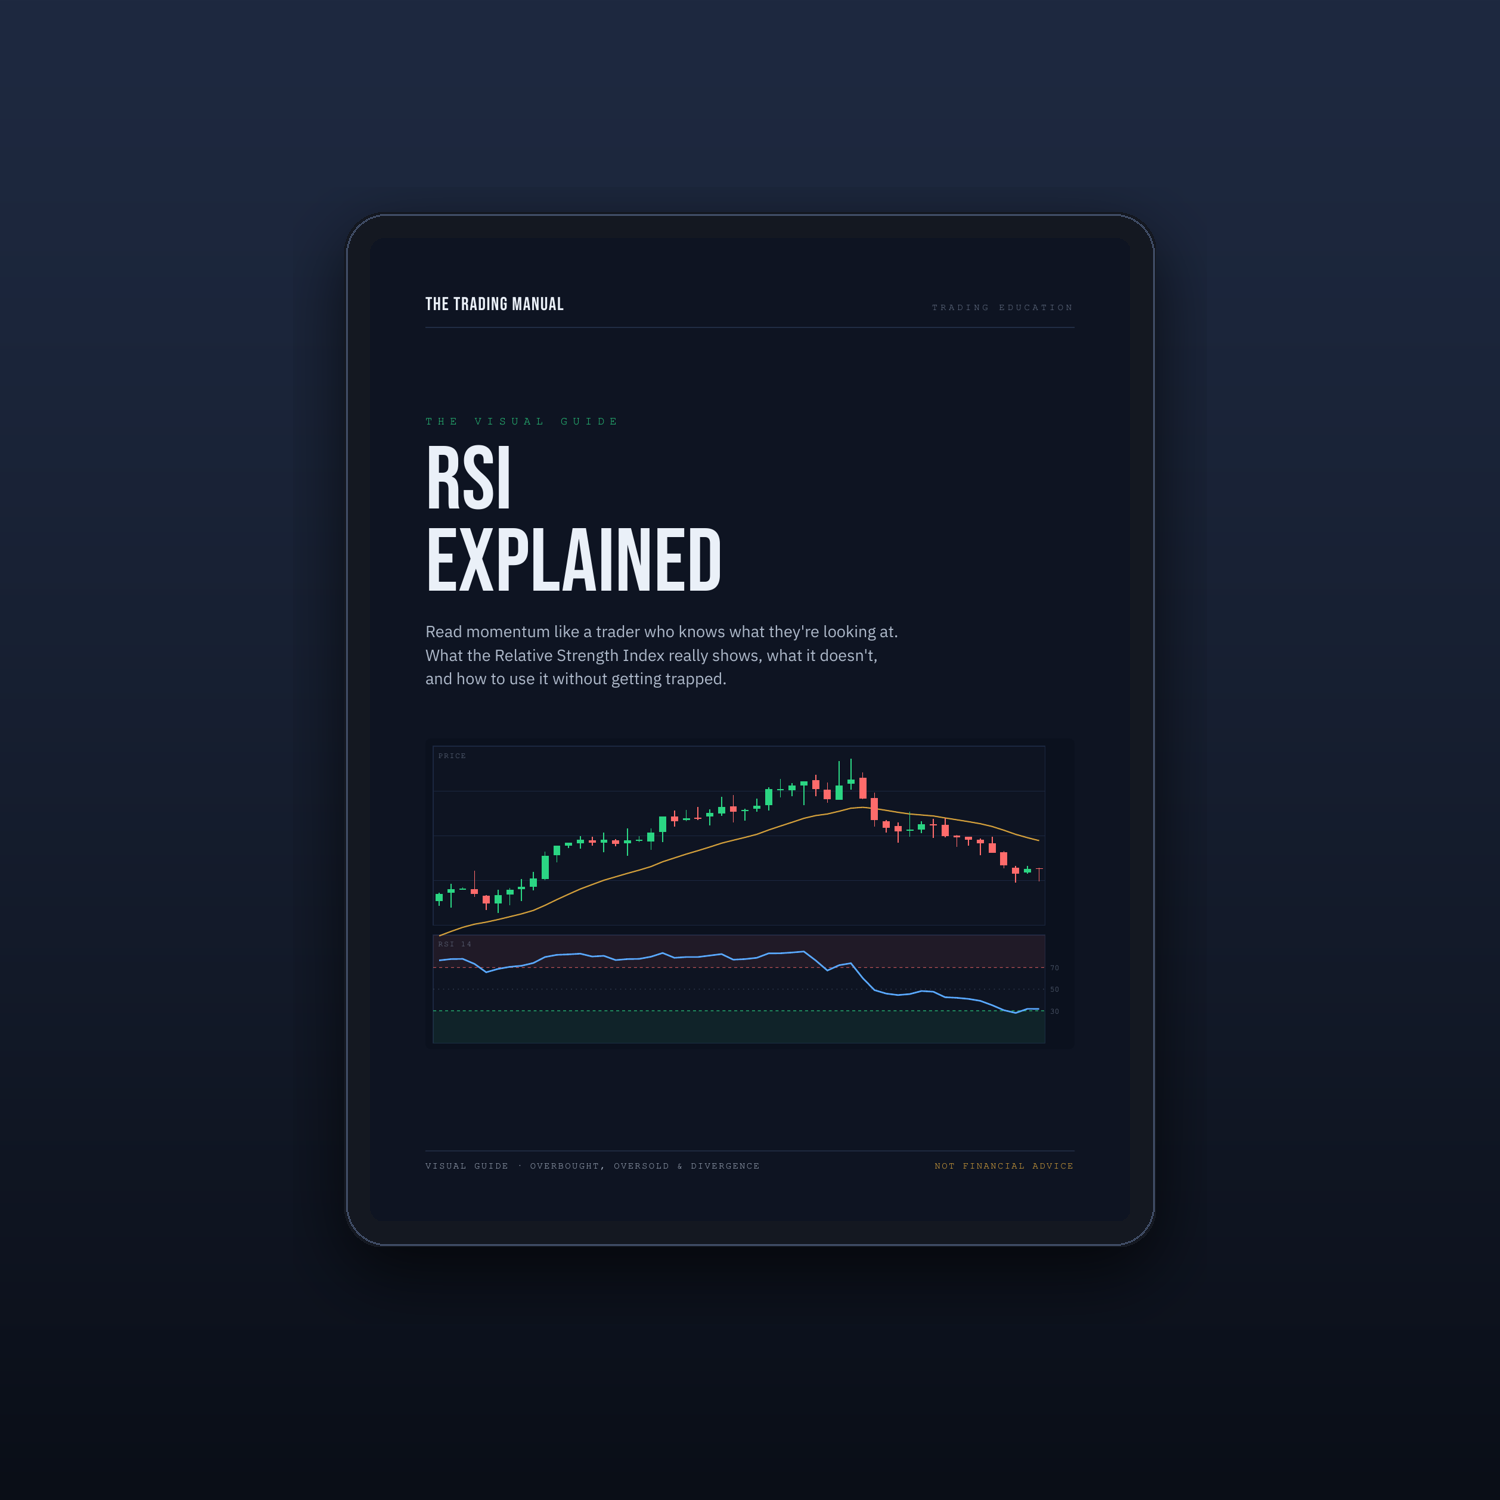





RSI Explained — Overbought, Oversold & Divergence (Visual Guide)
You bought because RSI said "oversold," and price kept falling anyway. The Relative Strength Index is the most popular indicator in trading, and the most misread. Most people treat it like a buy and sell button. It was never meant to be one.
This visual guide fixes that. In 16 clean pages you will learn what RSI is actually telling you, so you stop fighting trends and start reading momentum the way it is meant to be read.
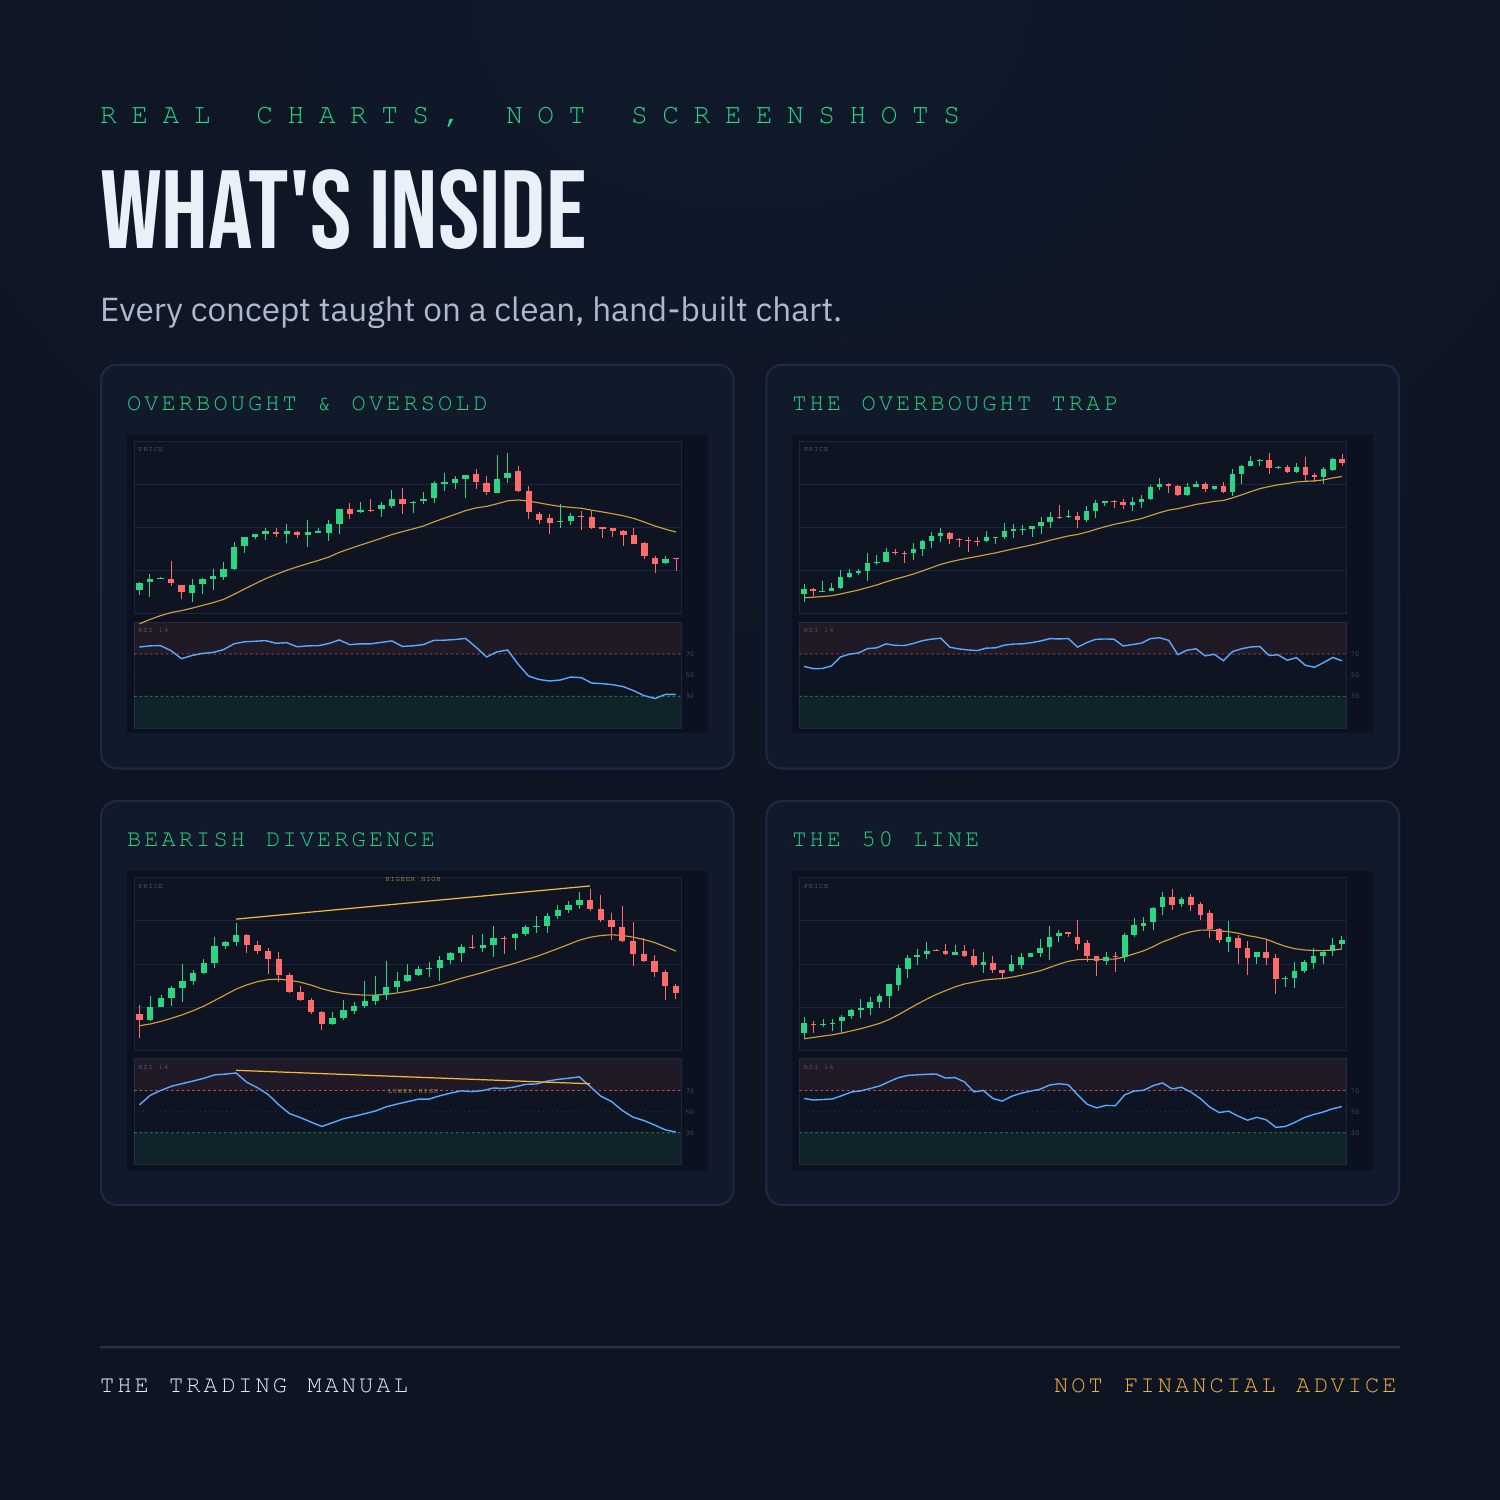
Every concept is taught on a real, hand-built chart, not a blurry screenshot. You will see the overbought and oversold zones, the trap that catches most traders, the hidden 50 line that reads the trend, and both kinds of divergence. It finishes with a one-page quick reference you can keep right next to your charts.
What's inside:
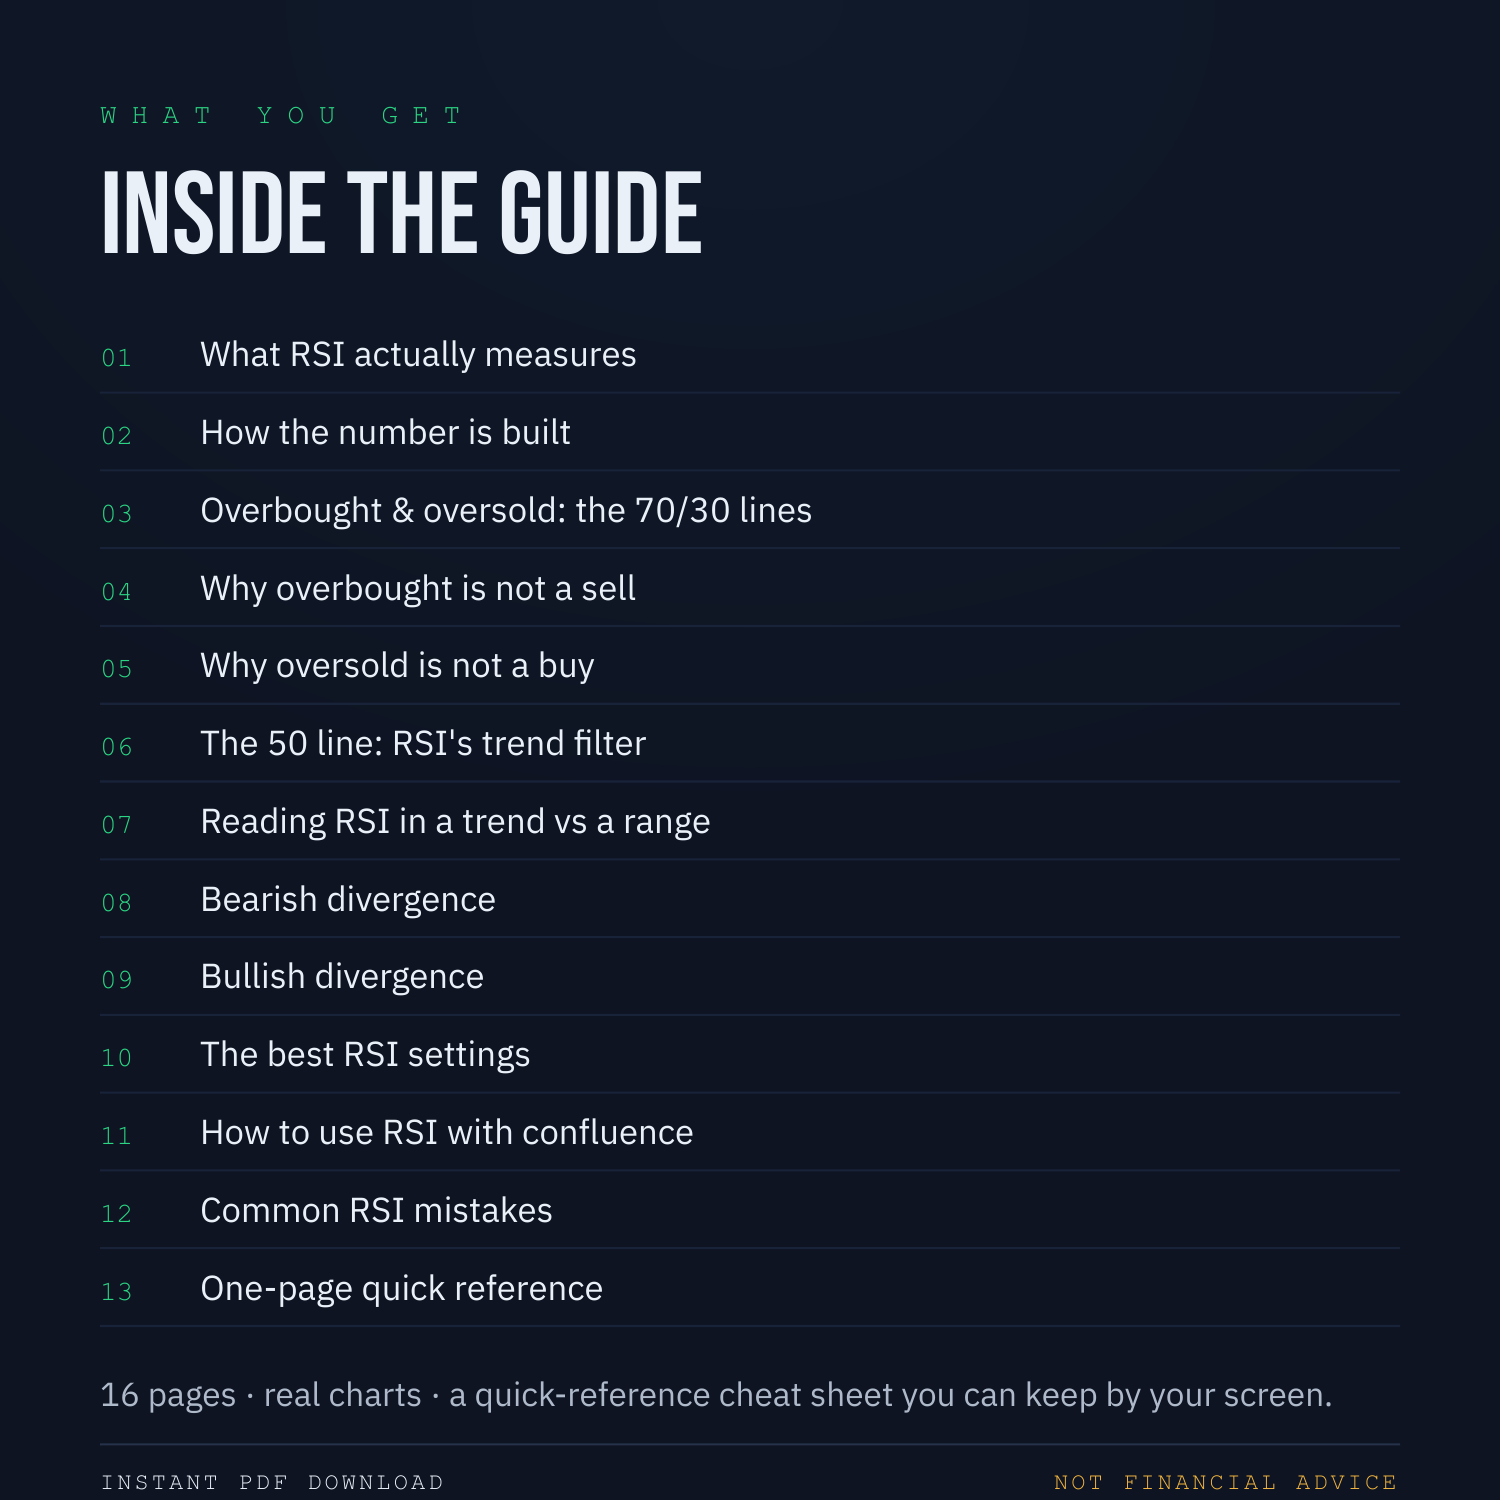
- What RSI really measures, and the 70 / 30 levels explained simply
- Why overbought is not a sell and oversold is not a buy
- The 50 line as a trend filter most traders never use
- Bearish and bullish divergence, shown step by step
- The best settings, confluence, common mistakes, and a cheat sheet
What you'll be able to do:
- Read RSI at a glance and know what it is telling you
- Spot when a reading is a trap instead of a signal
- Use RSI to confirm your read instead of guessing
RSI is a clue, not a crystal ball. This guide is educational, not financial advice.
Instant PDF download. Pairs perfectly with the MACD and Moving Averages guides in the store.