
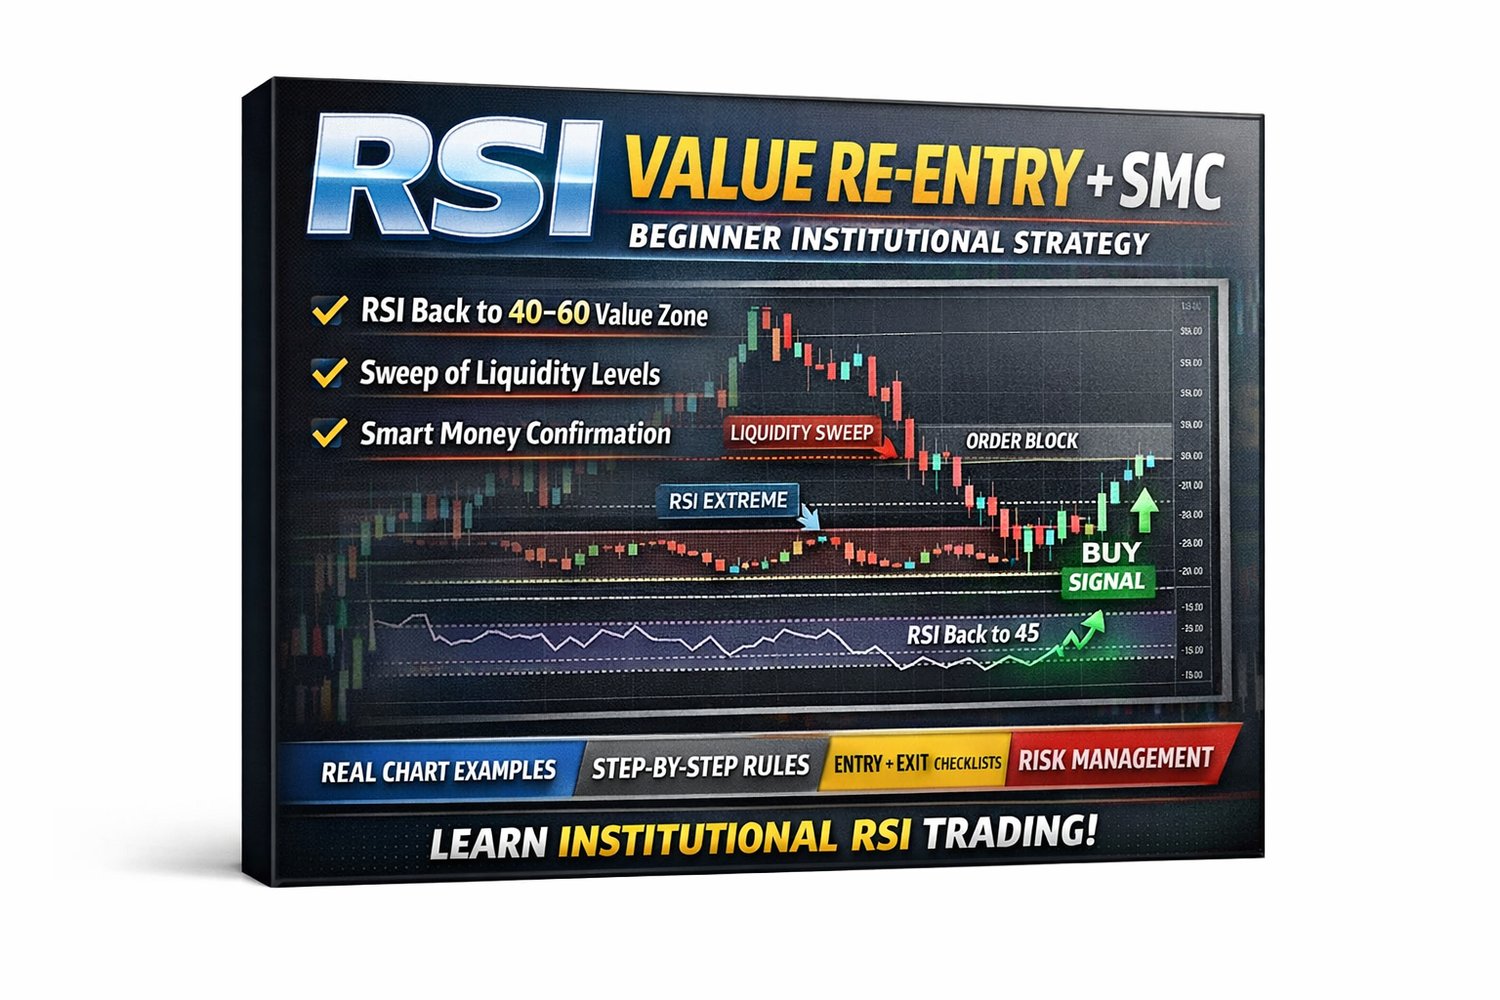
RSI VALUE RE-ENTRY + SMART MONEY CONCEPT (SMC) A Beginner-Friendly Institutional Trading Strategy
📘
RSI VALUE RE-ENTRY + SMART MONEY CONCEPT (SMC)
A Beginner-Friendly Institutional Trading Strategy
Simple but professional


⚠️ DISCLAIMER
This material is for educational purposes only.
Trading involves risk. Always use proper risk management and trade with money you can afford to lose.
📌 WHO THIS STRATEGY IS FOR
- Beginners confused by indicators
- Traders who misuse RSI (30/70 only)
- Traders who want simple + professional logic
- Anyone learning Smart Money Concepts
🧠 STRATEGY OVERVIEW (SIMPLE IDEA)
Institutions do not buy at RSI oversold or sell at RSI overbought.
They:
- Push price away from value
- Trigger fear or greed
- Enter when price returns to value
👉 RSI shows value
👉 SMC shows where manipulation happens
This strategy combines both.
📊 INDICATOR SETUP
Required Tools
- RSI (14)
- Market structure (manual – no indicator)
RSI Levels Used
- 20 → Extreme oversold
- 40 → Bullish support
- 60 → Bearish resistance
- 80 → Extreme overbought
📌 Forget 30 / 70 – professionals use 40 / 60
⏱️ TIMEFRAME RULES
- Bias: 1H or 4H
- Entry: 5m or 15m
- Best Sessions: London & New York
STEP 1️⃣ – HTF RSI BIAS (DIRECTION FILTER)
Rule
- RSI above 40 → Only BUY setups
- RSI below 60 → Only SELL setups
- RSI inside 40–60 → NO TRADE
📊 REAL CHART EXAMPLE – BULLISH BIAS


Explanation
- RSI keeps bouncing above 40
- Market is healthy bullish
- We ignore all sell ideas
STEP 2️⃣ – LIQUIDITY SWEEP (THE MANIPULATION)
What Is a Liquidity Sweep?
Price moves:
- Below previous lows (sell-side liquidity)
- Above previous highs (buy-side liquidity)
This is done to:
- Trigger stop losses
- Trap emotional traders
📉 REAL CHART EXAMPLE – LIQUIDITY SWEEP


📌 Important:
A sweep is not an entry, it is a warning
STEP 3️⃣ – RSI EXTREME (EMOTION PHASE)
After the sweep:
- RSI moves toward 20–30 (fear)
- Or 70–80 (greed)
This shows:
Retail traders are emotional
📊 REAL CHART EXAMPLE – RSI EXTREME


⚠️ Extreme RSI = No entry yet
STEP 4️⃣ – RSI VALUE RE-ENTRY (KEY SIGNAL)
This Is the CORE of the Strategy
After extreme:
- RSI must return back into 40–60
- This means price is returning to fair value
📌 Institutions enter here.
📈 REAL CHART EXAMPLE – RSI VALUE RETURN

STEP 5️⃣ – SMC CONFIRMATION (ENTRY SAFETY)
Only enter if RSI value re-entry happens near:
- Previous strong support or resistance
- Order block area
- Strong rejection candle zone
📌 REAL CHART EXAMPLE – SMC CONFIRMATION


🟢 COMPLETE BUY SETUP (CHECKLIST)
✔ HTF RSI above 40
✔ Price sweeps sell-side liquidity
✔ RSI drops near 20–30
✔ RSI returns into 40–60
✔ Bullish candle forms
📈 Entry: Bullish candle close
🛑 Stop Loss: Below sweep low
🎯 Targets:
- Previous high
- Buy-side liquidity
🔴 COMPLETE SELL SETUP (CHECKLIST)
✔ HTF RSI below 60
✔ Price sweeps buy-side liquidity
✔ RSI rises near 70–80
✔ RSI returns into 40–60
✔ Bearish candle forms
📉 Entry: Bearish candle close
🛑 Stop Loss: Above sweep high
🎯 Targets:
- Previous low
- Sell-side liquidity
📏 RISK MANAGEMENT (IMPORTANT)
- Risk 1% per trade
- Minimum 1:2 Risk–Reward
- Move stop to breakeven after TP1
📌 One good trade > many random trades
❌ COMMON BEGINNER MISTAKES
- Trading RSI extremes directly
- Ignoring HTF bias
- Trading during low volume
- Over-leveraging
🧠 QUICK RECAP (ONE PAGE SUMMARY)
Sweep → RSI Extreme → RSI Value Re-Entry → Structure Confirmation → Trade
🏆 WHY THIS STRATEGY WORKS
✔ RSI used professionally
✔ Clear logic
✔ Works across markets
✔ Beginner-friendly
✔ Institutional mindset
🔥 FINAL NOTE
This strategy teaches you WHEN NOT TO TRADE, which is more powerful than entering trades.
Download proven RSI + SMC trading strategies from my store...
is: https://payhip.com/DIGITALCREATIONWORLD