






Supply & Demand Zones Explained — Measured (PDF Guide)
You have been taught two things that look identical on a chart and are given completely different names. A supply zone and a bearish order block are drawn the same way, on the same candle, for the same reason - and one of them comes with a condition the other does not. Nobody tells you whether that condition is worth anything.
Both rules were run over the same 35,944 bars and the results compared directly. That comparison does not appear to exist anywhere else, and it settles the question in one table: they find the same object, one of them finds far fewer of them, and the ones it discards behave no differently. This is a 40-page PDF that teaches Supply & Demand Zones from the first thing you see on the screen through to a written strategy with an entry, a stop and an explicit rule for when the trade is wrong.
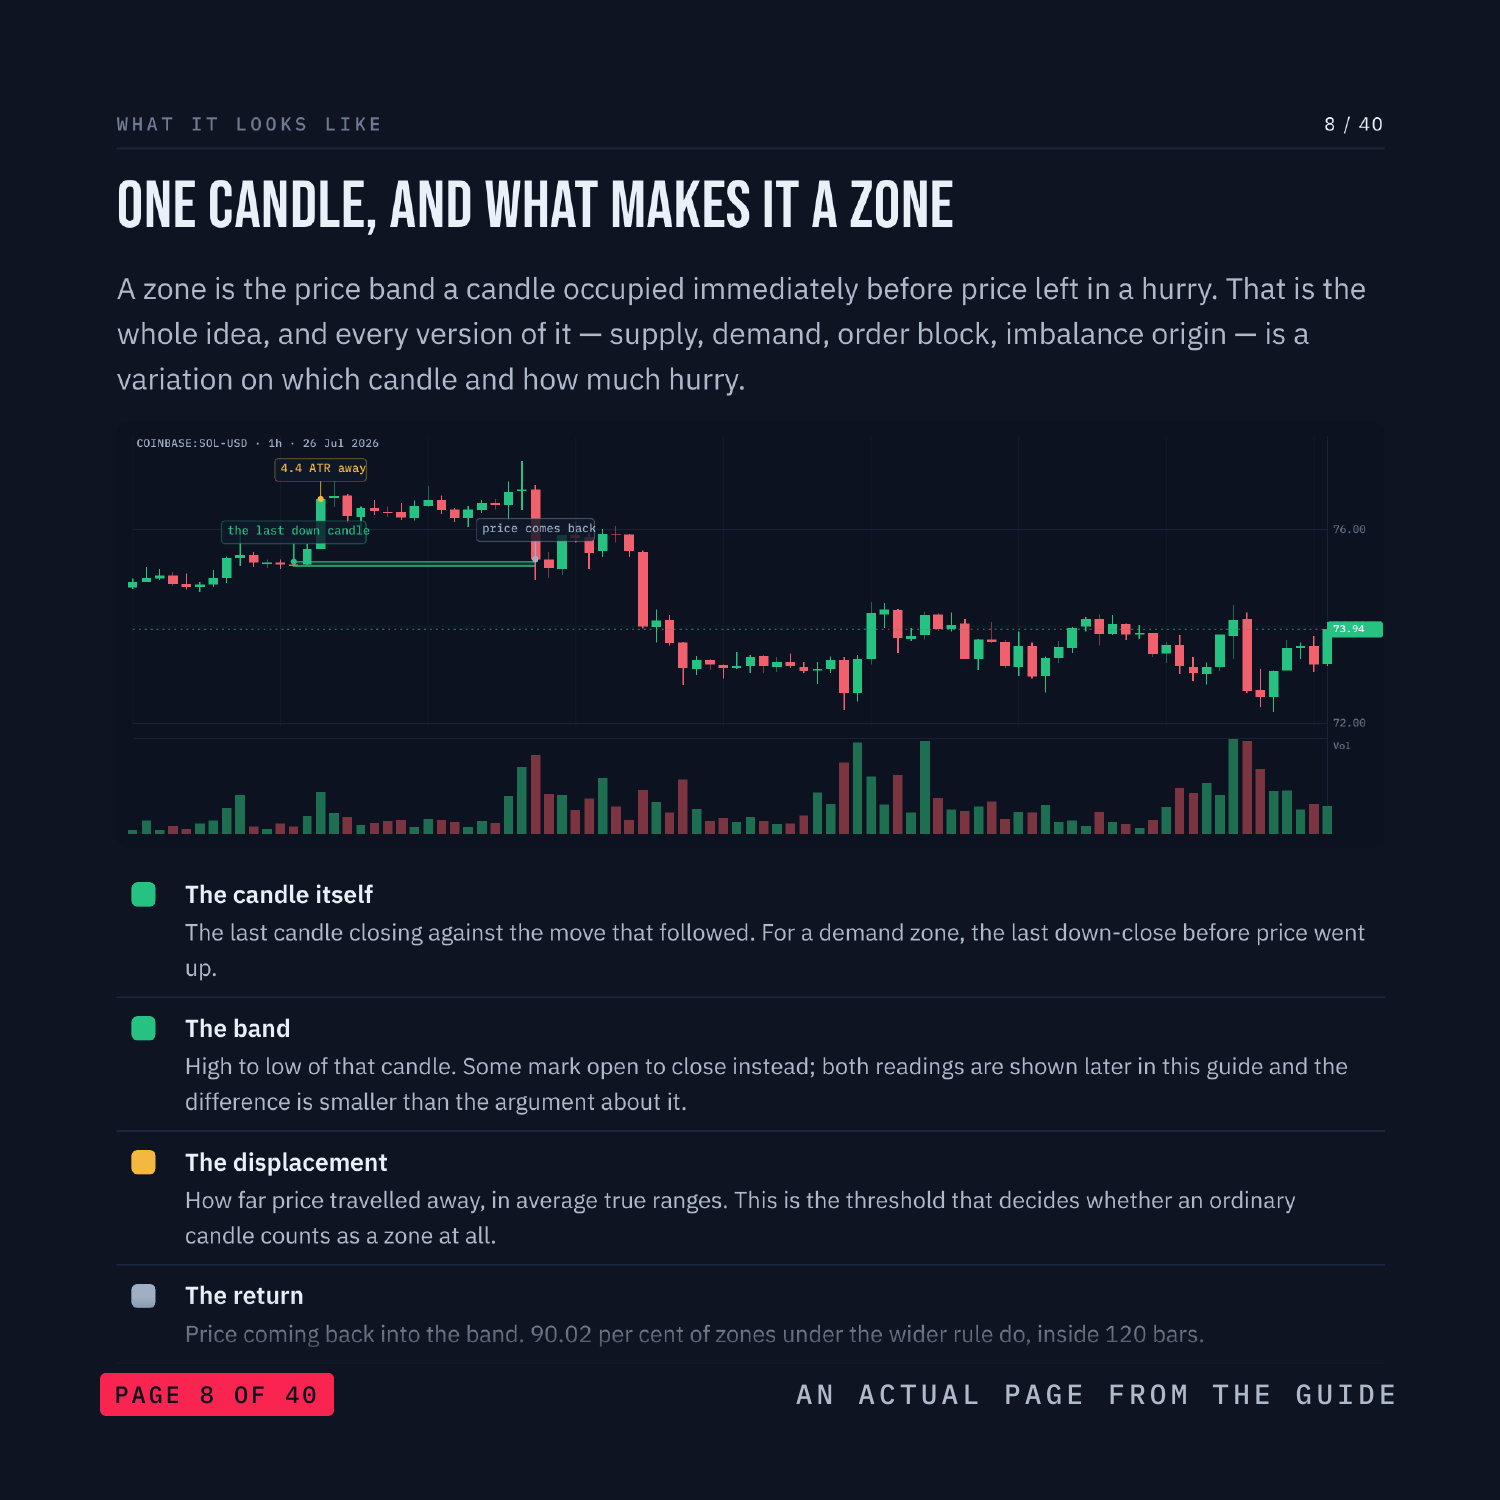
Nothing is taught underneath a chart. Every label sits on the candle, the line or the level it is describing, on real BTC, ETH, SOL and LINK charts. There are three quizzes on real charts, each followed by the same chart re-shown annotated with the reasoning, plus faded practice pages where the first steps are filled in and you finish the rest.
WHAT'S INSIDE
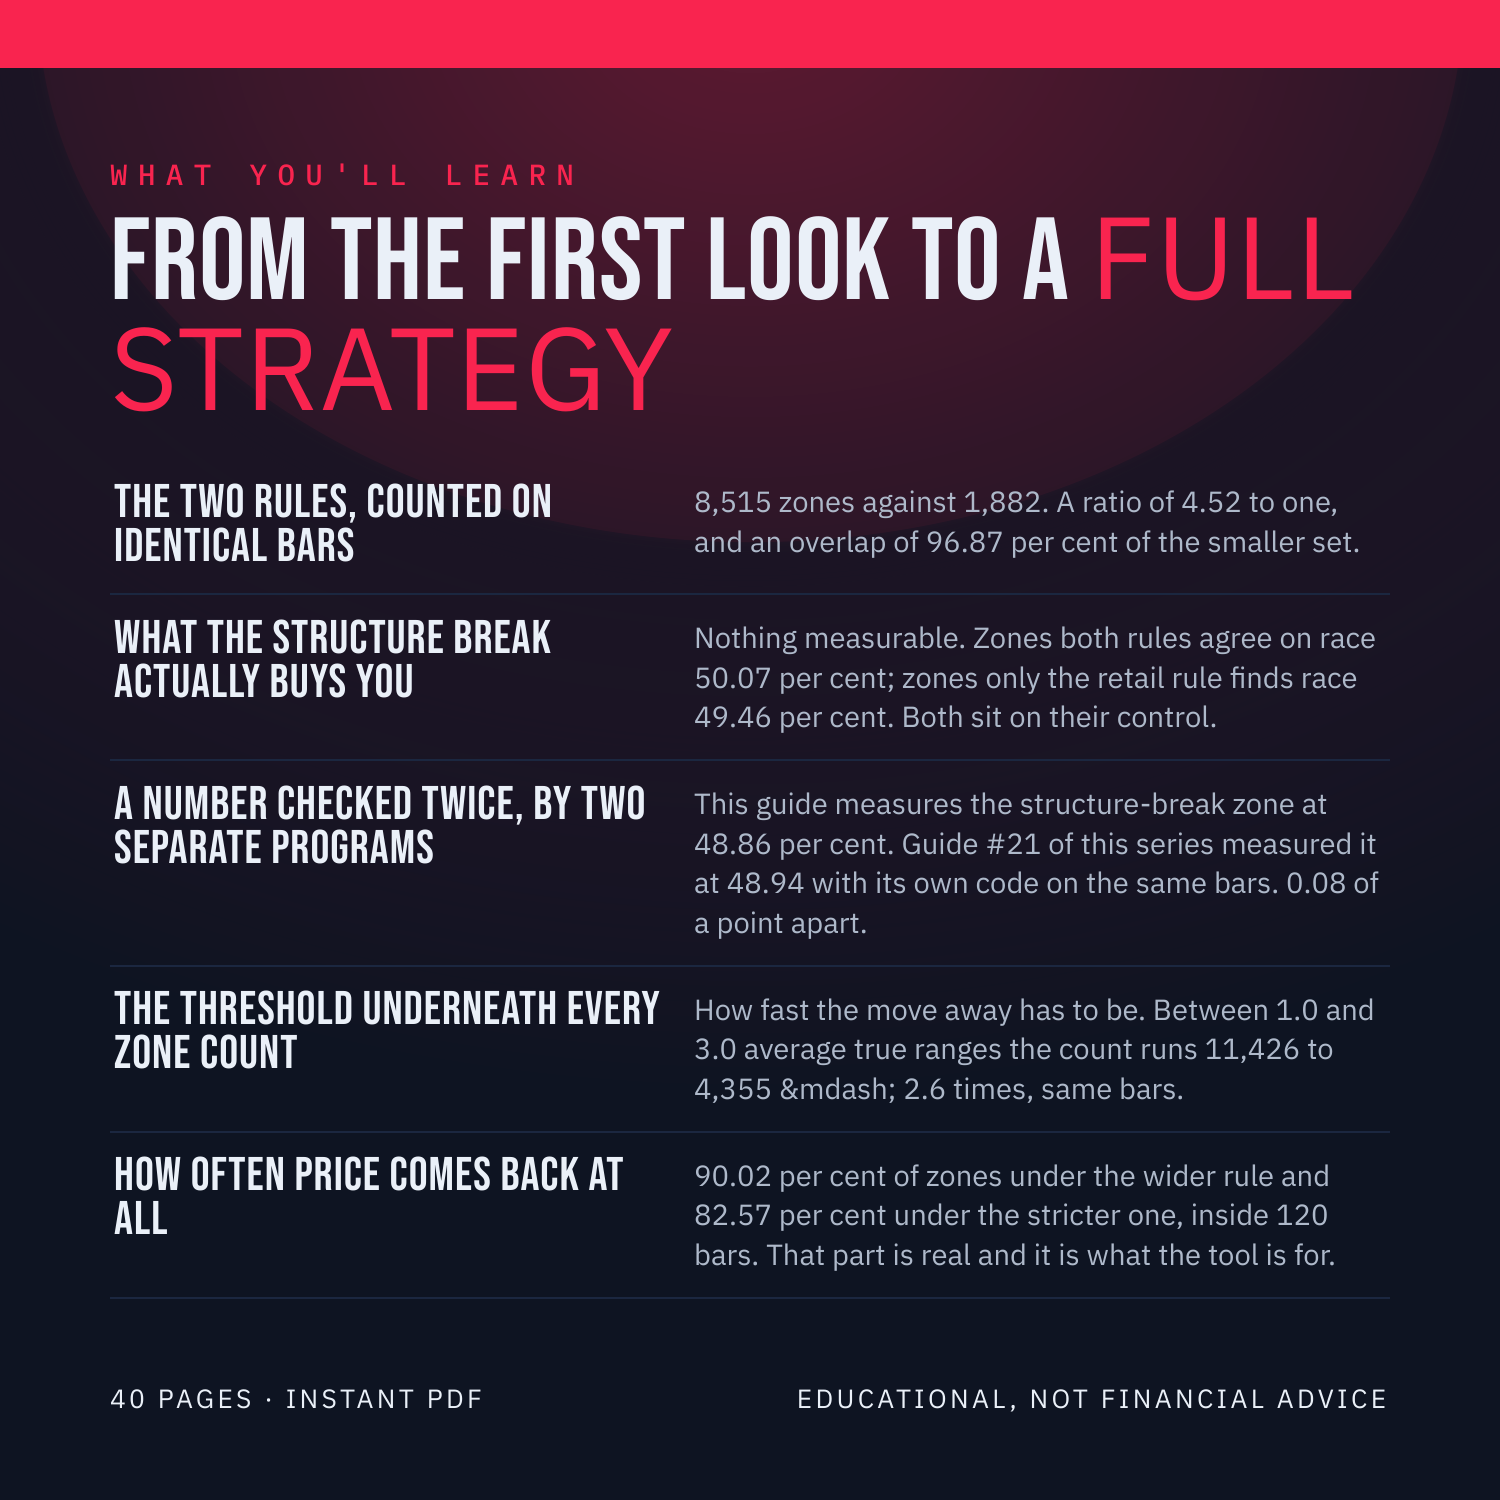
The two rules, counted on identical bars - 8,515 zones against 1,882. A ratio of 4.52 to one, and an overlap of 96.87 per cent of the smaller set.
What the structure break actually buys you - Nothing measurable. Zones both rules agree on race 50.07 per cent; zones only the retail rule finds race 49.46 per cent. Both sit on their control.
A number checked twice, by two separate programs - This guide measures the structure-break zone at 48.86 per cent. Guide #21 of this series measured it at 48.94 with its own code on the same bars. 0.08 of a point apart.
The threshold underneath every zone count - How fast the move away has to be. Between 1.0 and 3.0 average true ranges the count runs 11,426 to 4,355, which is 2.6 times, on the same bars.
How often price comes back at all - 90.02 per cent of zones under the wider rule and 82.57 per cent under the stricter one, inside 120 bars. That part is real and it is what the tool is for.
WHAT YOU'LL BE ABLE TO DO
Mark a zone by a written rule, with the threshold stated.
Say what a structure break adds to a zone, and what it costs.
Read 'supply zone' and 'order block' as one object with two names.
Judge any zone claim by its count, its control and its threshold.
Use zones for the thing they measurably do.
AN HONEST NOTE
Supply & Demand Zones is a clue, not a crystal ball. It describes what price has already done. This guide contains no win rates, no historical-test results and no promises about what you will make, because nobody can verify those and you should not trust anyone who prints them. What it hands you instead is a set of rules you can test yourself on TradingView in an afternoon. Educational, not financial advice.
Instant download. 40 pages, PDF.