

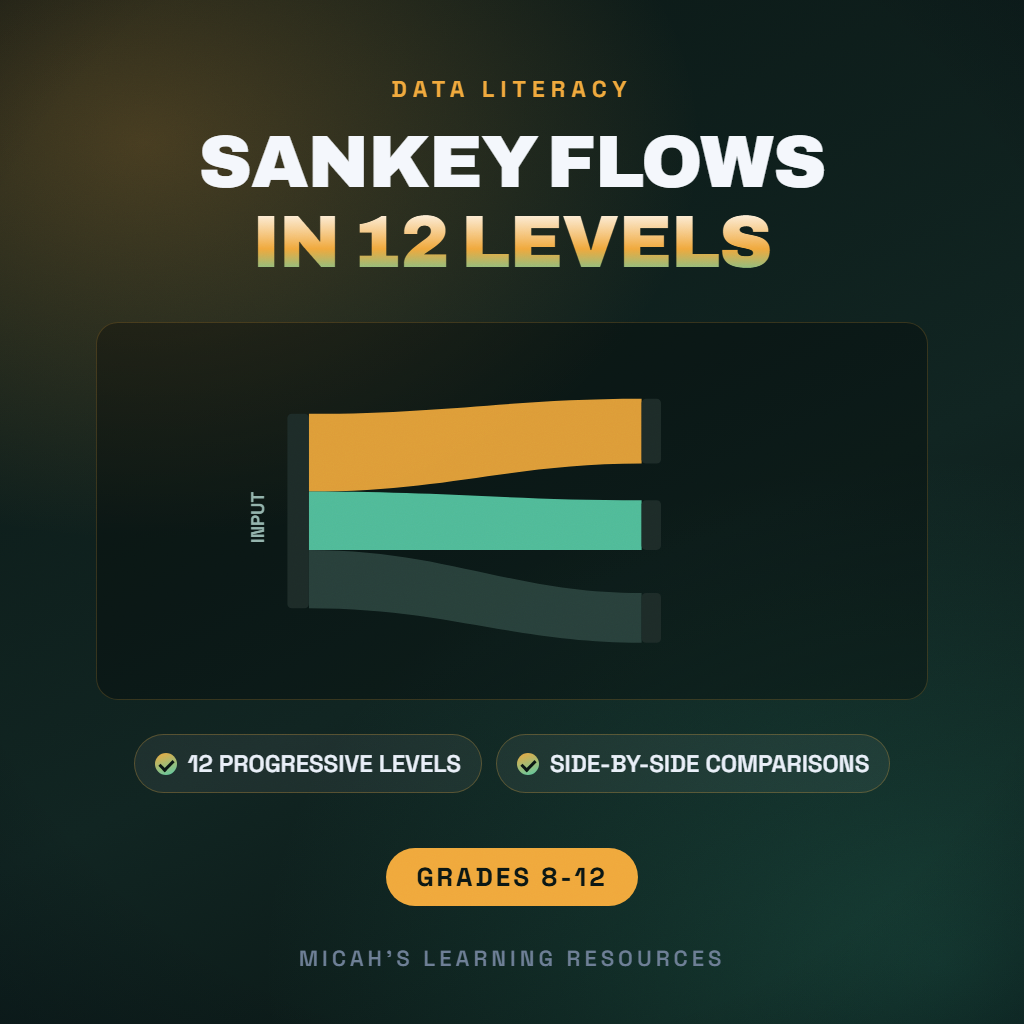





Sankey Diagrams in 12 Levels | Flow and Data Literacy | Grades 8-12
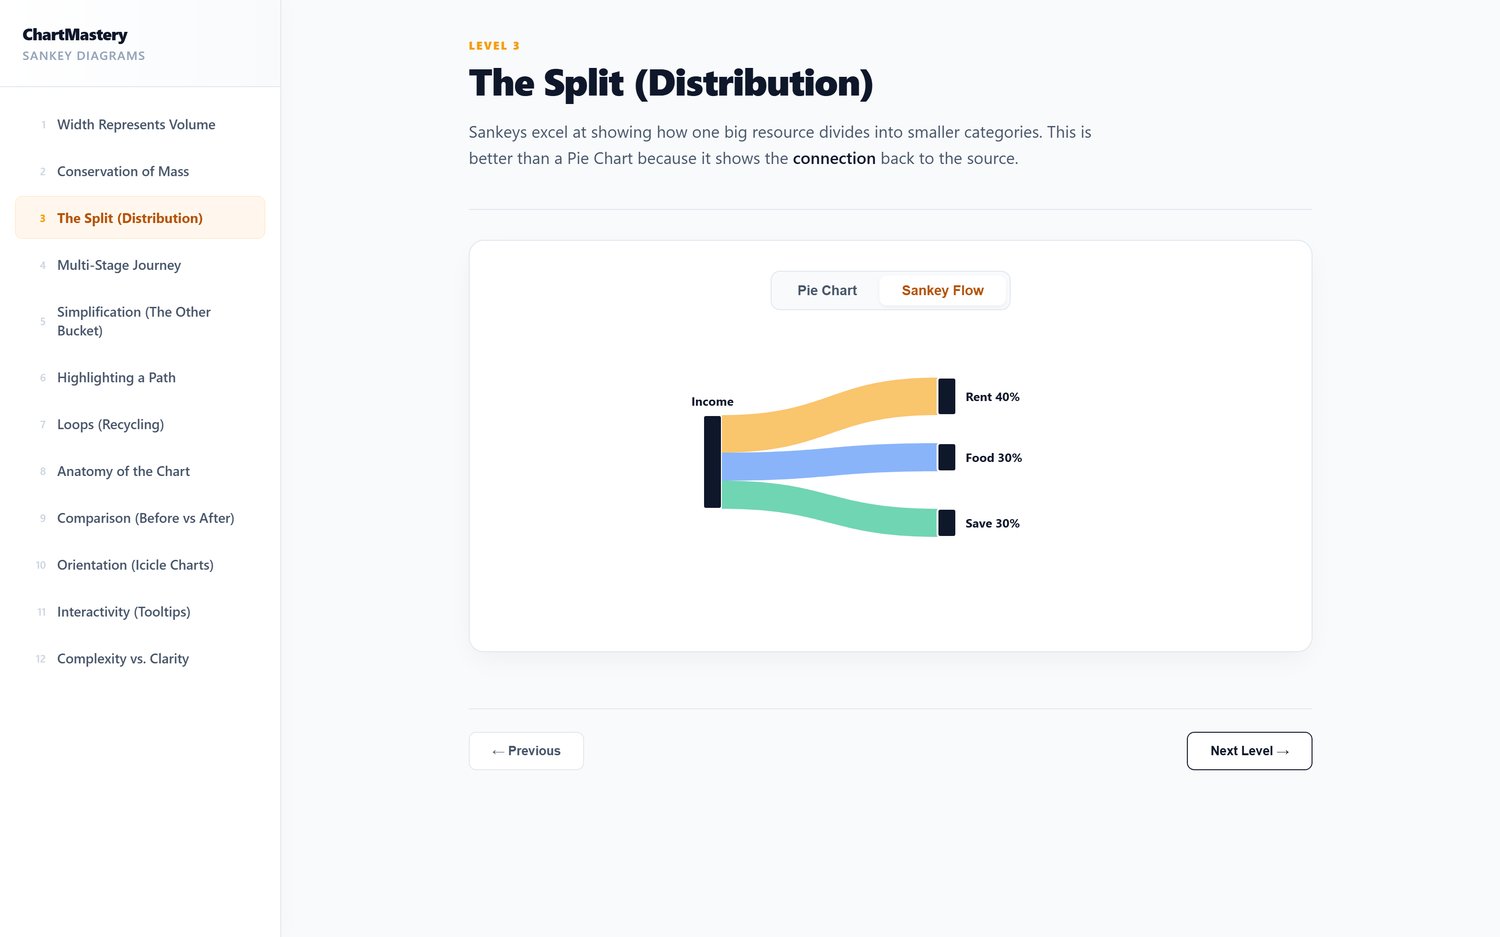
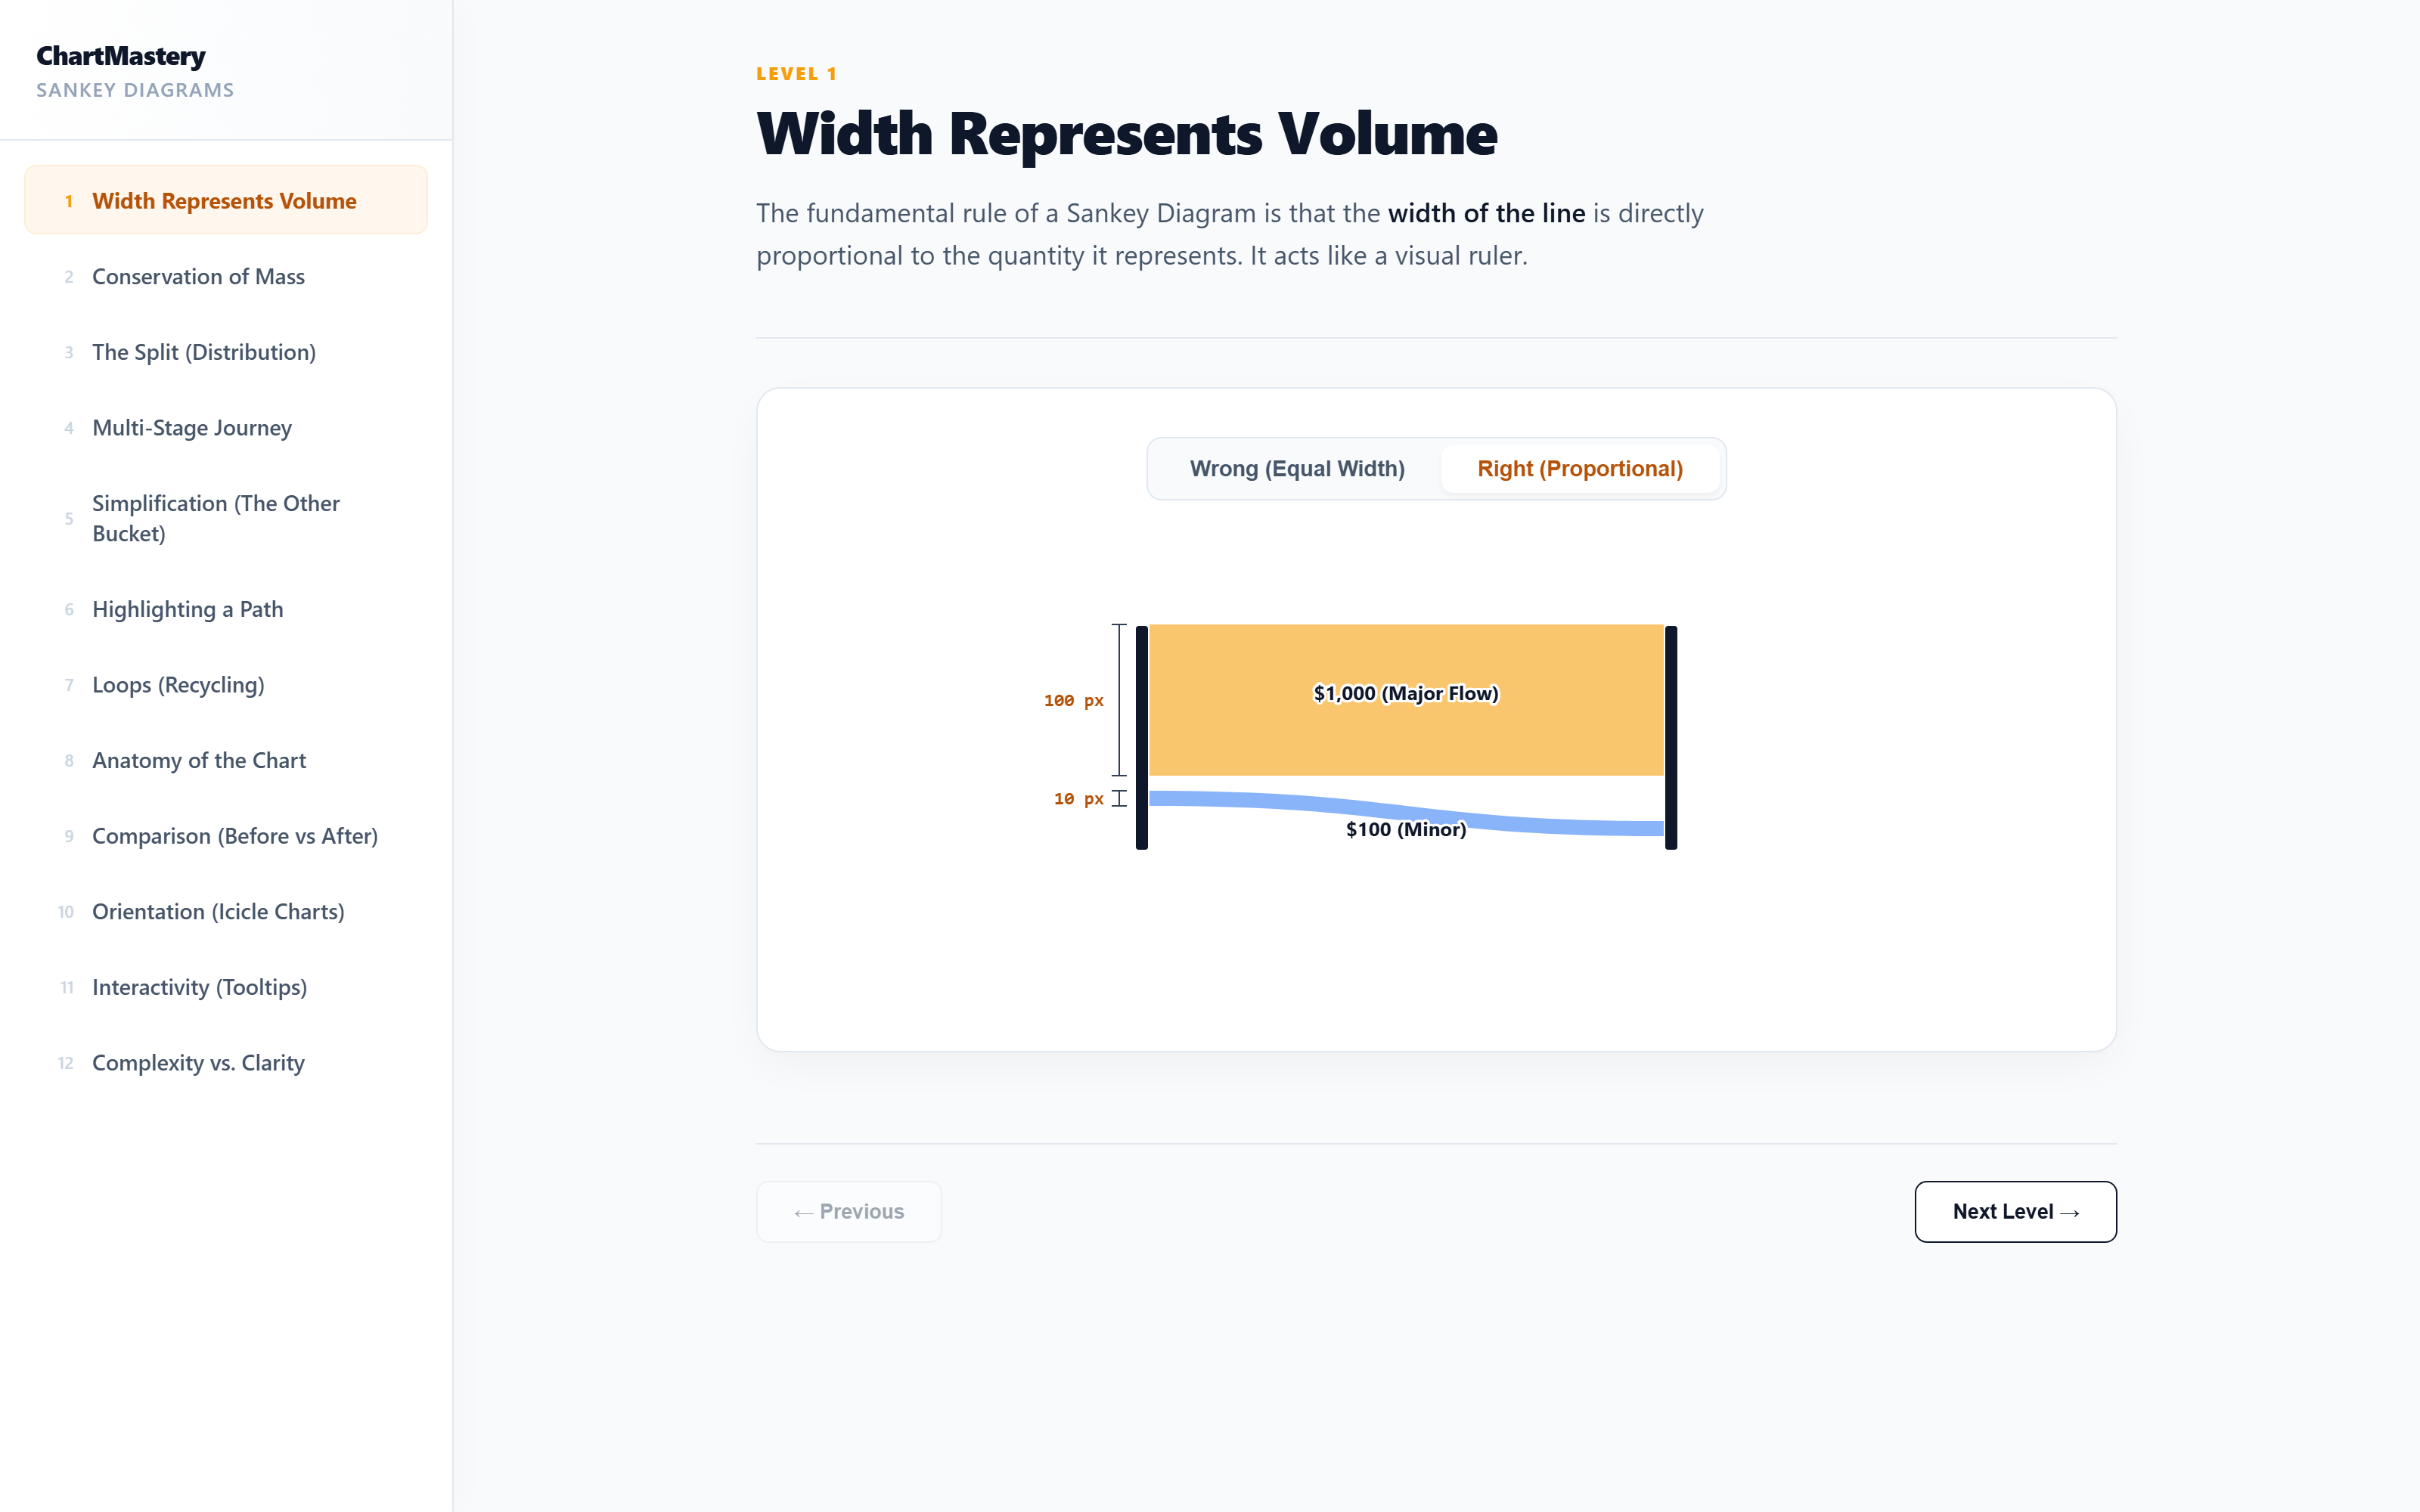
A budget, an energy system and a sales funnel are all the same picture: something goes in, and less of it comes out somewhere else. This activity teaches the diagram that shows exactly where it went. Twelve levels build from the one rule everything rests on, that width means volume, up to knowing when a simpler chart would say it better. Each level shows the weak version and the strong version with a toggle between them.
What's included
- One interactive file covering all 12 levels, in a single download
- A sidebar that lets students jump to any level or work straight through
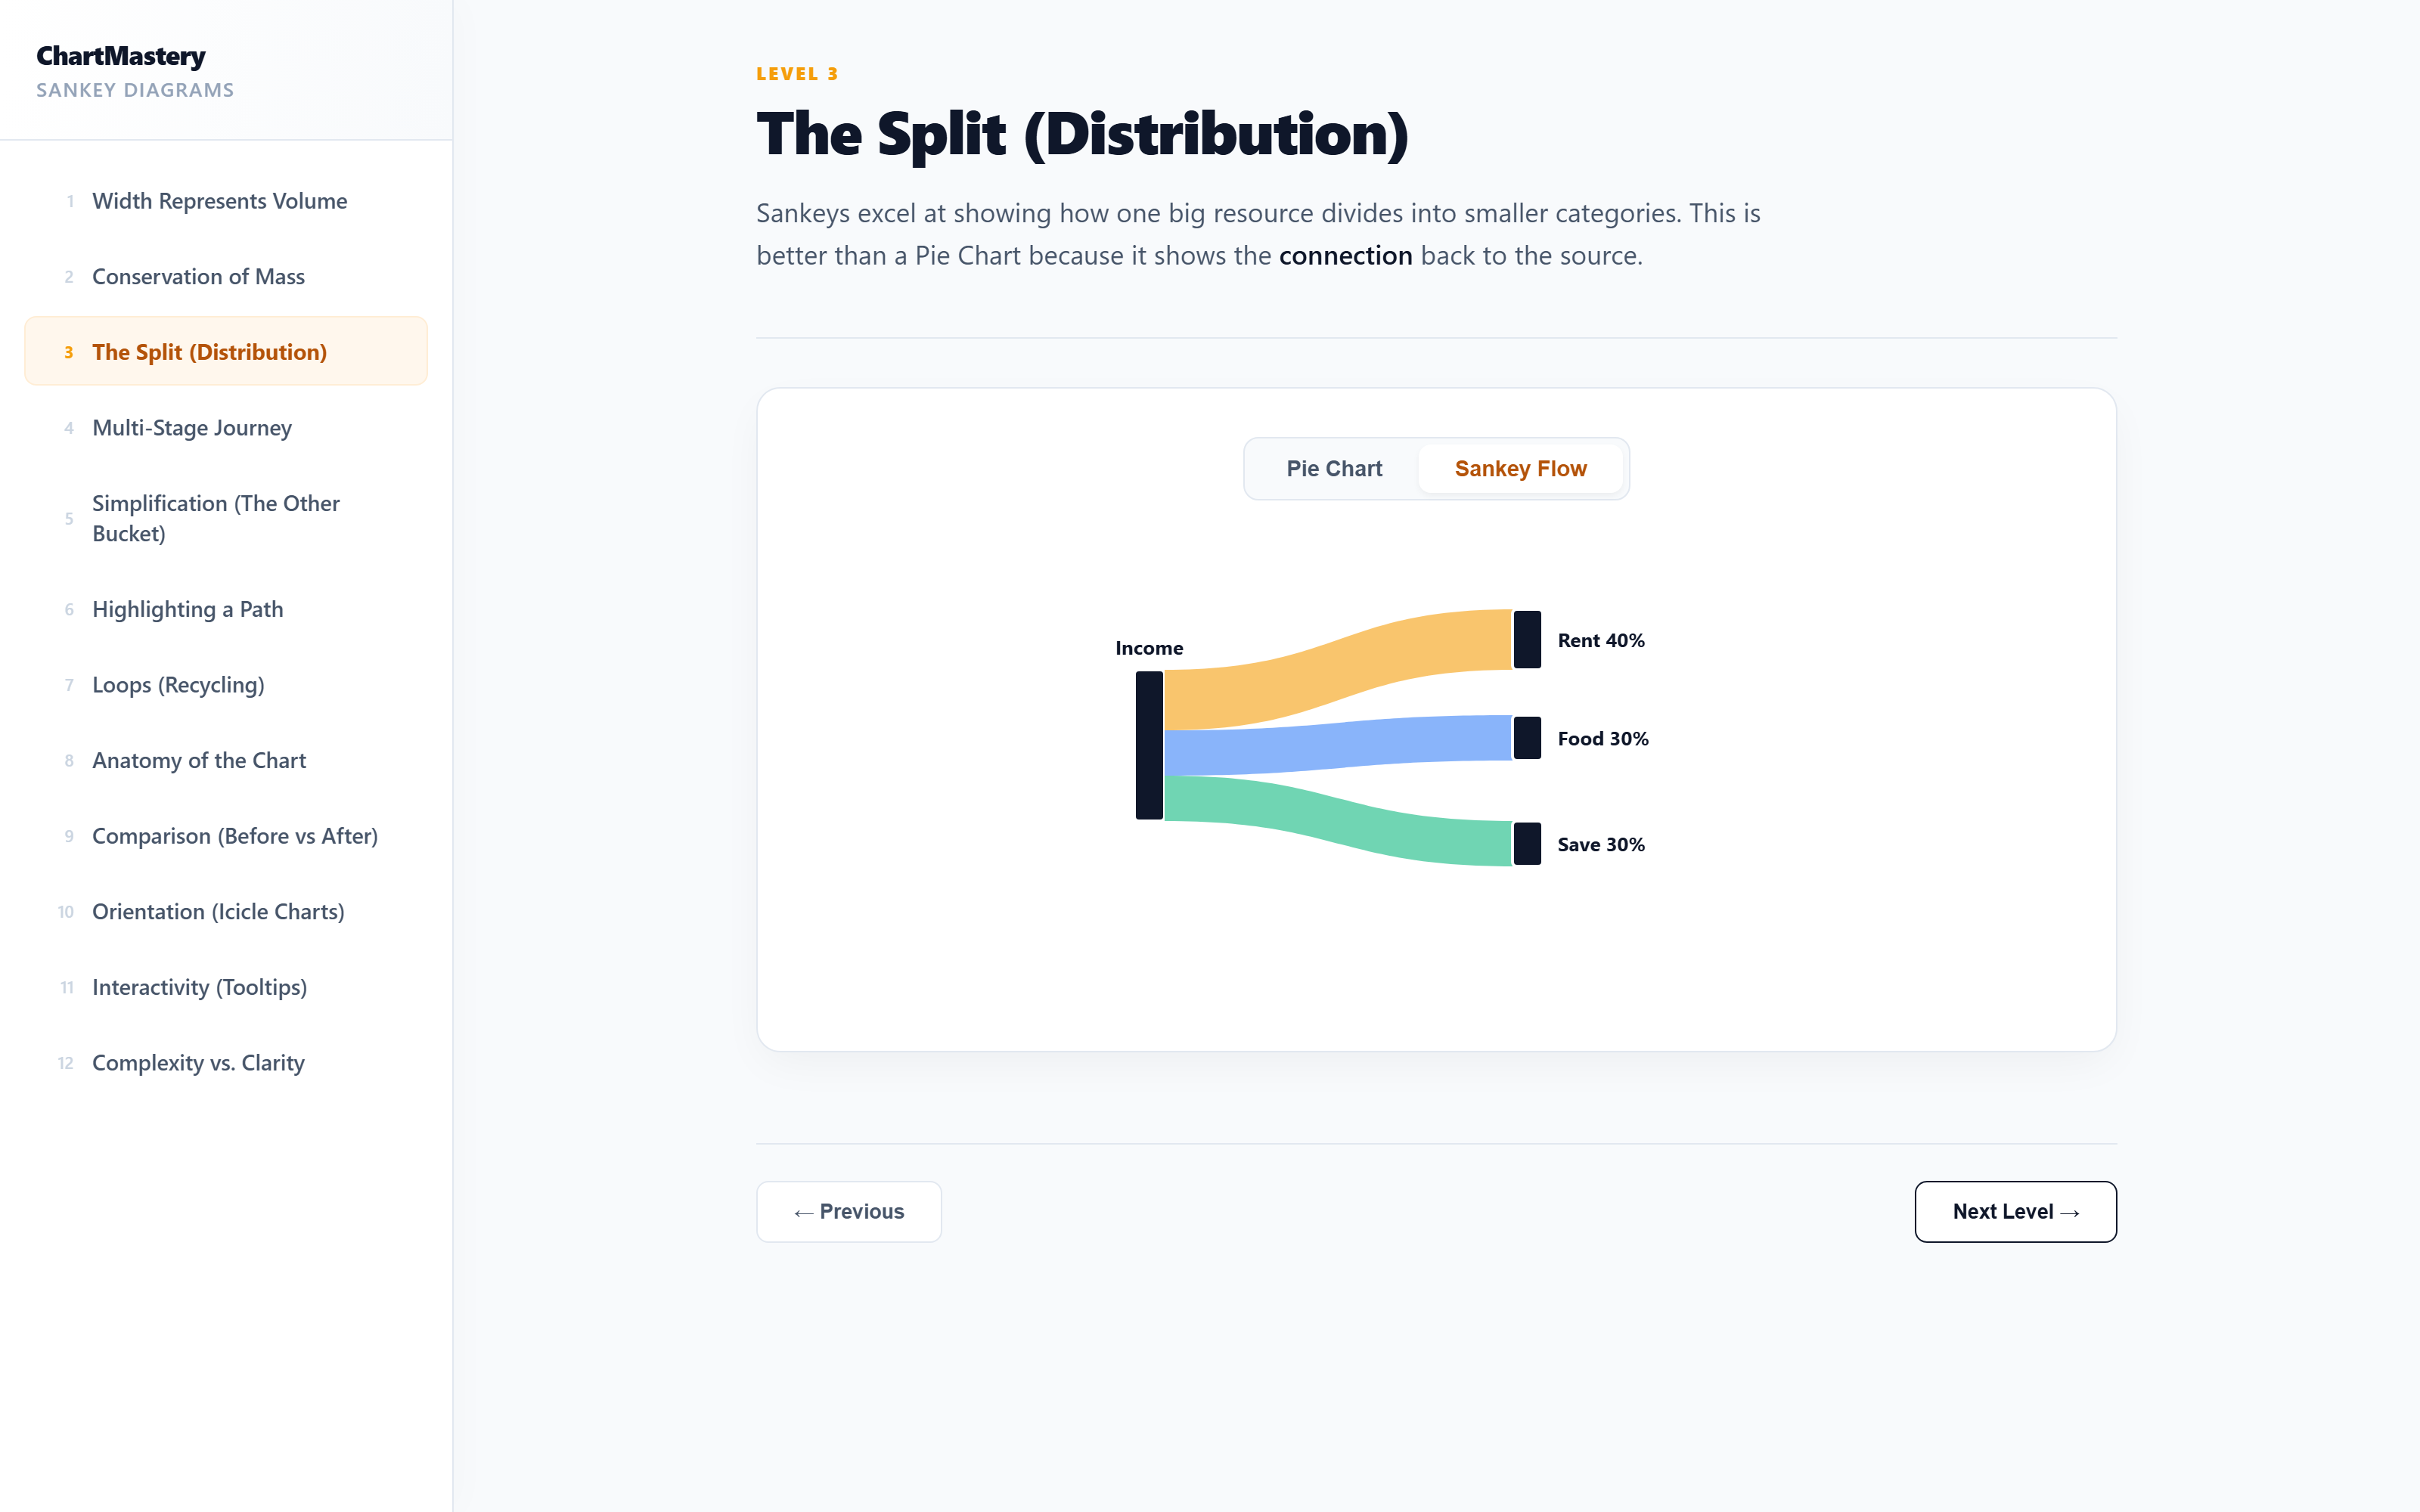
- 12 two-state comparisons, one per level, so every idea is shown as a before and after
- A short written rule on each level naming what changed and why it matters
- Self-paced navigation with previous and next controls
- Nothing to install, no account, and no internet required after download
The levels
- Level 1: Width Represents Volume
- Level 2: Conservation of Mass
- Level 3: The Split (Distribution)
- Level 4: Multi-Stage Journey
- Level 5: Simplification (The Other Bucket)
- Level 6: Highlighting a Path
- Level 7: Loops (Recycling)
- Level 8: Anatomy of the Chart
- Level 9: Comparison (Before vs After)
- Level 10: Orientation (Icicle Charts)
- Level 11: Interactivity (Tooltips)
- Level 12: Complexity vs. Clarity
How it works
Download one file and open it in any browser. Students pick a level from the sidebar or work through in order, and on each one they flip the toggle to compare the two versions before reading the rule that explains the difference. It runs the same on a Chromebook, a laptop or a tablet, and it can be shared through any learning management system.
How to use it
- Project one level a day as a warm up and discuss it as a class
- Assign the whole thing as a self-paced digital lesson
- Leave it for a substitute with no setup required
- Use it as a reference students return to while building their own charts
- Give it to early finishers or as an extension for students who want more
Skills covered
Flow analysis, systems thinking, tracking a resource through stages, funnel reasoning, and advanced visualization design.
Built for an advanced data science, business analytics, or systems thinking course. One file, no prep.
What you download
One file, Sankey Diagrams in 12 Levels. Open it in Chrome, Edge, Firefox or Safari on any computer, Chromebook or tablet.
Grade level: Grades 8-12 | $4.99 | one file that opens in any browser