

HSE KPI Dashboard
HSE KPI Dashboard
Incidents, hours and leading indicators — with TRIFR and LTIFR calculated properly against your targets.
Safety reporting usually arrives as a number with no working shown. This workbook holds the incident register underneath the rates, so every figure traces back to the events that produced it, and pairs lagging rates with the leading indicators that actually predict them.
What's inside
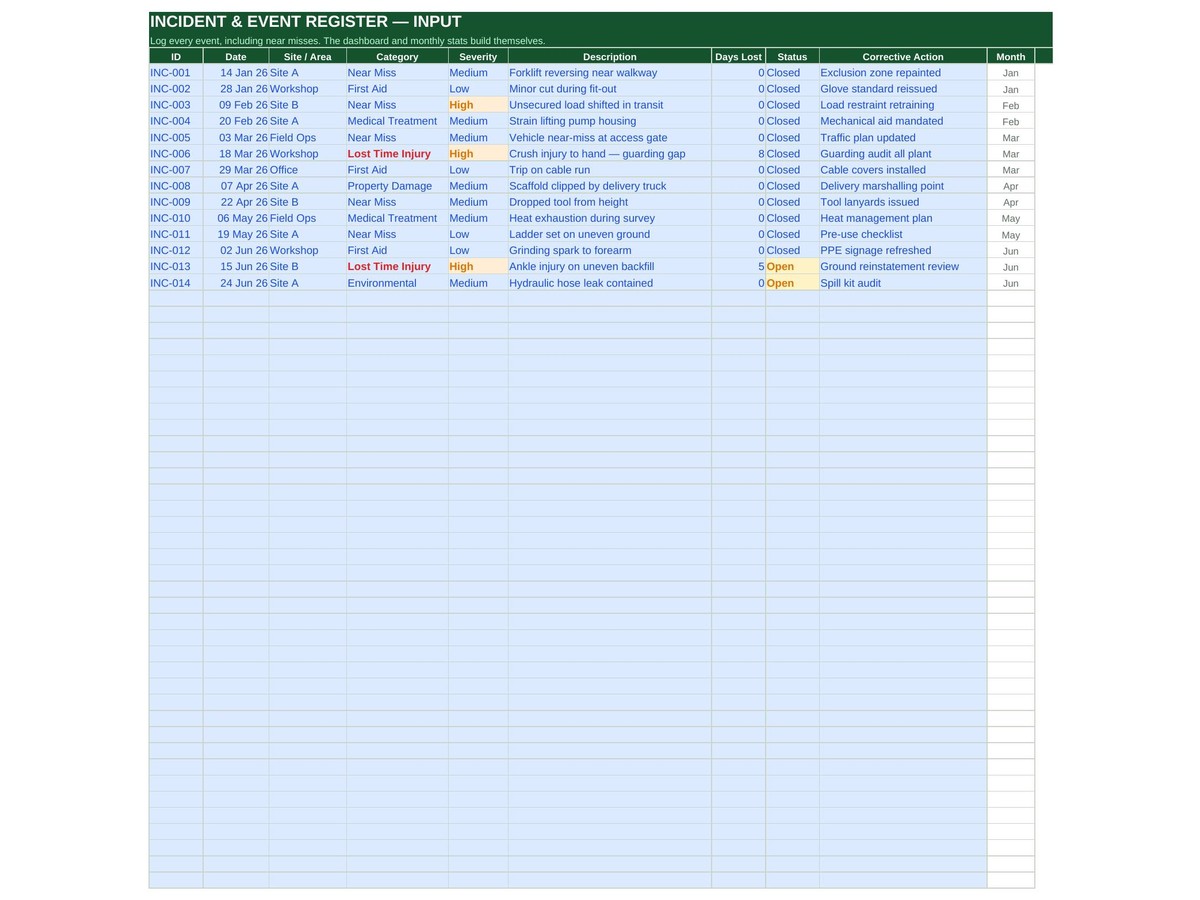
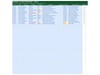
- Incident register — injuries and near misses, with classification, site and category
- Hours worked — monthly hours captured as the basis for every rate
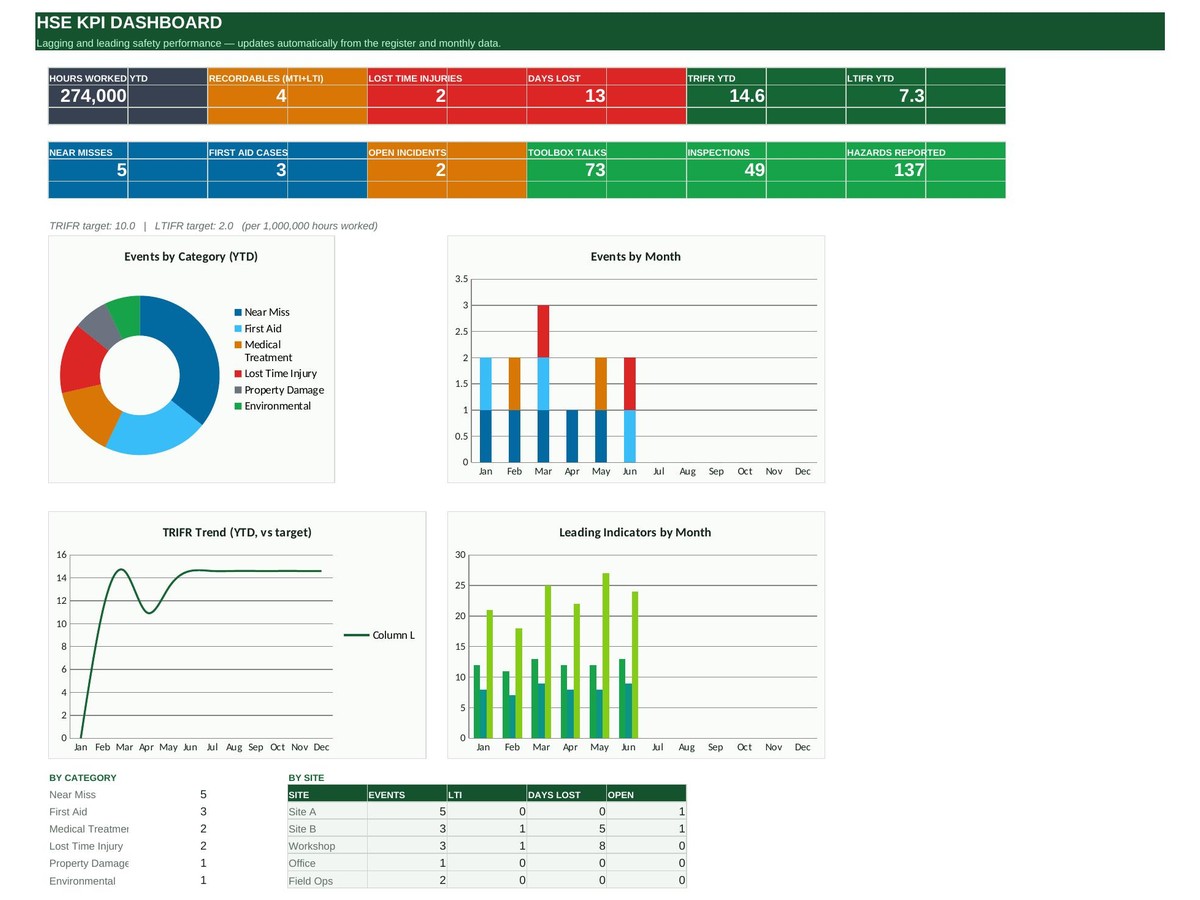
- TRIFR and LTIFR — calculated per million hours, against the targets you set
- Leading indicators — inspections, hazard reports, toolbox talks and training tracked alongside
- Site rollups — performance by site and across the business
- Trend analysis — rates over time, so improvement or drift is obvious
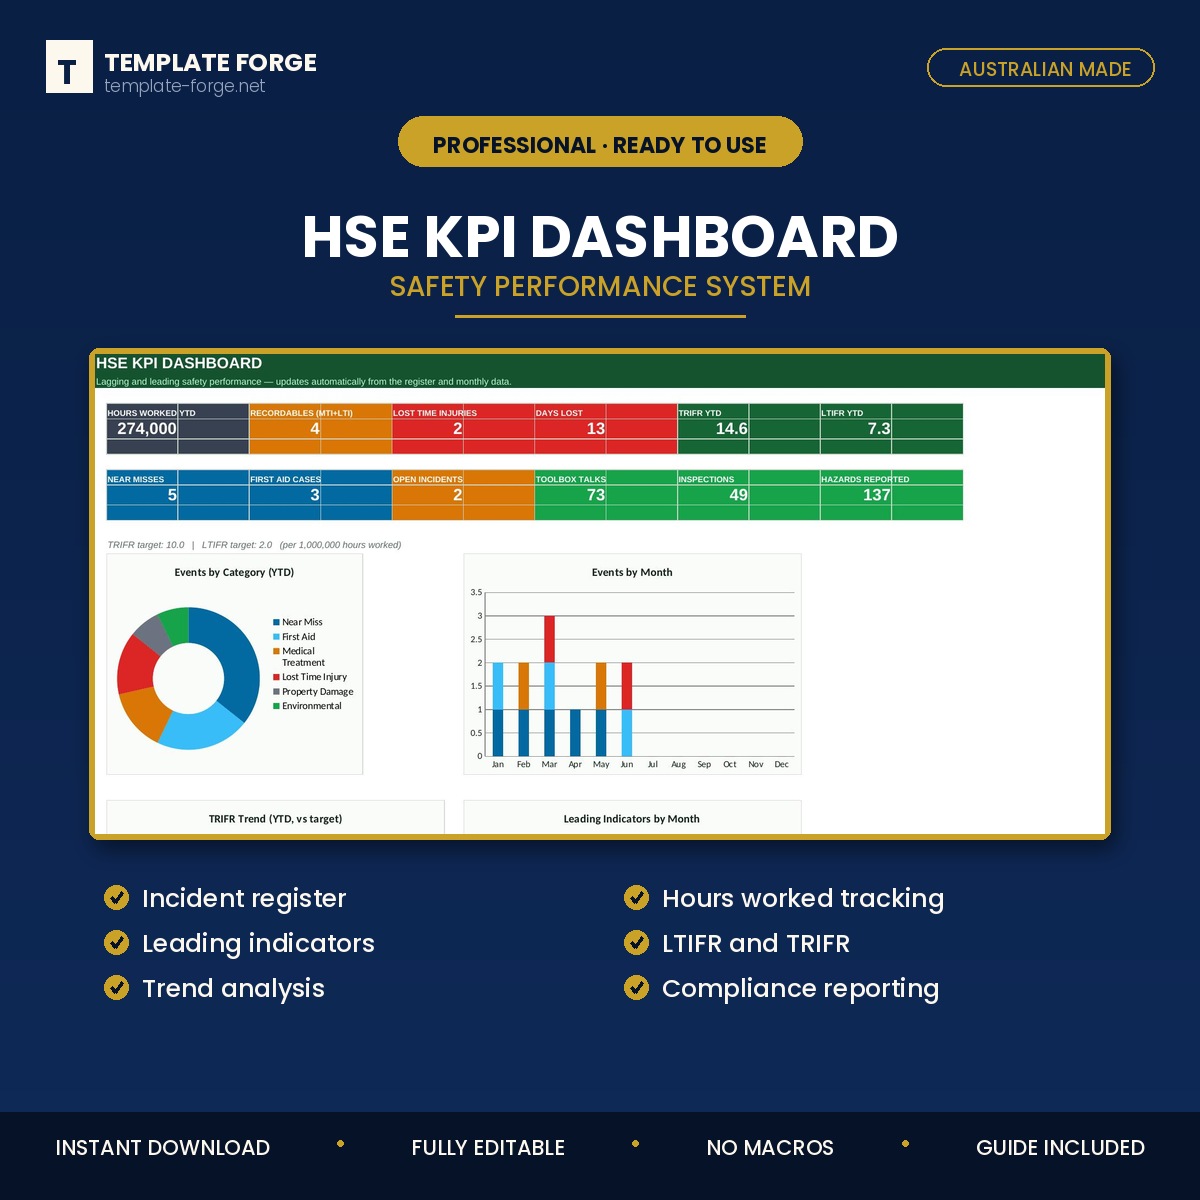
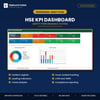
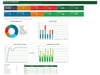
- Dashboard — the safety position on one screen
How it works
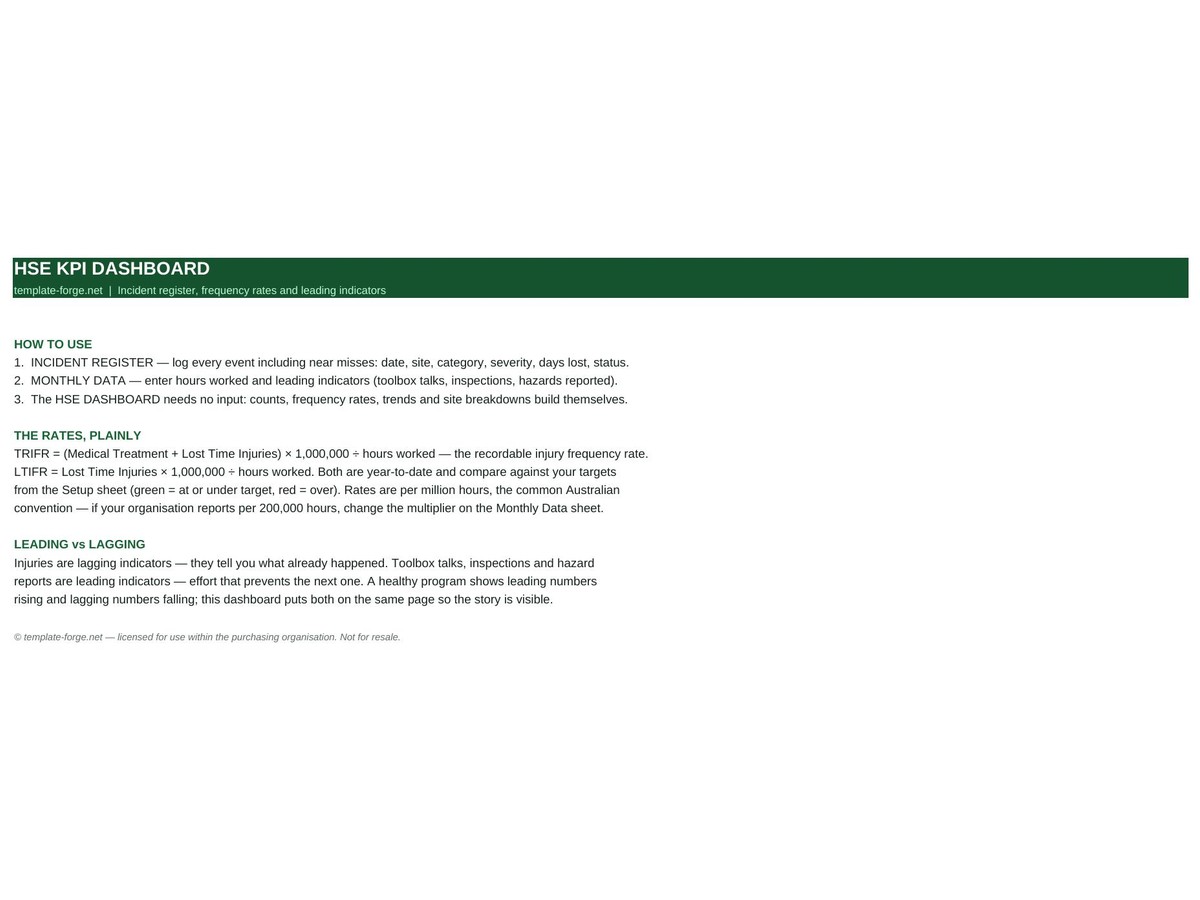
Log incidents and monthly hours; the rates, targets and dashboard calculate themselves. No macros, no add-ins, no subscription — a normal Excel file that opens on any version of Excel and keeps working forever.
Built in Australia from more than twenty years of program delivery experience. Instant download, yours to keep, use it across as many sites as you like.