

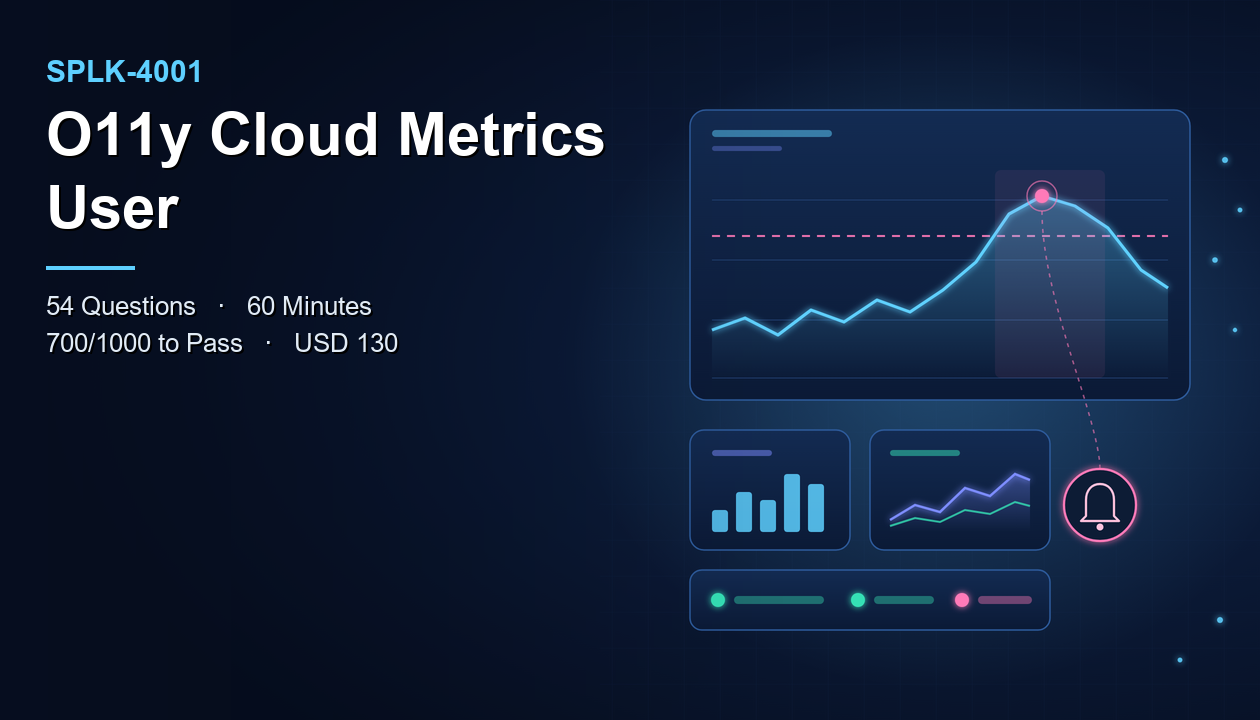
For years, the default way to find out what went wrong in a system was to search the logs. Something broke, you opened a search bar, narrowed the time range, and read events until the story made sense. That habit still works, but more and more teams now notice problems before anyone searches for anything, because a chart bent the wrong way or a detector fired while the incident was still small. The work has shifted from reading what happened to watching what is happening. The SPLK-4001 exam, for the Splunk O11y Cloud Certified Metrics User credential, sits right on that shift.
If you are making that move yourself, from log searching toward metrics and observability, the useful questions are practical. Which of your existing skills carry over? Which instincts will mislead you? And what does the exam actually expect a metrics user to be able to do? This article works through those questions, using the published exam details as the only source of facts: 54 questions, 60 minutes, a passing score of 700 out of 1000, and a USD 130 fee.
Where the exam details say nothing, on prerequisites or retake rules for example, this article does not guess. It points you to Splunk's official certification page and the exam blueprint, which are the authorities on those points.
What Is the Splunk O11y Cloud Certified Metrics User (SPLK-4001) Certification?
Splunk O11y Cloud Certified Metrics User is a Splunk certification in the Observability Cloud category, and SPLK-4001 is the exam that awards it. "O11y" is shorthand for observability: the eleven letters between the "o" and the "y." The credential is aimed at people who use metrics in Splunk Observability Cloud, rather than people who administer the platform or build a whole observability programme.
The word "User" in the title is worth taking seriously. The certification is about using metrics well: getting data in and understanding its shape, finding the right signal, building charts and dashboards that answer real questions, and setting up alerting that tells people about problems without burying them in noise. It is a hands-on, working-level credential. It checks whether you can turn a stream of numbers into something a team can act on.
Why a transition exam, not a starting point
Very few people arrive at metrics with no background. Most come from somewhere nearby: log analysis, infrastructure monitoring, application support, site reliability, or DevOps. That background is an advantage, but it also carries assumptions that do not always hold. A log is a record of something that happened. A metric is a measurement taken repeatedly over time. Those are different kinds of data, and they reward different ways of thinking.
That is why it helps to read SPLK-4001 as a transition exam. The competence it checks is not entirely new to most candidates, but it asks you to reorganise what you know around a different data model. The rest of this article keeps coming back to that idea: what carries over from log-centric work, and what has to change.
Who the exam fits
The exam fits people who look at metrics as part of their job and want to do it deliberately. That includes engineers on call who rely on dashboards and alerts, platform and infrastructure staff moving from older monitoring tools, Splunk users whose organisations have adopted Observability Cloud, and support or operations analysts who are increasingly expected to spot trends before tickets arrive. If metrics are becoming part of your working week, the exam is aimed at you.
SPLK-4001 Exam Overview and Details
These are the published facts for the exam:
- Exam name: Splunk O11y Cloud Certified Metrics User
- Exam code: SPLK-4001
- Category: Observability Cloud
- Number of questions: 54
- Duration: 60 minutes
- Passing score: 700 / 1000
- Exam fee: USD 130
- Scheduling: through Pearson VUE's Splunk exam page
Here is what those numbers mean once you are actually sitting the exam.
Fifty-four questions in sixty minutes
Sixty minutes for fifty-four questions gives you a little over a minute per question, about sixty-six seconds on average. That is a brisk pace. It leaves room for a quick check on most questions, but not much room for long deliberation on many of them. Candidates who know the material well can still run short on time if they reread every stem twice.
A useful habit is to check your progress at the thirty-minute mark. You want to be close to question twenty-seven. If you are well behind, you are probably spending too long confirming answers you already knew. Mark the uncertain ones, commit to a best answer, and keep moving. A handful of flagged questions revisited at the end is a better use of time than a slow middle section.
The pace also tells you something about preparation. When you have a minute per question, recognition matters. You need to know the vocabulary and the behaviour of charts, detectors, and data well enough that you are not working things out from scratch under the clock. That is why the hands-on practice later in this article is not optional.
A scaled passing score of 700 out of 1000
The passing mark is written as 700 out of 1000. Treat it as a scaled score rather than as "70 percent of the questions correct," since it is published in that form without a conversion from raw answers. Two conclusions follow. First, the bar is meaningfully high: you cannot afford to write off a whole area of the blueprint. Second, preparing for a narrow pass is risky, because you have no reliable way to know how close to the line a given practice score really is. Aim for comfortable, consistent results across every area.
The fee and the booking
At USD 130, the attempt costs less than many vendor certifications, which makes it tempting to "just try it and see." That approach usually wastes both the fee and the hour. A focused few weeks of preparation is a better investment than a speculative first attempt. You book through Pearson VUE; check there and on Splunk's official certification page for rescheduling, cancellation, and retake terms, because those policies are not part of the exam details summarised here.
Key Topics and Syllabus for SPLK-4001
The SPLK-4001 syllabus on CertFun is the authority on the exam's topics, and Splunk also publishes an official test blueprint for this certification, linked in the resources section below. Between them, those documents define what is in scope and how it is organised. Read them first. The sections that follow do not replace that list or its weightings. They describe the kind of understanding a metrics user needs, organised around the transition from log-centric thinking, so you can see where your existing experience helps and where it needs rework.
The metrics data model
Everything else rests on understanding what a metric is and how it is identified. A metric is a numeric measurement reported over time. What makes metrics powerful, and what trips up newcomers, is the metadata attached to them. A single metric name, such as CPU utilisation, may be reported by hundreds of hosts, containers, or services. Each distinct combination of metric and identifying metadata forms its own time series.
This is the first place where log habits need adjusting. In log search, you usually filter events by text and fields after the fact. With metrics, the identifying metadata decides how data can be grouped, filtered, and aggregated from the start. If that metadata is inconsistent, for example if one team labels an environment "prod" and another labels it "production," your charts will silently split what should be one view. Understanding how metadata shapes every later query is the most important conceptual step in the whole exam.
What carries over: your instinct for fields and filtering. What changes: you need to think about cardinality and consistency before data arrives, not only after.
Getting metrics in
Before you can chart anything, data has to reach the platform. A metrics user does not need to be an ingestion architect, but should understand how metrics are collected and sent, what an agent or collector does on a host, how integrations bring in data from cloud services and common technologies, and how metadata gets attached along the way.
The practical skill here is diagnosis. When a chart is empty, is the data missing, arriving under a different name, or carrying different metadata than the filter expects? Log users are used to asking "did the event get indexed?" The metrics equivalent is "is this time series reporting, and does it carry the dimensions I think it does?" Being able to answer that quickly saves a surprising amount of time, and it is exactly the kind of reasoning scenario questions reward.
What carries over: the discipline of checking whether data arrived before blaming the query. What changes: "arrived" now means a series with the expected name and metadata, not an event in an index.
Charts and analytics
Charts are where most metrics users spend their time, and this area goes well beyond picking a visualisation. You need to understand how a chart selects its time series, how to filter them, and how analytic functions change what you see: summing across many series, averaging, taking percentiles, comparing against an earlier period, or calculating a rate of change.
The transition point is aggregation. A log search usually counts or lists events. A metrics chart often combines many series into one line, and the choice of how to combine them changes the meaning completely. The average CPU across a fleet can look healthy while a few hosts are saturated. A sum of request counts tells a different story from a per-host maximum. Expect questions that describe what someone wants to know and ask which approach gives the right answer. The honest preparation is to build those charts yourself and watch how the line changes when you change the function.
Time matters here too. Metrics are reported at intervals, and charts roll data up over time windows. Understanding how resolution and rollups affect what a chart shows, especially when zooming out over long periods, prevents misreading a short spike that has been averaged away.
What carries over: your sense of which question a search is really answering. What changes: the aggregation you choose becomes part of the answer, so the same data can tell two opposite stories.
Dashboards for a team
A single good chart answers one question. A dashboard answers the questions a team asks repeatedly, and it has to work for people who did not build it. That means organising charts sensibly, using filters or variables so that one dashboard can serve many services or environments, and understanding how dashboards are grouped and shared.
This is where the metrics user thinks about other people. In log-centric work, many investigations are personal: you run a search, you find an answer. In observability work, dashboards become shared tools that an on-call engineer opens at three in the morning. The competence being tested is building views that are clear, reusable, and hard to misread.
What carries over: layout sense and knowing what an audience needs to see first. What changes: one dashboard often has to serve many services or environments through filters, instead of being copied and edited for each one.
Detectors and alerting
Alerting is where metrics earn their keep, and it is where the transition from reactive to proactive work is most visible. Detectors watch signals and raise alerts when conditions are met. The skill is not just creating a detector but choosing the right condition: a static threshold, a comparison with historical behaviour, a sudden change, or a sustained condition that avoids alerting on momentary blips.
Log-based alerting often triggers on the presence of a specific event, such as an error message. Metrics-based alerting more often triggers on behaviour over time, such as latency staying above a level for several minutes. That difference changes how you think about noise. A detector that fires on every brief spike trains people to ignore it. A detector that waits too long misses the window to act. Expect questions about which detector setup matches a stated goal, and about how alerts reach the people who need to act on them.
Consider a worked example. A team wants to know when an API is getting slow for users. A log-centric instinct is to alert whenever a timeout error appears. The metrics approach asks a different question: what does normal latency look like, and when has it been clearly worse than normal for long enough to matter? A detector on a high percentile of latency, with a condition that must hold for several minutes, catches a real slowdown while ignoring a single slow request. If traffic follows a daily pattern, comparing against historical behaviour may fit better than a fixed threshold. Each choice trades speed of detection against noise, and being able to explain that trade-off is what separates a metrics user from someone who has only clicked through the alert settings.
What carries over: knowing which failures matter to users. What changes: alerts describe sustained behaviour rather than single events.
SPLK-4001 Preparation Guide
The route below assumes you have some monitoring or log-analysis background and access, or potential access, to Splunk Observability Cloud. If metrics are completely new to you, spend extra time on the first two steps.
Step 1: Map your background against the blueprint
Open the syllabus and the official test blueprint and read every topic. For each one, write down which part of your current experience it connects to, and whether that experience helps or might mislead you. "I build log dashboards" connects to the dashboard topics and mostly helps. "I alert on error messages" connects to detectors but may mislead, because metrics alerting is about behaviour over time.
This mapping does two jobs. It shows where you can move quickly, and it flags the places where old habits are likely to produce confident wrong answers. Those flagged topics deserve the most attention, because they are where experienced candidates lose marks.
Step 2: Follow the official learning path
Splunk publishes an O11y Cloud Certified Metrics User learning path in its course catalog. Because it is built for this certification, make it the backbone of your study. Work through it in order: the data model first, then getting data in, then charts, dashboards, and detectors. The order matters, since each later topic depends on understanding how metrics and their metadata behave.
As you go, keep a short note for each topic in the "carries over / changes" format used in this article. Writing down what is different from log-centric work turns vague familiarity into specific, testable understanding.
Step 3: Build things, then break them
Reading about analytic functions is not the same as seeing what they do. If you have access to an Observability Cloud environment, or a trial, spend real time in it. Build a chart that sums a metric across hosts, then change it to show the maximum and watch a hidden problem appear. Compare a metric with its value from a week earlier. Create a dashboard with a filter that switches between environments.
Then set up detectors and deliberately make them behave badly. Create one with a threshold so tight it fires constantly, and another that requires the condition to hold for so long it would miss a real incident. Adjust both until they behave sensibly. That experience answers a whole class of scenario questions far better than memorising definitions.
If you cannot get hands-on access, use the learning path material to walk through the same scenarios on paper. For each one, predict what the chart or detector would show, and write down why.
Step 4: Practise at exam pace
Once you have covered the blueprint, move to timed practice. Hold yourself to roughly a minute per question, matching the real pace of 54 questions in 60 minutes. The aim is to find out whether your understanding holds up when you cannot stop and reason from first principles.
Review every wrong answer and every lucky guess. Classify each one: a gap in knowledge, a misread question, or a log-centric assumption that did not hold. The third category is the one this exam is best at exposing, and each instance is worth tracing back to the relevant topic in your notes.
Step 5: Book when you are consistent, not when you are close
With a 700 out of 1000 passing mark, consistency matters more than an occasional good practice result. Book through Pearson VUE when your timed practice is reliably comfortable across all topics. In the last week, stop adding material and revisit your flagged topics from Step 1. Do one full timed practice run. The day before the exam, rest; a clear head reads scenario questions more accurately than a tired one.
Benefits and Career Scope of the SPLK-4001 Certification
The value of a user-level certification is that it confirms practical competence in a specific, increasingly common kind of work. For someone moving from log-centric roles into observability, it also marks the transition clearly.
It shows you have made the move to metrics
Many professionals have years of log analysis experience and only informal exposure to metrics. The credential gives that newer competence a name. It tells a team lead or hiring manager that you understand the metrics data model, can build charts and dashboards that answer real questions, and can set up alerting that works, rather than simply having looked at other people's dashboards.
It fits where observability is replacing older monitoring
The certification sits in Splunk's Observability Cloud category, so it is most directly relevant in organisations that use Splunk Observability Cloud, or are adopting it. In those environments, people who can build dependable dashboards and detectors quickly become the ones others rely on during incidents. The underlying skills, such as understanding metrics metadata, choosing the right aggregation, and designing low-noise alerts, also transfer to observability work generally.
It supports on-call and reliability work
The work this certification supports includes monitoring services and infrastructure, building dashboards for engineering and operations teams, designing and tuning alerts, investigating performance problems using metrics, and contributing to incident response. For people in support, operations, DevOps, or site reliability roles, those are core responsibilities. For Splunk users whose background is mainly log analysis, it broadens the kind of problems you can take on.
Practice Test and Preparation Resources
Keep your resources focused. The official material defines the exam, and practice questions show you whether you are ready.
Official resources
- Official Splunk O11y Cloud Certified Metrics User certification page: the authority on the certification's current details, including prerequisites and policies not covered in this article.
- Official SPLK-4001 test blueprint (PDF): Splunk's own outline of what the exam covers. Use it with the syllabus in Step 1 and again before booking.
- O11y Cloud Certified Metrics User learning path: the Splunk course catalog path linked in the Preparation Guide, built for this certification.
- Pearson VUE: where you book the exam and confirm testing options.
Sample questions and practice tests
When your study is well underway, work through the SPLK-4001 sample questions on CertFun. They show you how topics are turned into exam-style questions and how plausible wrong answers are built, which is especially useful for spotting log-centric assumptions that do not hold for metrics.
Use practice tests in timed blocks at the real pace, then review carefully. The review is where the value lies: every mistake points to a specific topic, and every lucky guess points to understanding that is not yet solid. Two or three well-reviewed practice sessions will tell you more about your readiness than many rushed ones.
Conclusion
SPLK-4001 checks whether you can work with metrics in Splunk Observability Cloud: understanding how metric data and its metadata are structured, getting data in, building charts with the right analytics, creating dashboards a team can rely on, and setting up detectors that alert on real problems without constant noise. The exam gives you 54 questions in 60 minutes, requires a scaled score of 700 out of 1000, and costs USD 130.
For most candidates, the exam is a transition as much as a test. Your experience with fields, filters, dashboards, and alerts carries over. What changes is the data model underneath: measurements over time instead of individual events, identity defined by metadata, and alerting based on behaviour rather than on single occurrences. The preparation route that works is built around that shift. Map your background against the blueprint, follow the official learning path, build and break real charts and detectors, and practise at exam pace until your results are consistent.
Done that way, the certification confirms more than exam knowledge. It shows that you have moved from reading what happened to watching what is happening, which is the change the whole field is making.
FAQs
How many questions are on the SPLK-4001 exam, and how long is it?
The exam has 54 questions and a duration of 60 minutes, which works out to a little over a minute per question.
What is the passing score for SPLK-4001?
The passing score is 700 out of 1000. It is published as a scaled score, so do not read it as a simple percentage of correct answers.
How much does the SPLK-4001 exam cost?
The exam fee is USD 130. Confirm the amount when you book through Pearson VUE.
Where do I book the exam?
You schedule the exam through Pearson VUE's Splunk exam page, where you can also check testing options and booking rules.
What does "O11y" mean?
"O11y" is shorthand for observability, counting the eleven letters between the first "o" and the final "y." The exam sits in Splunk's Observability Cloud category.
Are there prerequisites for this certification?
The exam details summarised here do not list a prerequisite. Check Splunk's official certification page for current requirements before you book.
What official study material should I use?
Use the O11y Cloud Certified Metrics User learning path in Splunk's course catalog, together with the official test blueprint. Both are built specifically for this certification.
Where can I see the full list of exam topics?
The SPLK-4001 syllabus on CertFun and Splunk's official test blueprint are the authorities on what the exam covers. Use them to plan your study and to check coverage before you book.