

Money touches every part of our lives. Yet, most people never learn how to control it. They earn, they spend, but they don’t always save. They invest blindly without knowing the difference between simple interest and compound interest. They buy stocks or crypto without understanding the basic principles of chart analysis.
The truth is simple: financial freedom isn’t about luck — it’s about strategy, tools, and consistency.
In this guide, we’ll explore three essential pillars of money management:
- Saving & Budgeting – learning how to track, cut, and plan your expenses.
- Compound Interest – letting your money work for you, even while you sleep.
- Chart Analysis – making informed decisions in the markets with confidence.
And to make things practical, we’ll introduce three ready-to-use tools: the Saving Budget Pack, the Compound Interest Pack, and the Chart Analysis Pack — designed to help anyone from beginner to advanced investor take control of their money.
Let’s dive in.
➡️ Curious how small steps can lead to exponential results? Learn more here

💵 Part 1: The Foundation – Saving & Budgeting
Before you can invest, you must first save. Budgeting is the foundation of financial stability. Without a plan, even a high income can vanish into thin air.
Why budgeting matters
- It shows you where your money goes.
- It helps you identify unnecessary expenses.
- It gives you clarity about how much you can save and invest each month.
Think about this: if you don’t track your expenses, small leaks can sink your financial ship. $5 coffees, unused subscriptions, late fees — they add up faster than you think.
The 50/30/20 rule
One of the most popular budgeting frameworks is the 50/30/20 rule:
- 50% → Needs (housing, food, bills)
- 30% → Wants (entertainment, dining out)
- 20% → Savings & debt repayment
It’s simple, visual, and works for most people.
Example: $100/month in savings
If you set aside just $100 every month consistently, you’ll have $1,200 after one year. That may not sound life-changing, but it builds the most important habit: discipline. Once you master saving, you can scale.
Tool spotlight: Saving Budget Pack
Our Saving Budget Pack is designed to make budgeting visual and easy. Instead of getting lost in complicated spreadsheets, you’ll have a clear system to:
- Track Income (✔️)
- Control Expenses (❌)
- Prioritize Savings (💰)
With charts, checklists, and reminders, it transforms budgeting into something you can actually stick to.
➡️ Want to try a simple calculator that shows you exactly how this works? Check this out
📈 Part 2: The Engine – Compound Interest
Budgeting is the foundation. But the real magic happens when your money starts working for you through compound interest.
Simple vs. Compound Interest
- Simple interest: You earn only on your initial amount. (Example: $1000 at 5% = $50 per year, flat.)
- Compound interest: You earn interest on both your initial money and the interest already earned. Over time, it creates exponential growth.
This is why Albert Einstein called compound interest the 8th wonder of the world.
Example: $100/month
If you invest $100 every month with a 7% annual return:
- After 10 years → $17,409
- After 20 years → $52,092
- After 30 years → $122,708
All from small, consistent savings.
The formula
The standard compound interest formula is:
A = P (1 + r/n)^(nt)
Where:
- A = final amount
- P = principal
- r = annual interest rate
- n = number of compounding periods
- t = time in years
But don’t worry — you don’t need to memorize formulas. That’s where tools help.
Tool spotlight: Compound Interest Pack
Our Compound Interest Pack lets you simulate scenarios instantly. Want to know what happens if you invest $200 instead of $100? Or what if the return is 8% instead of 7%?
In seconds, you can visualize the curve and understand how time + consistency = growth.
➡️ Looking for a simple budgeting method you can apply today? Discover it here.
Part 3: The Strategy – Chart & Graph Analysis 📊
If compound interest is the foundation and saving on a budget is the engine, then chart and graph analysis is the strategy that makes everything visible and actionable. Without strategy, money management is like sailing without a compass—you might move forward, but you don’t know where you’re going.
In modern finance, data visualization tools—such as charts, pie graphs, and candlestick charts—are essential for making smarter decisions. They give you a bird’s-eye view of your financial health and help you understand where your money flows, how your savings grow, and when to adjust your strategy.
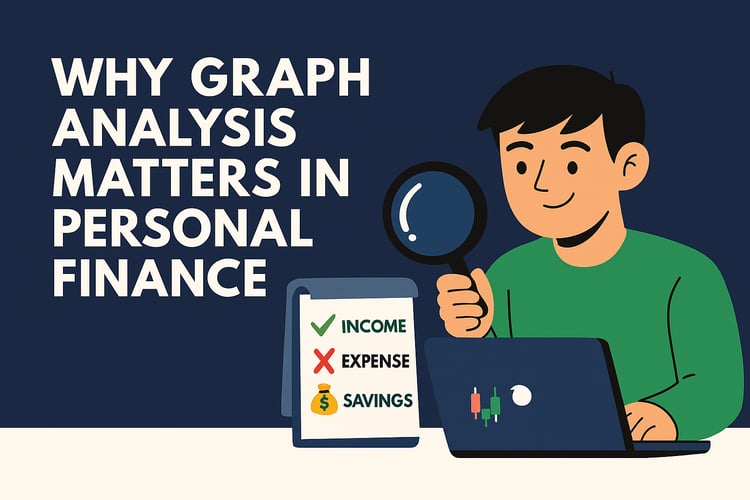
1. Why Graph Analysis Matters in Personal Finance
Most people fail to save because they don’t track their progress. Imagine driving a car without a dashboard—you wouldn’t know your speed, fuel level, or whether the engine is overheating. Charts and graphs act as your financial dashboard.
- Pie Charts show proportions: income vs. expenses vs. savings.
- Bar Graphs highlight changes: monthly expenses going up or down.
- Line Charts track growth: your savings curve over time.
- Candlestick Charts (popular in trading and investing) reveal market opportunities and risks.
By regularly reviewing these visuals, you can spot wasteful spending, celebrate progress, and refine your financial habits.
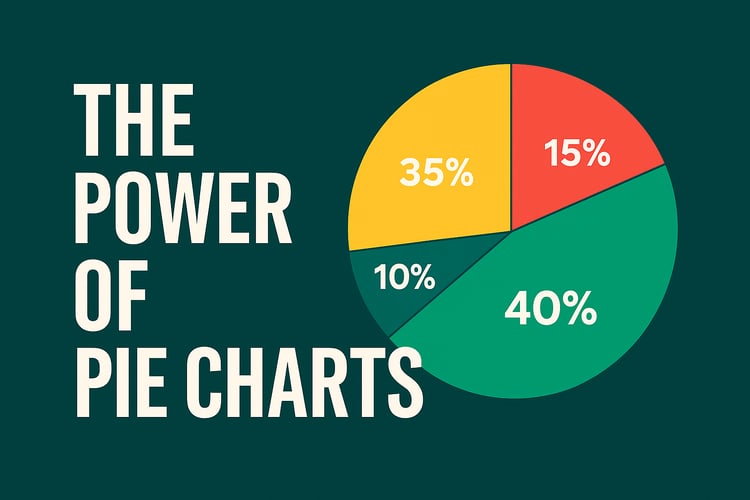
2. The Power of Pie Charts: Expenses vs. Savings
One of the simplest yet most powerful visuals is a pie chart dividing your monthly budget into three sections:
- Income (100%)
- Expenses (X%)
- Savings (Y%)
For example:
- 70% of your income goes to expenses (rent, food, bills).
- 20% goes to savings.
- 10% goes to investments or leisure.
With one glance, you can see if your lifestyle matches your goals. If your pie chart shows 90% expenses and only 5% savings, it’s time for a change.
Pro tip: Use apps like Google Sheets, Notion, or Mint to create auto-updated pie charts every month.
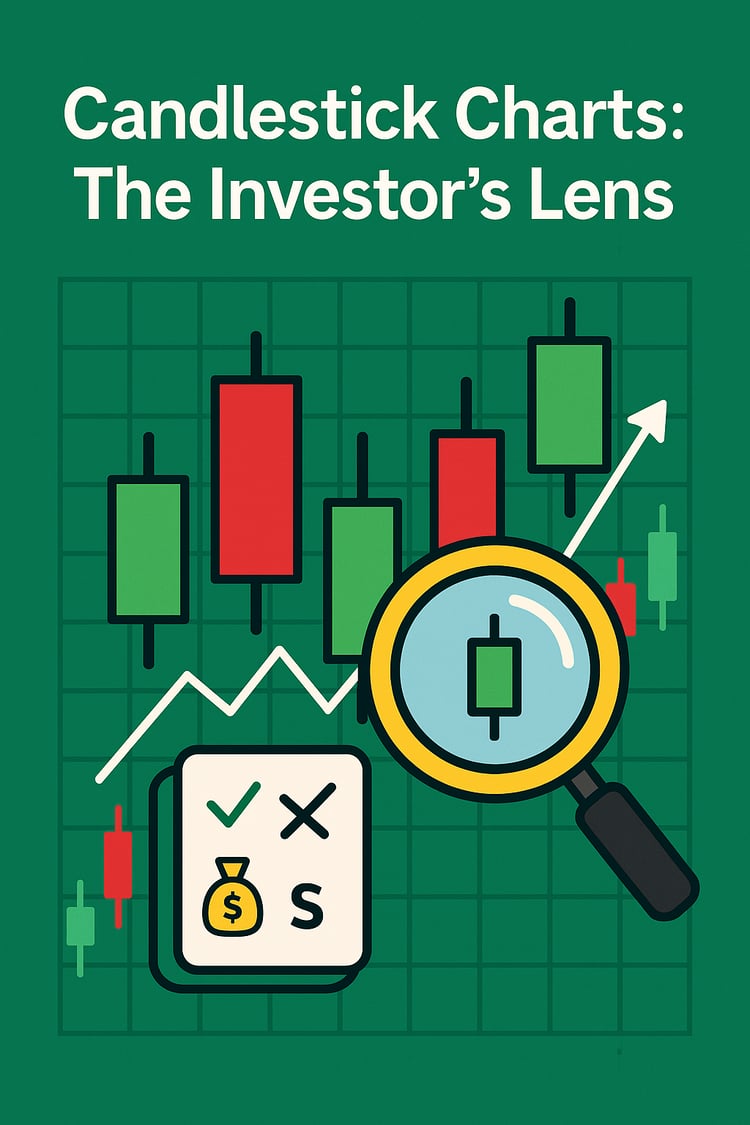
3. Candlestick Charts – The Investor’s Lens
If you’re building wealth beyond savings, you’ll meet candlestick charts. Common in stock trading, they display price movements in red, green, and white bars.
- Green candles = price going up (growth).
- Red candles = price going down (loss).
- Shadows (wicks) = volatility (how high or low the price moved).
Even if you’re not a trader, understanding candlesticks helps you:
- Recognize when to buy low and sell high.
- Avoid emotional decisions.
- Learn market trends that align with long-term investing.
In personal finance, these charts are like a magnifying glass for your investments.

4. Turning Data Into Strategy
Charts are not just pretty visuals; they guide decisions. Here’s how:
- Set saving targets: If your savings growth line flattens, you know it’s time to cut back expenses.
- Spot bad habits: A monthly bar chart might reveal that coffee or fast food is eating $200 of your budget.
- Project the future: Line graphs show how compound interest accelerates savings—helping you stay motivated.
By combining visual analysis with budgeting discipline, you transform money management into a strategy, not guesswork.

5. The Psychological Advantage
Humans are visual learners. When you see your finances in charts instead of raw numbers, it feels real. Watching your savings curve rise or your expense bar shrink gives you immediate motivation. This is why professional investors, companies, and financial advisors rely heavily on visuals—they turn abstract numbers into stories.
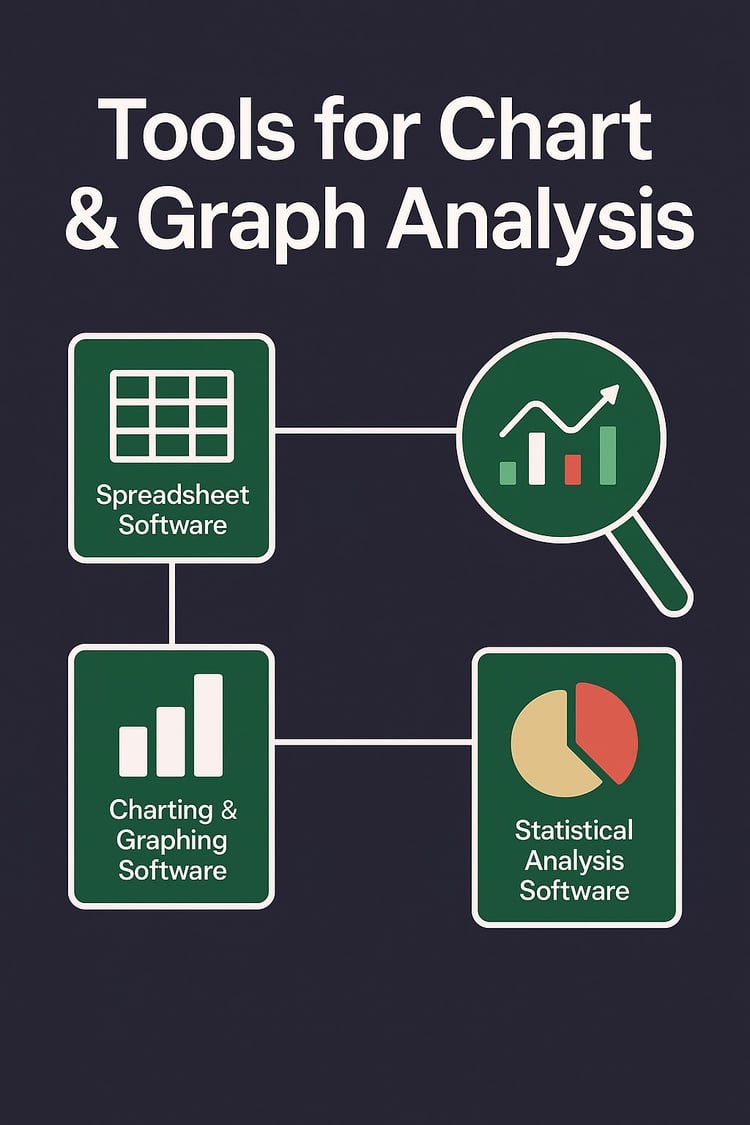
6. Tools for Chart & Graph Analysis
To start, you don’t need advanced software. Free and beginner-friendly tools include:
- Google Sheets / Excel → for pie charts and bar graphs.
- TradingView → for candlestick analysis.
- Mint, YNAB, or PocketGuard → automated budget and savings visuals.
Advanced users can use Power BI or Table, but for personal finance, simple tools are enough.
7. Action Plan: Apply Chart Analysis Today 🚀
Here’s how you can get started right now:
- Create a Pie Chart of your monthly income allocation.
- Draw a Bar Graph comparing last 6 months of expenses.
- Plot a Line Graph of your savings growth.
- Explore Candlestick Charts if you invest in stocks or crypto.
- Review Weekly → don’t just create graphs once; use them as your compass.
When combined with budgeting discipline and compound interest, chart analysis becomes your ultimate strategy to achieve financial freedom.
➡️ Ready to turn data into strategy? Start now.
🔑 Conclusion
Financial mastery doesn’t come from luck or shortcuts. It comes from:
- Saving & Budgeting → controlling your money.
- Compound Interest → letting money grow automatically.
- Chart Analysis → making smarter investment decisions.
With the Saving Budget Pack, the Compound Interest Pack, and the Chart Analysis Pack, you’ll have the complete toolkit to move from beginner to confident investor.
Don’t wait for the “perfect time.” The best time to start was yesterday. The next best time is today.
➡️ Don’t just read about it—apply the strategy today