Automation templates & dashboards for Excel
Excel & Power BI tools that turn raw exports into clean, self-updating reports — no formulas, no manual work.

Excel & Power BI tools that turn raw exports into clean, self-updating reports — no formulas, no manual work.
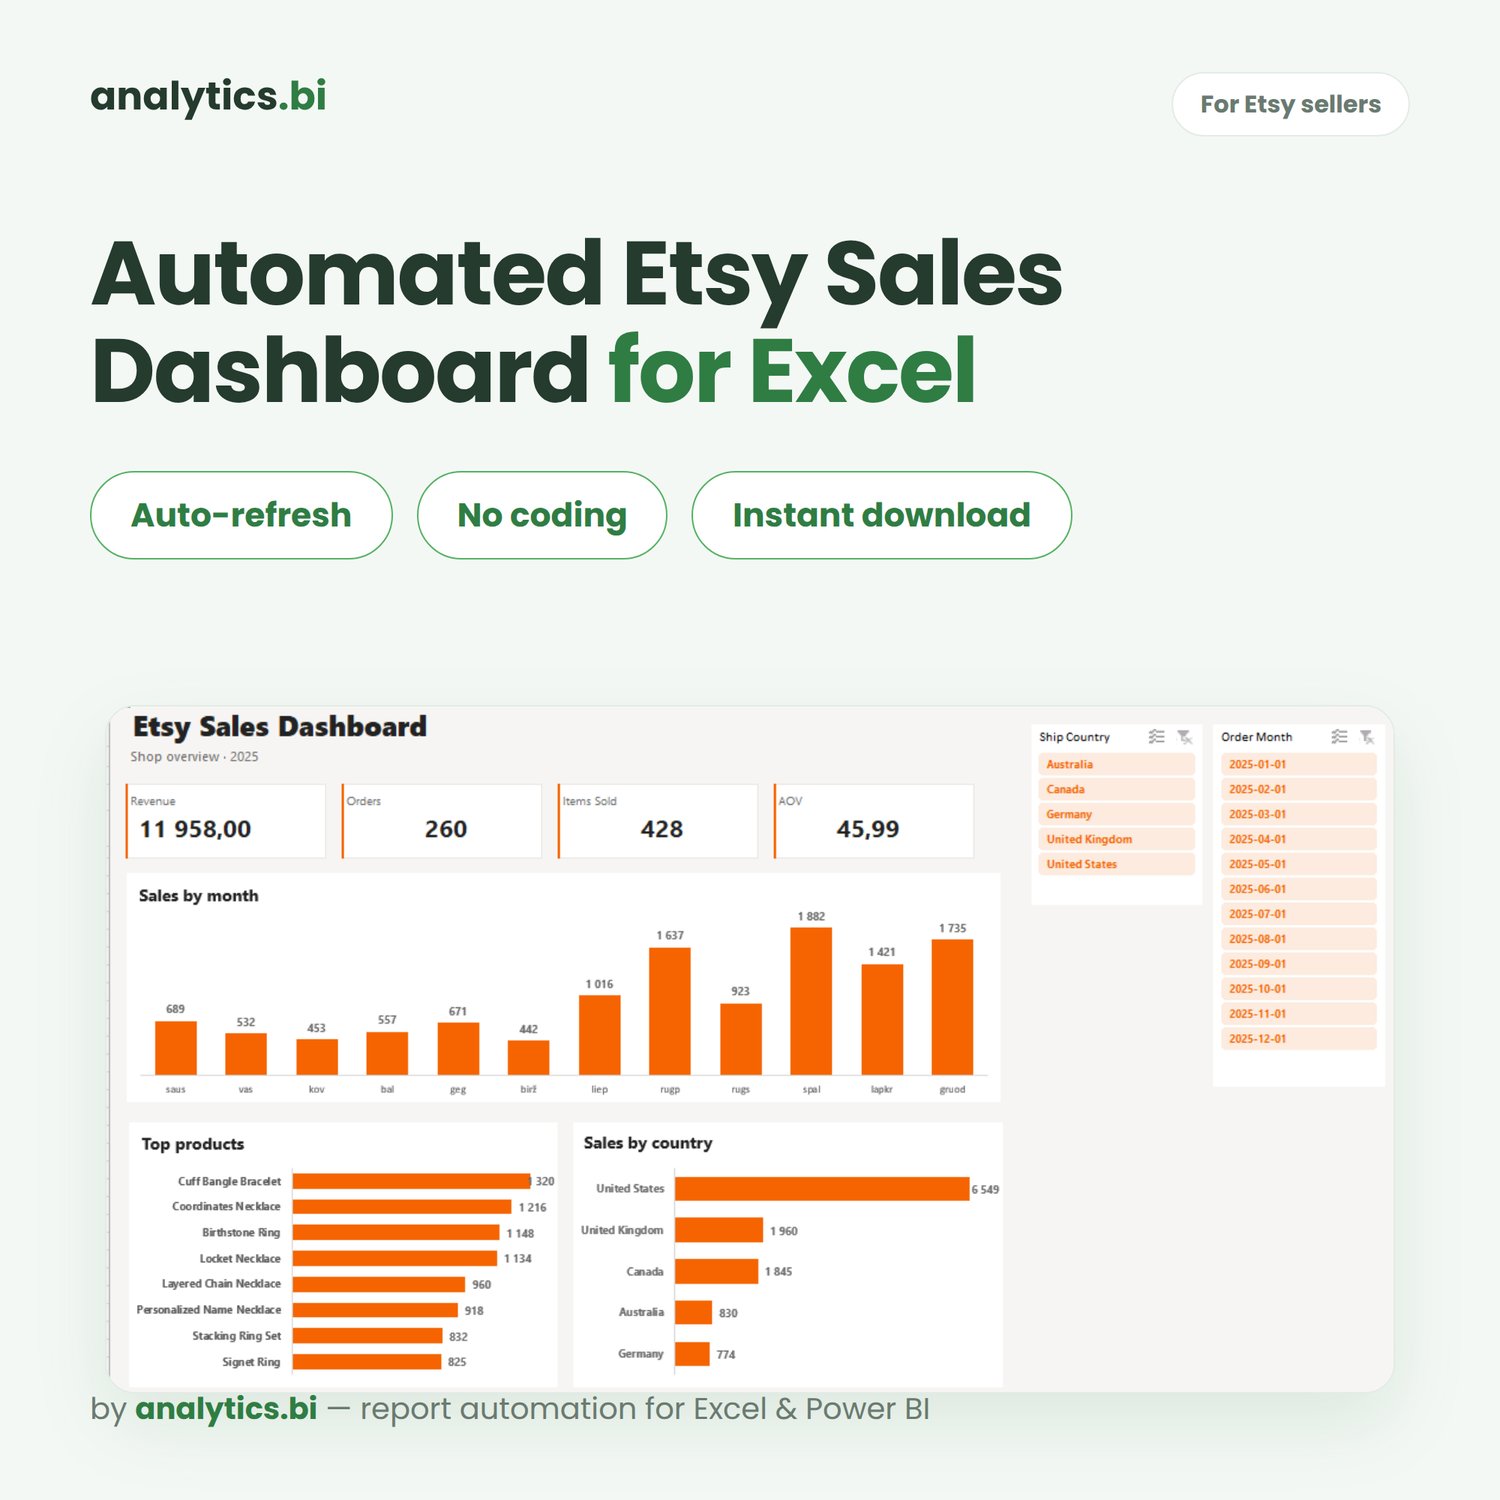
Stop copying numbers into spreadsheets by hand. This Excel dashboard turns your standard Etsy sales export into a clean, interactive report — automatically.
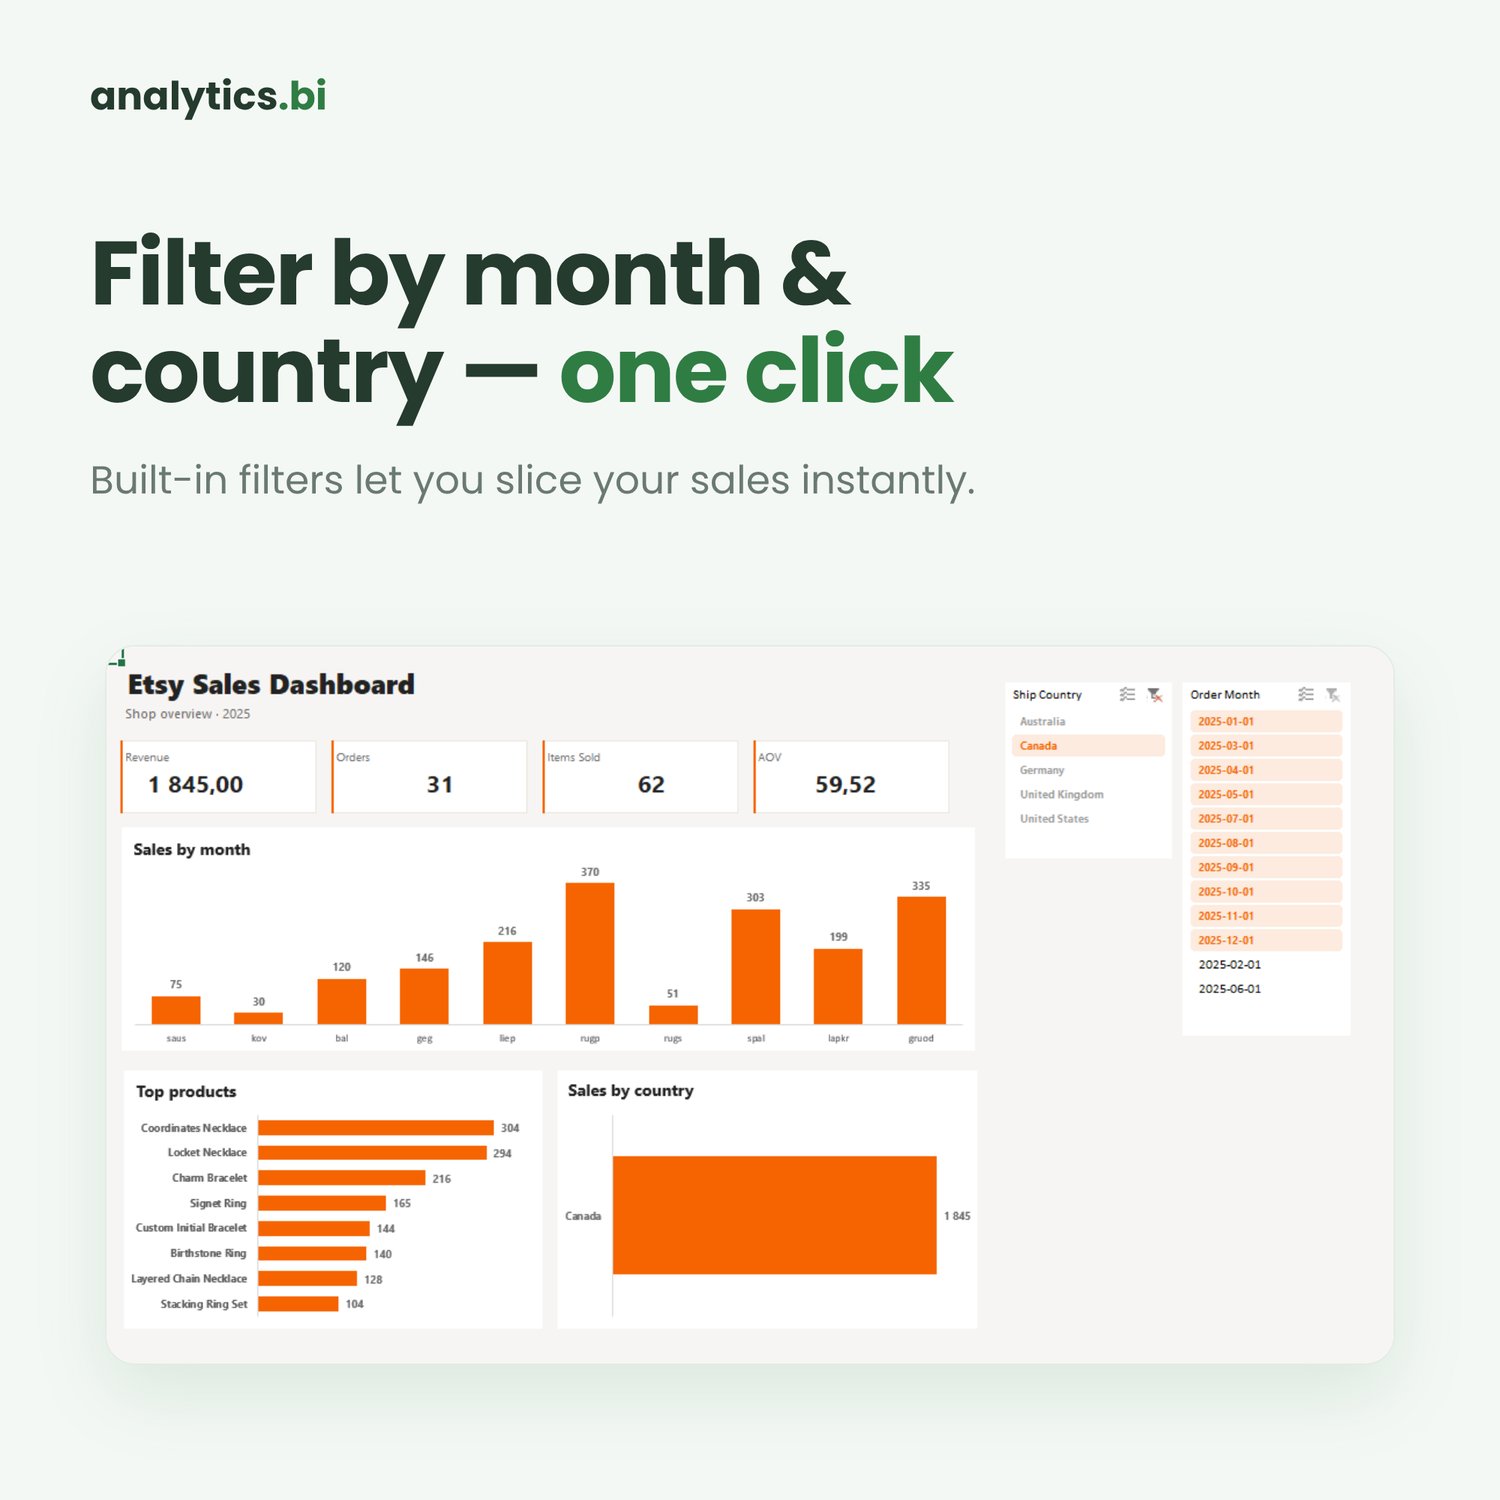
Download your data from Etsy, drop the file in a folder, click Refresh, and your whole shop is visualised: revenue, orders, items sold, average order value, best-selling products, monthly sales trend and sales by country. Filter by month or country with a single click.
WHY THIS IS DIFFERENT
Most Etsy trackers make you type every order in by hand. This one reads Etsy's own export file and updates itself. Get a fresh month of data? One click and every chart updates.
WHAT YOU GET
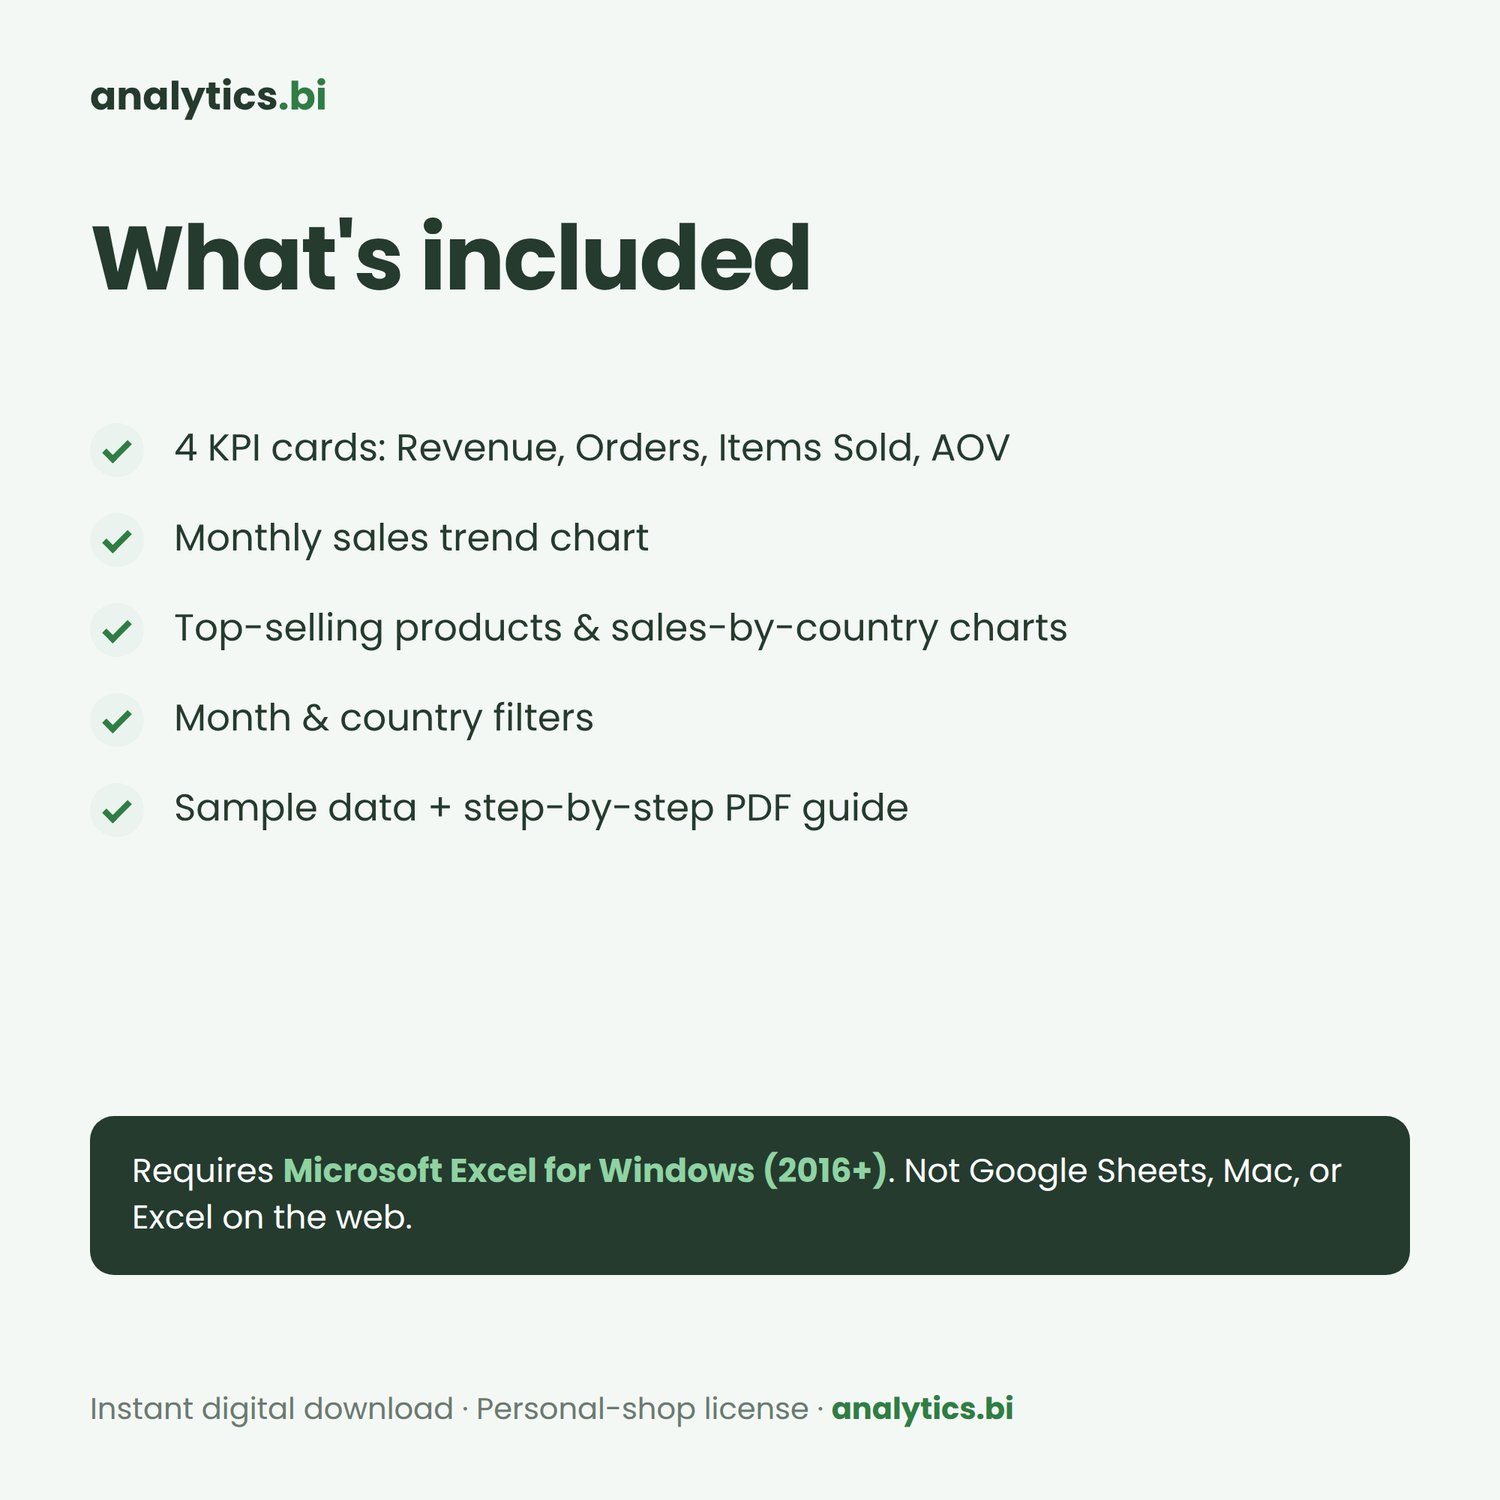
• Automated Etsy Sales Dashboard Excel workbook (.xlsx)
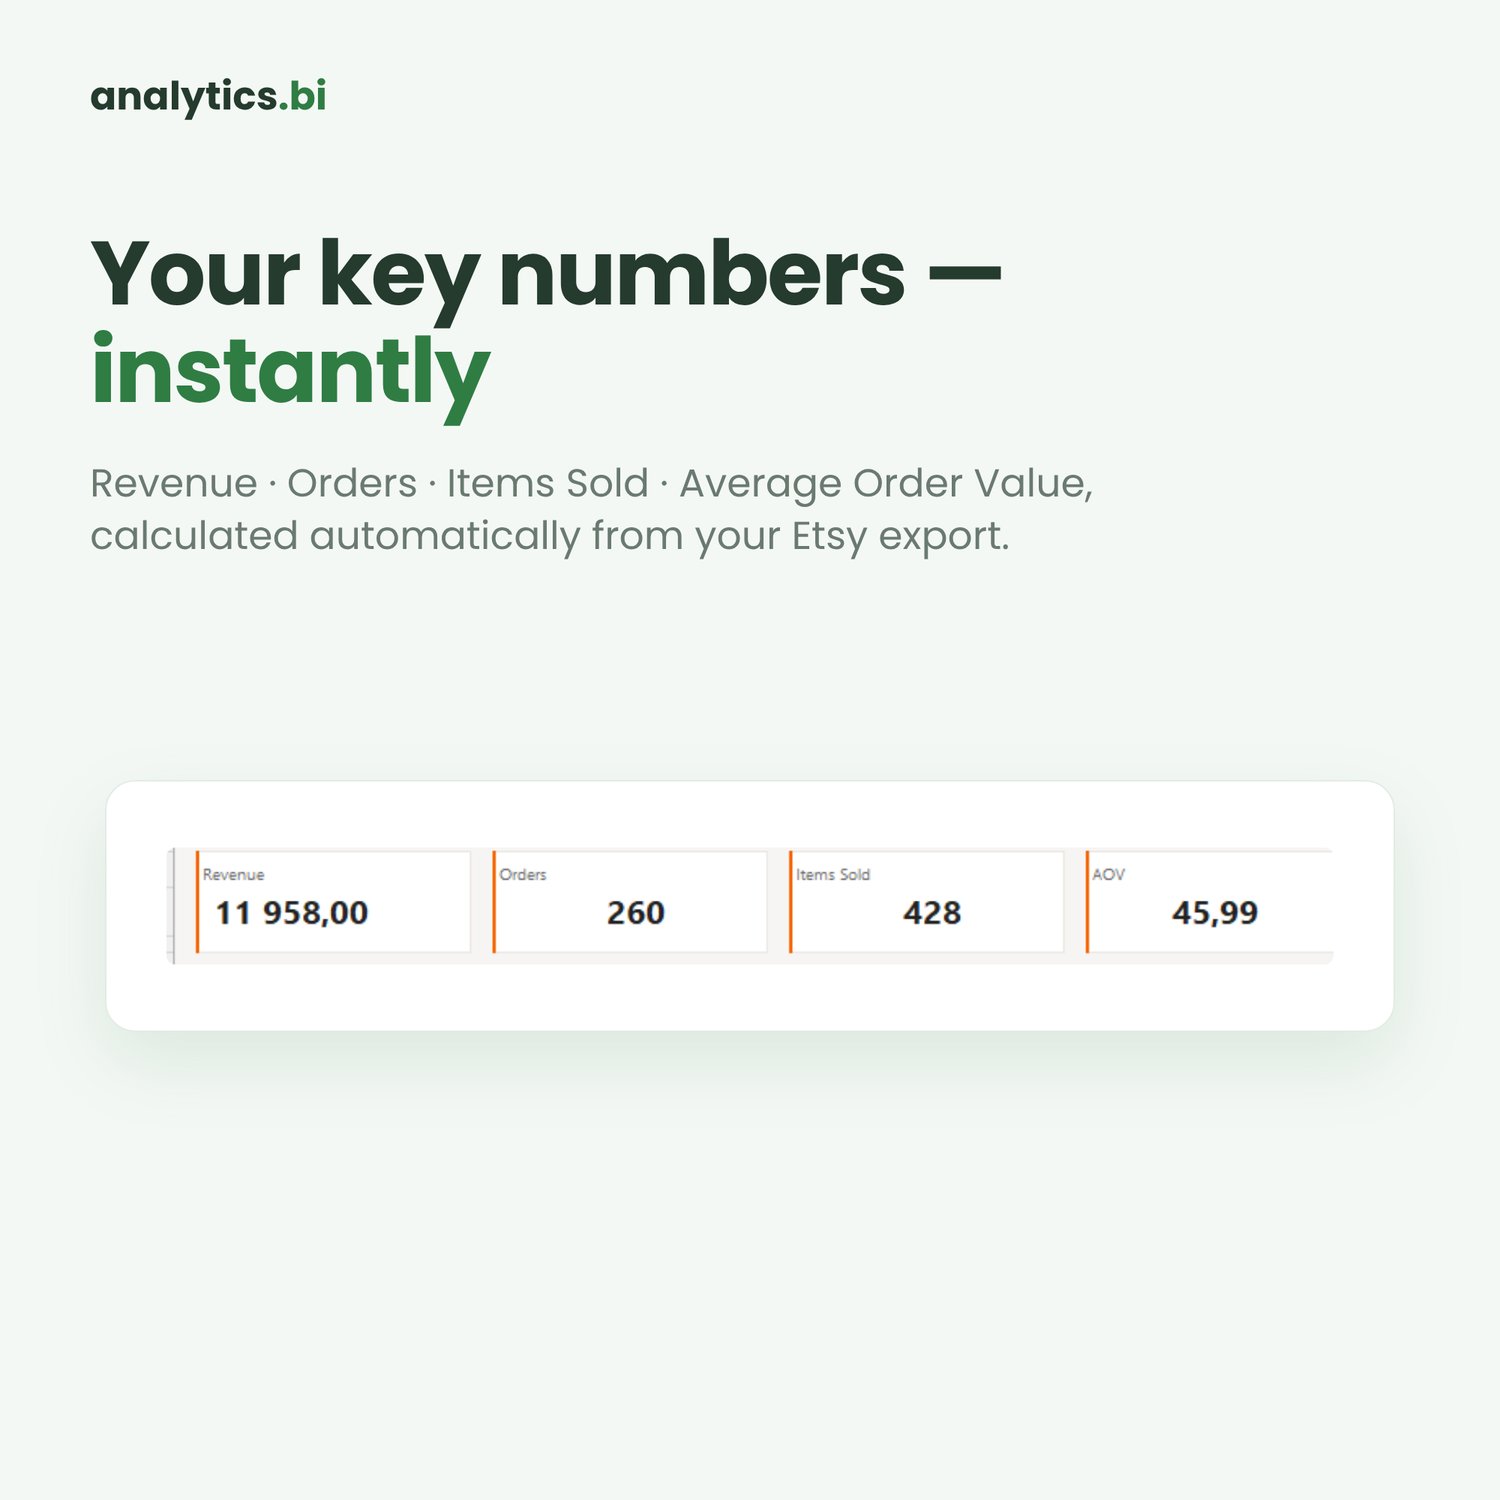
• 4 headline KPIs: Revenue, Orders, Items Sold, Average Order Value
• Monthly sales trend chart
• Top-selling products chart
• Sales by country chart
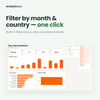
• Month and country filters that update the whole dashboard
• Sample data included, so it works the moment you open it
• Step-by-step PDF setup guide
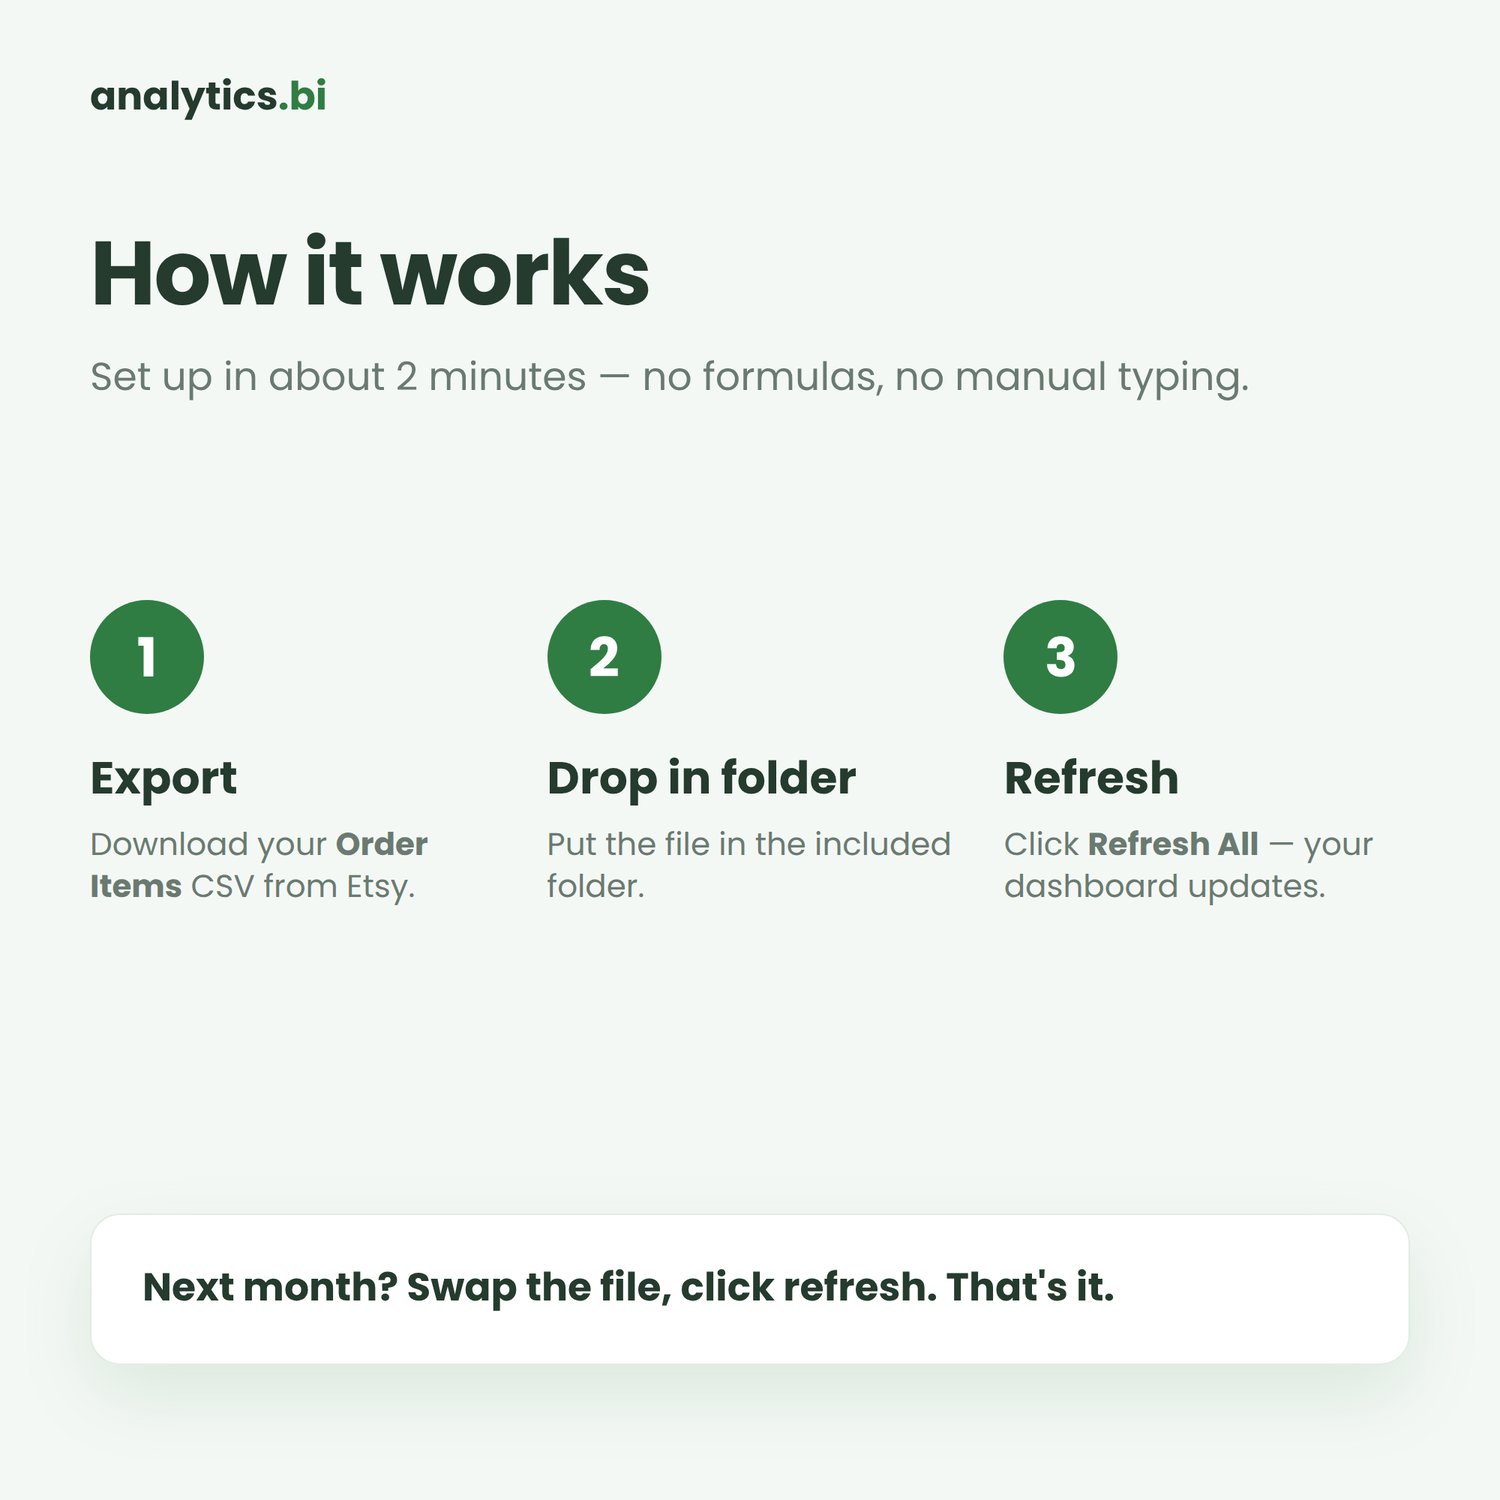
HOW IT WORKS (about 2 minutes to set up)
First, download your Order Items CSV from Etsy (Shop Manager, Settings, Options, Download Data).
Next, drop it into the included folder.
Then open the workbook and click Data, then Refresh All.
Every month after that, it is just one click to update.
REQUIREMENTS
• Microsoft Excel 2016 or later, for Windows (desktop app)
• Does NOT work in Google Sheets, on Mac, or Excel for the web (it uses Power Query and the Data Model)
INSTANT DOWNLOAD
You will receive a ZIP file with the dashboard, the setup folder, sample data and the PDF guide.
LICENSE
For your personal shop use only. Please do not resell, share or redistribute the file.
Questions or a hiccup during setup? Message me and I am happy to help you get it running.