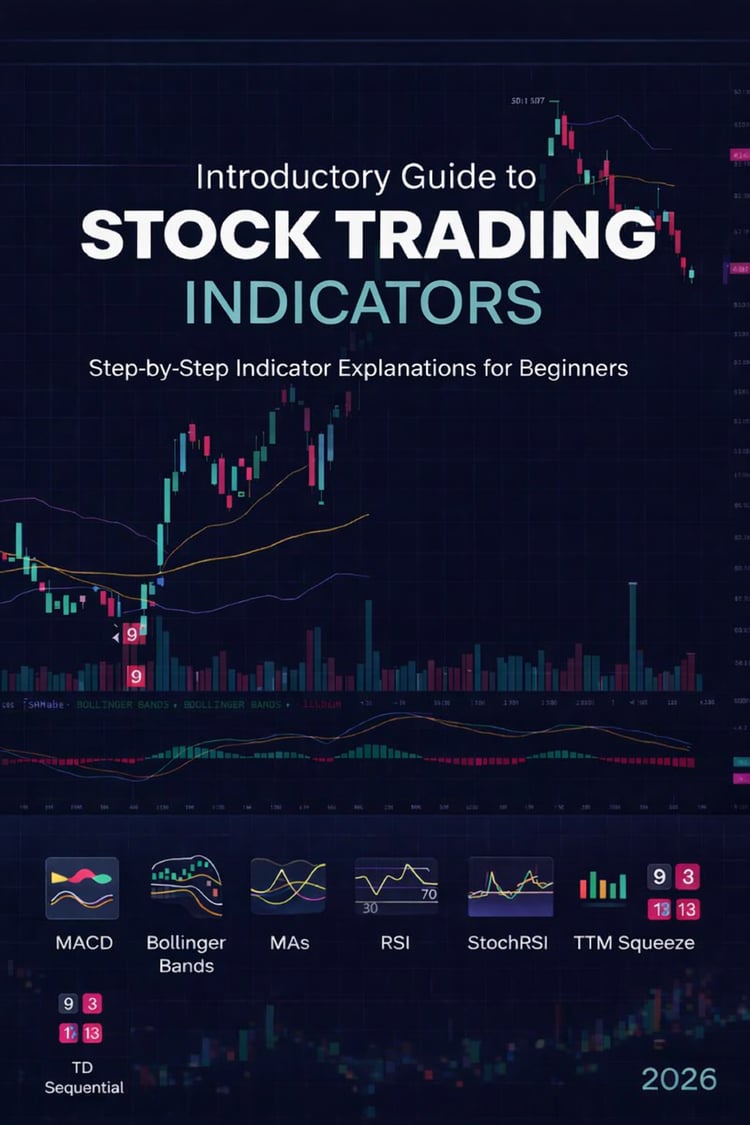
Stock Trading Indicators Guide
An Introductory, Step-by-Step Framework for Technical Analysis
The Stock Trading Indicators Guide is a structured, beginner-friendly introduction to technical analysis designed to help traders understand how indicators actually work, when to trust them, and how to use them together.
This guide walks you through the entire charting process from start to finish — beginning with how to choose the right stock and timeframe, and ending with advanced confirmation tools used by active traders.
Rather than presenting indicators as isolated signals, this guide focuses on context, confirmation, and probability, helping you avoid common beginner mistakes like chasing overbought conditions or trading against the trend.
What’s Inside
You’ll learn how to properly apply and interpret:
- MACD for momentum and trend transitions
- Moving Averages (10, 50, 200) to define market structure and bias
- Bollinger Bands to understand volatility and mean reversion
- Stochastic RSI for precise entry timing
- TTM Squeeze to identify volatility compression and breakout setups
- RSI for momentum strength, divergence, and trend confirmation
- TD Sequential to spot trend exhaustion and reversal risk
Each indicator section explains:
- What the indicator measures
- Key signals and levels that matter
- How traders actually use it in real markets
- Common mistakes to avoid
- How it fits into a multi-indicator system
Who This Guide Is For
- New traders building a technical foundation
- Self-taught traders seeking structure and clarity
- Traders who want to stop relying on single-indicator signals
- Anyone looking to understand why trades work — not just where to click
What This Guide Is Not
This is not a signal service, alert system, or get-rich-quick strategy. It is an educational framework designed to help you read charts more effectively and make more informed trading decisions.
Clear. Practical. Structured.
A solid starting point for traders who want to learn indicators the right way.