

This week, I'll review the key points of my trades, focusing on the ones I executed.
4h Chart

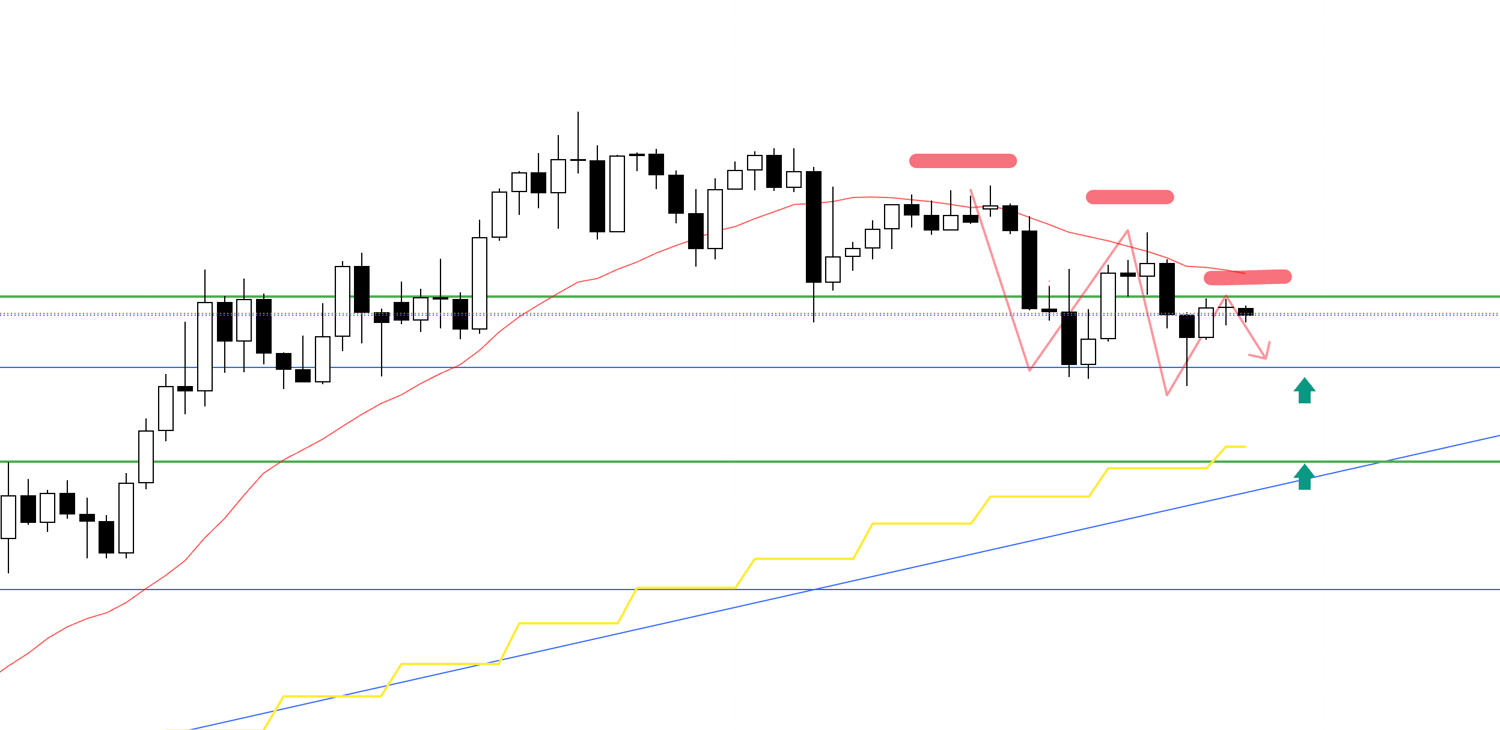
This is the USDJPY 4h chart.
The week started from this blue line.
Personally, there were two points where I considered trading USDJPY, marked by rectangles.
Next, let's look at EURUSD.
4h Chart
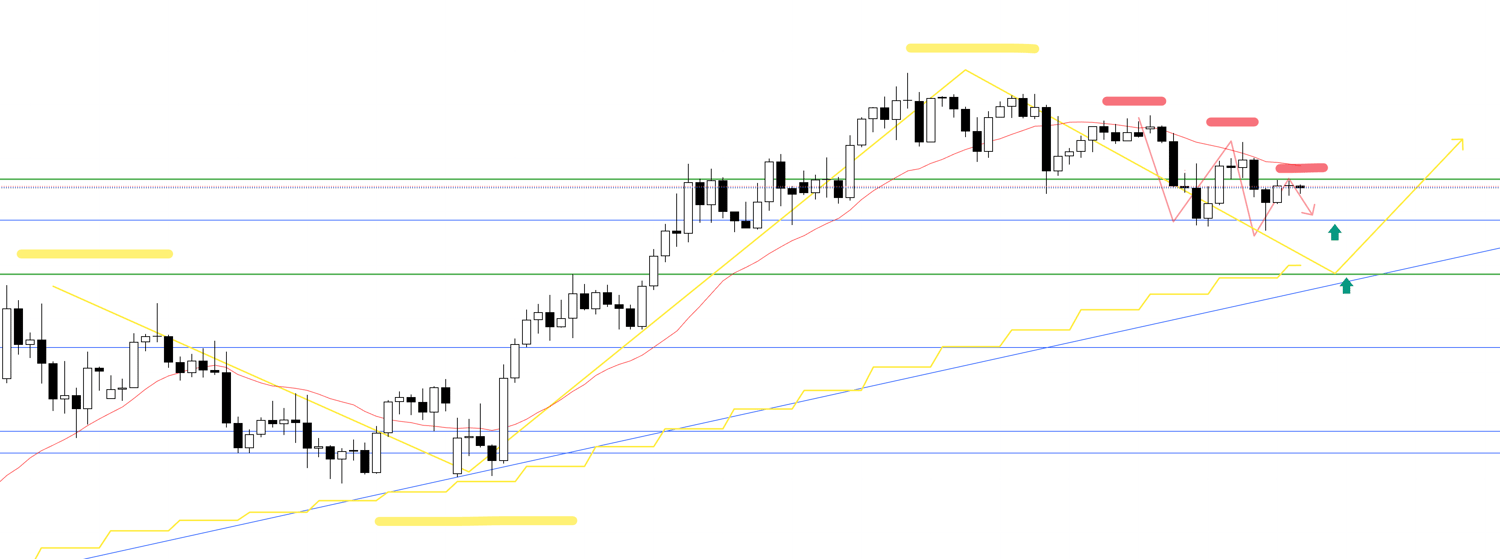
This is the EURUSD 4h chart.
Similarly, the movements after the blue vertical line represent this week's action.
This week, there were two points where I considered trading EURUSD, marked by rectangles.
I usually trade only USDJPY and EURUSD, so this week there were a total of four points where my rules suggested considering trades.
By the way, my approach is trend-following with buying dips and selling rallies on the 4h chart.
Actual trades are executed on lower timeframes like the 1h or 15m charts.
For details on these strategies, please refer to my previous posts on Dow Theory and multi-timeframe analysis.
Now, I'll share screenshots taken in real-time during trades or before, along with what I was reading from the charts at that moment, presented like a trade journal. This will show how I apply rules and make decisions to trade (or skip).
Just to be clear, this article isn't about bragging over winning trades, nor is it meant to hype or provoke anything—and I have no interest in that sort of thing.
I'd appreciate it if you could take it as a reference for how I approach thinking and executing the process.
Regardless of wins or losses, even the trades I skipped hold meaning, and I've picked out all the key elements, including those.
I hope this helps you see how I analyze charts in real-time, build scenarios, and execute trades.
Reading this alongside my Sunday weekly trade scenarios should make it easier to understand.
〜・〜・〜・〜・〜・〜・〜・〜・〜・〜・〜・〜・〜・〜・
July 7 (Monday) USDJPY
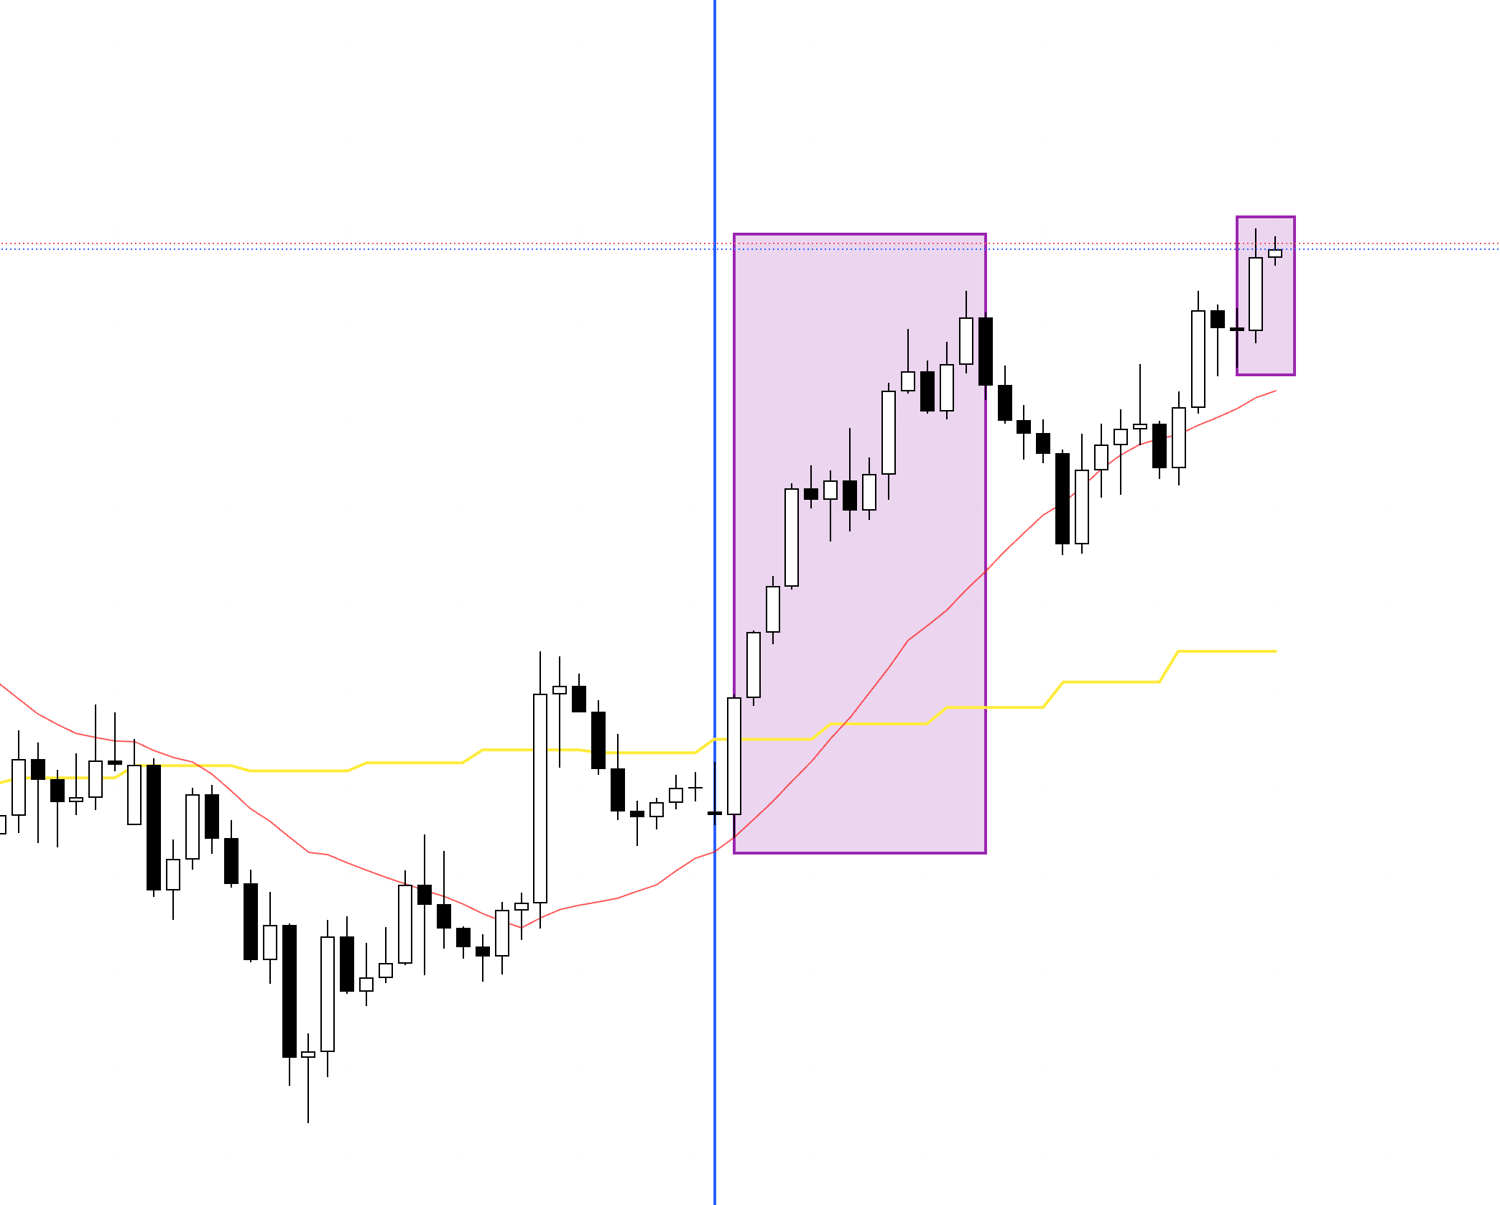
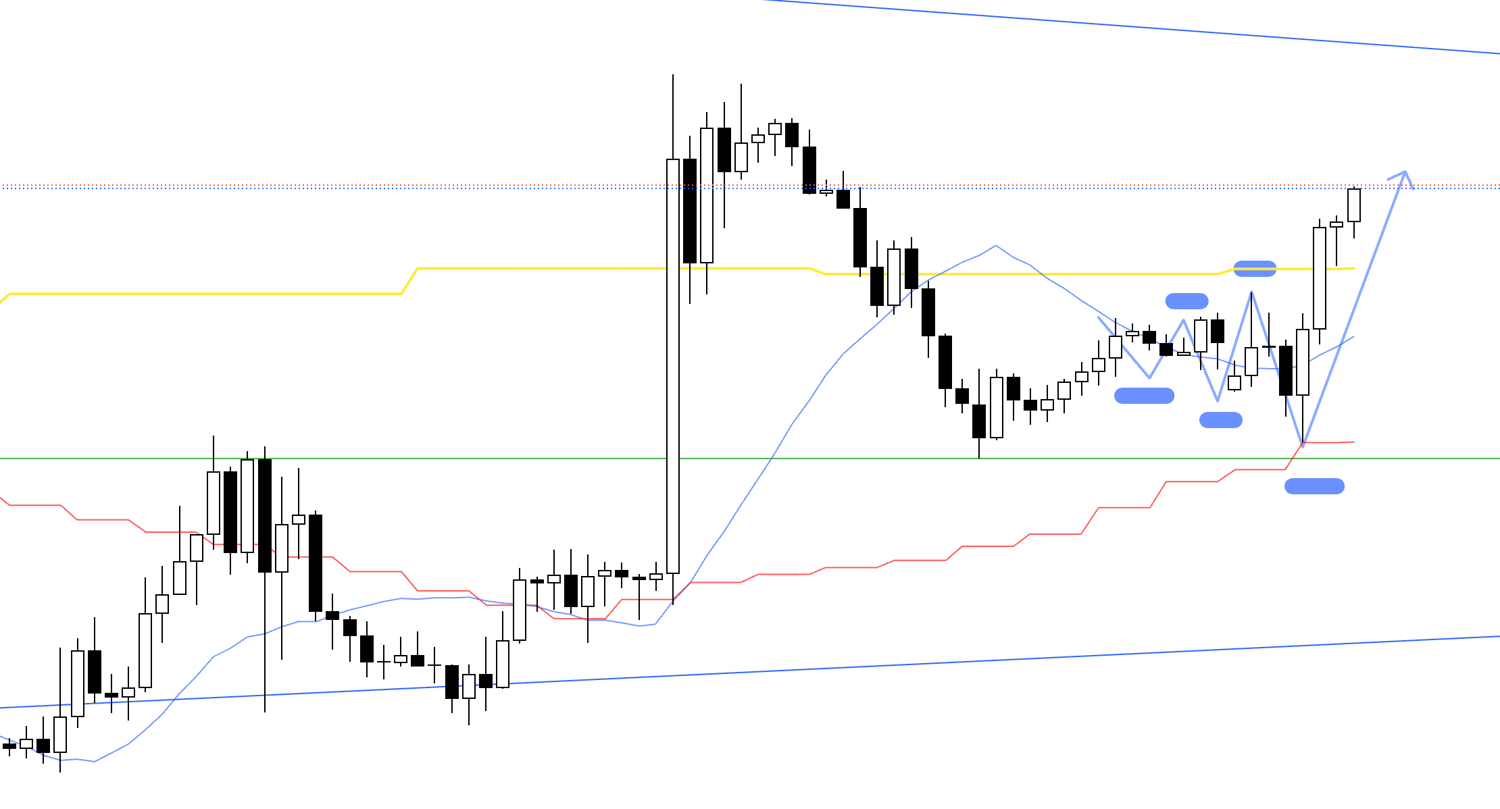
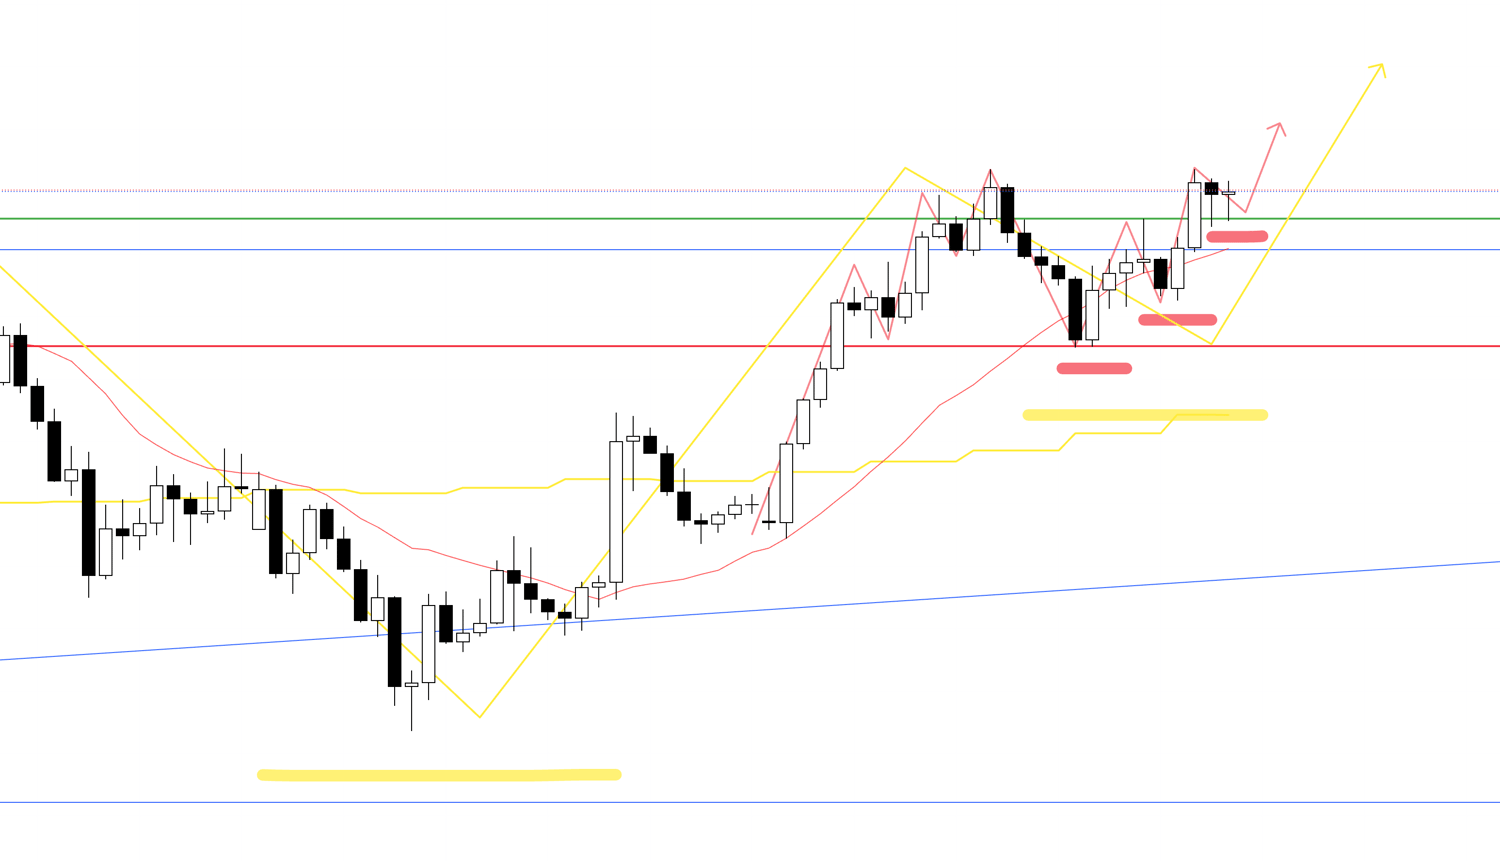
Below is the USDJPY 4h chart.
It started from the buy scenario 1 I outlined in Sunday's trade scenarios.
4h Chart
On the 4h chart, it's firmly supported at the green line where buyers and sellers switch, forming a double bottom and breaking the recent high.
4h Chart
Breaking this purple line confirms the double bottom by surpassing the recent high.
This is a 4h point where it breaks the high that started the previous downtrend, triggering sellers' SLs or trailing stops, then forming the first pullback.
If it updates highs and raises lows here, the upside potential becomes very strong.
So, let's check the lower timeframe, the 1h chart.
1h Chart
However, on the 1h chart, it lowers lows then updates highs, and updates highs then lowers lows, so I couldn't enter.
If the chart had looked like the one below, I might have considered entering.
1h Chart
If the 1h chart updates highs without lowering lows, it confirms the low raise within the 4h low raise point, so I'd consider entry.
This time, it updated highs all at once without raising lows, so personally, I couldn't enter.
In such cases, it's important not to force an entry but to build a scenario for the next pullback and patiently wait for the next opportunity.
〜・〜・〜・〜・〜・〜・〜・〜・〜・〜・〜・〜・〜・〜・
July 7 (Monday) EURUSD
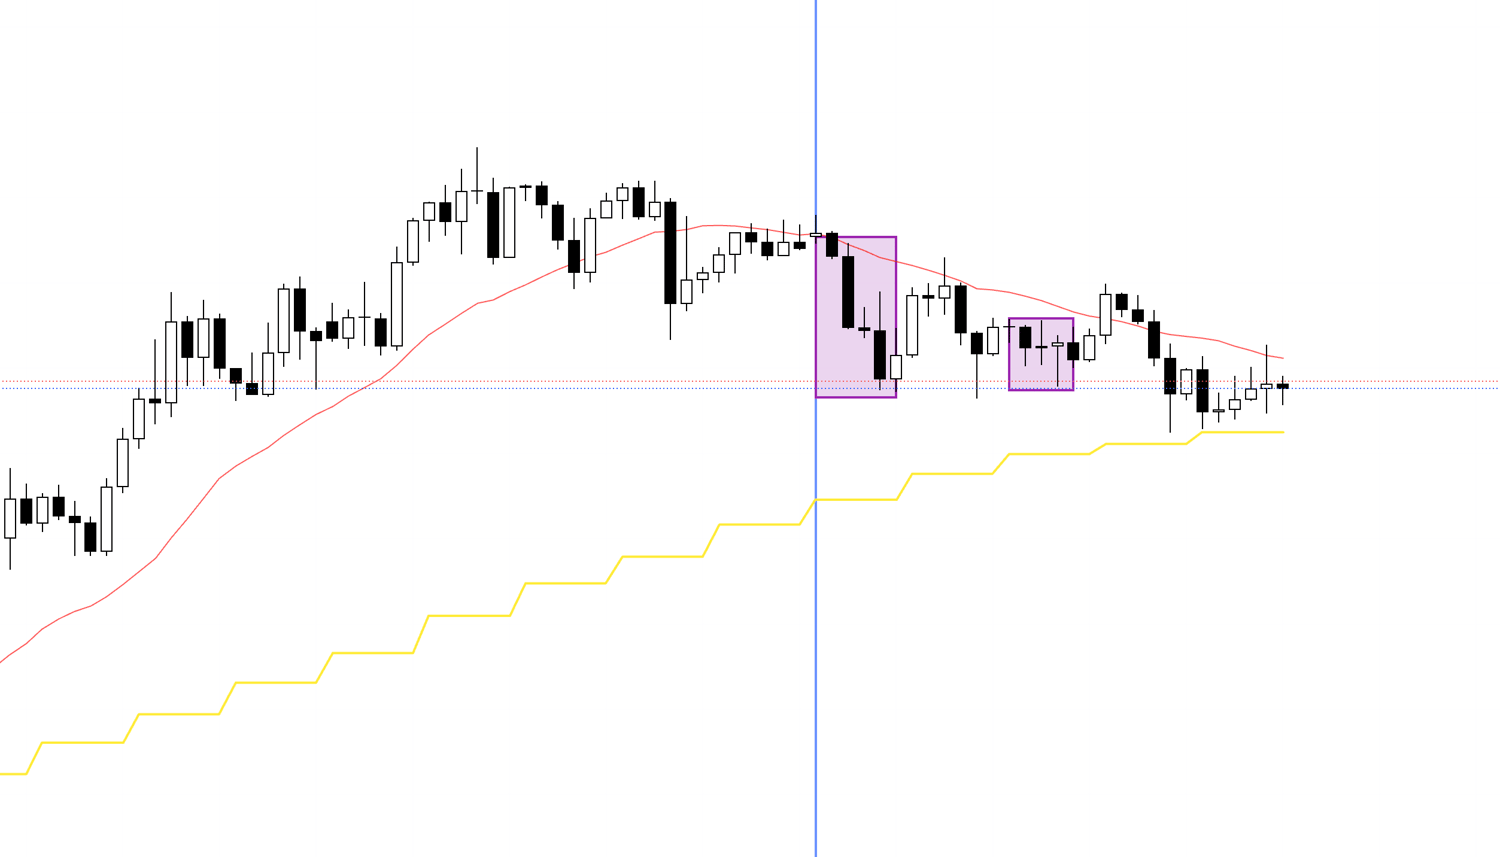
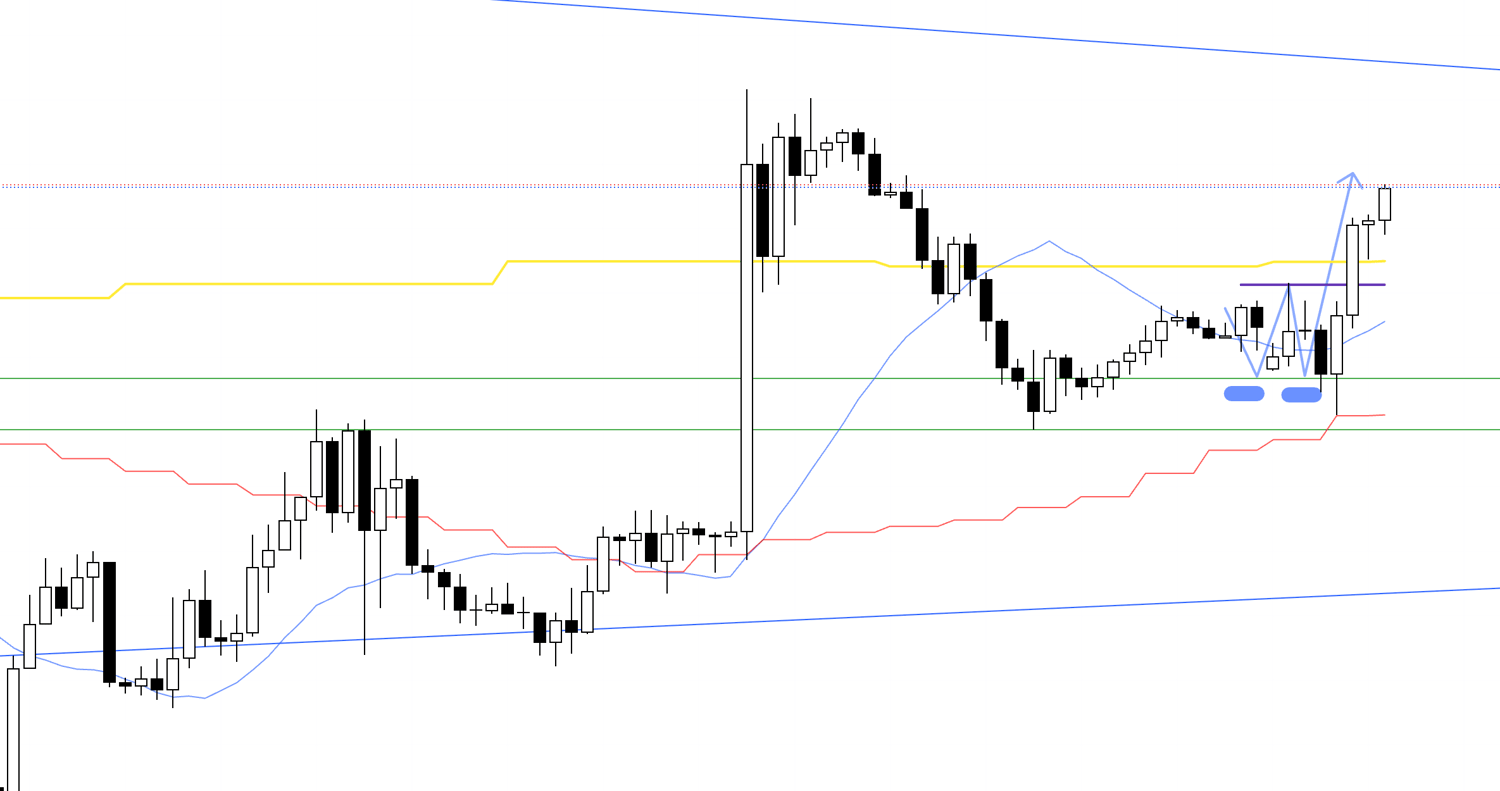
4h Chart
EURUSD also started from the sell scenario 1 in the weekend scenarios on the 4h chart.
Updating the recent low on 4h would confirm high lowering and enter a downtrend.
Let's check the 1h.
1h Chart
On the 1h chart, within the right-side high of the 4h high-lowering point, it's lowering highs while trying to update lows.
The low update point is the purple line, same as the 4h low update point.
Breaking below here greatly increases downside potential.
If it breaks this line, I must sell, so I need to place an entry order.
1h Chart
Later, it actually broke below the low line.
Looking at this on the lower 15m timeframe:
15m Chart
It neatly confirms high lowering with a double top on 15m, within the right-side high of the 1h, which is within the right-side high of the 4h.
This is how I grasp charts across multiple timeframes.
This entry point overlaps high lowering and low updating on 4h, 1h, and 15m, triggering many orders.
It's a highly advantageous point.
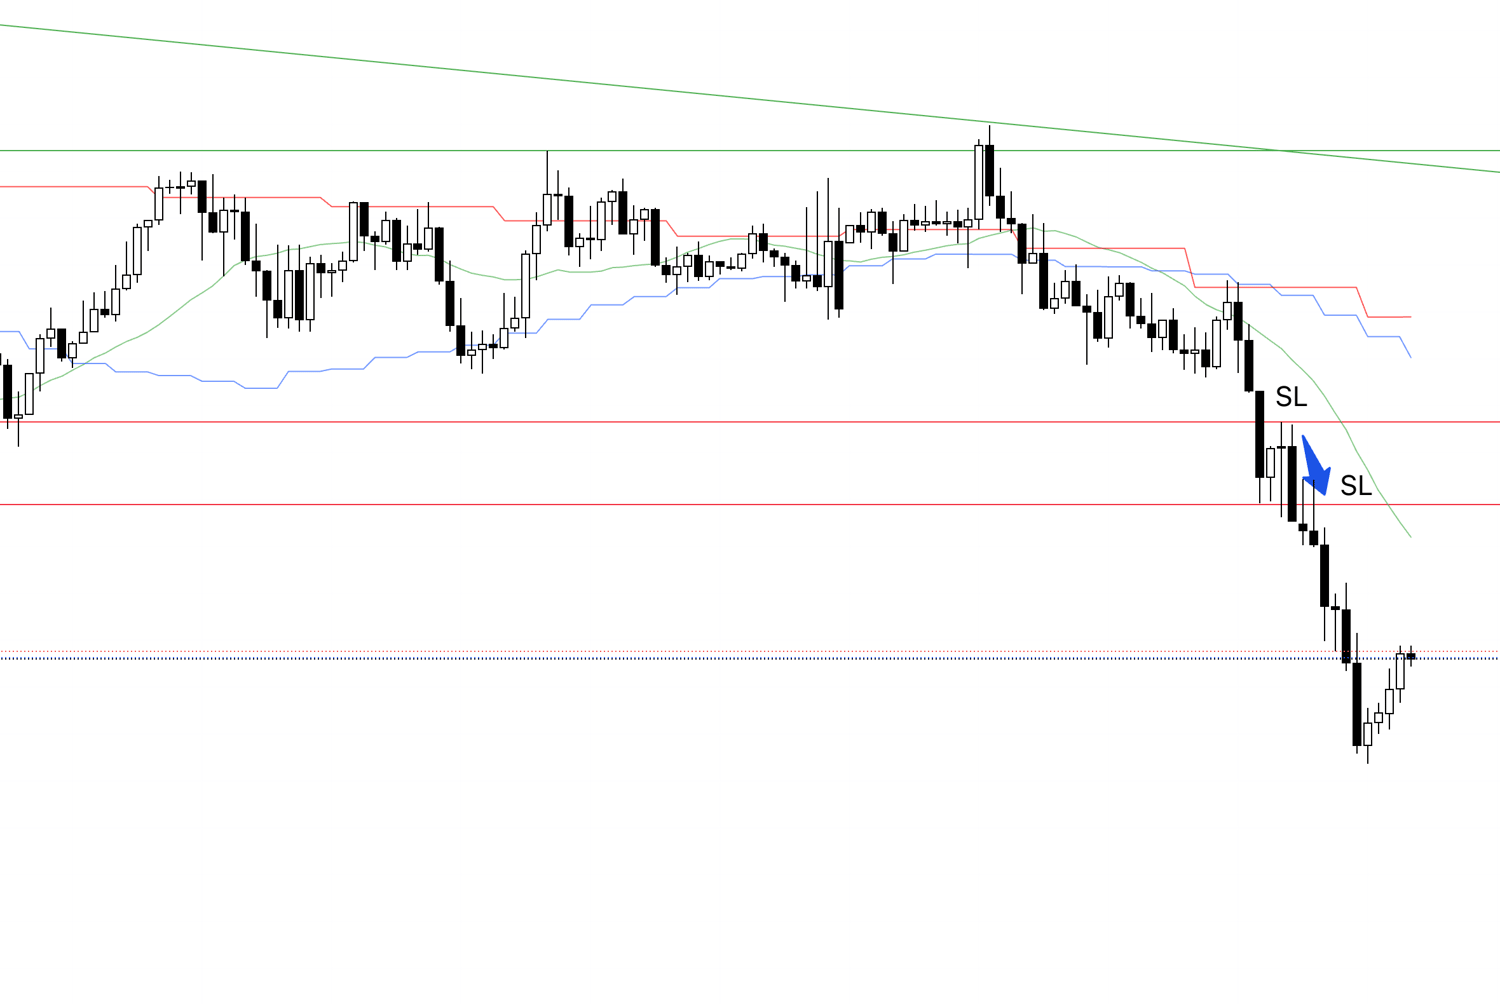
I placed an entry order below this purple line and set SL at the overlapping recent highs on 1h and 15m, waiting for execution.
This SL point is the high-lowering basis for my entry, so breaking above invalidates it, leading to a stop-loss.
Afterward, I plan to hold until the trend breaks on 15m per Dow Theory.
15m Chart
At this stage, I lowered the SL one level.
As long as it updates lows while lowering highs, I'll trail the stop for trend-following.
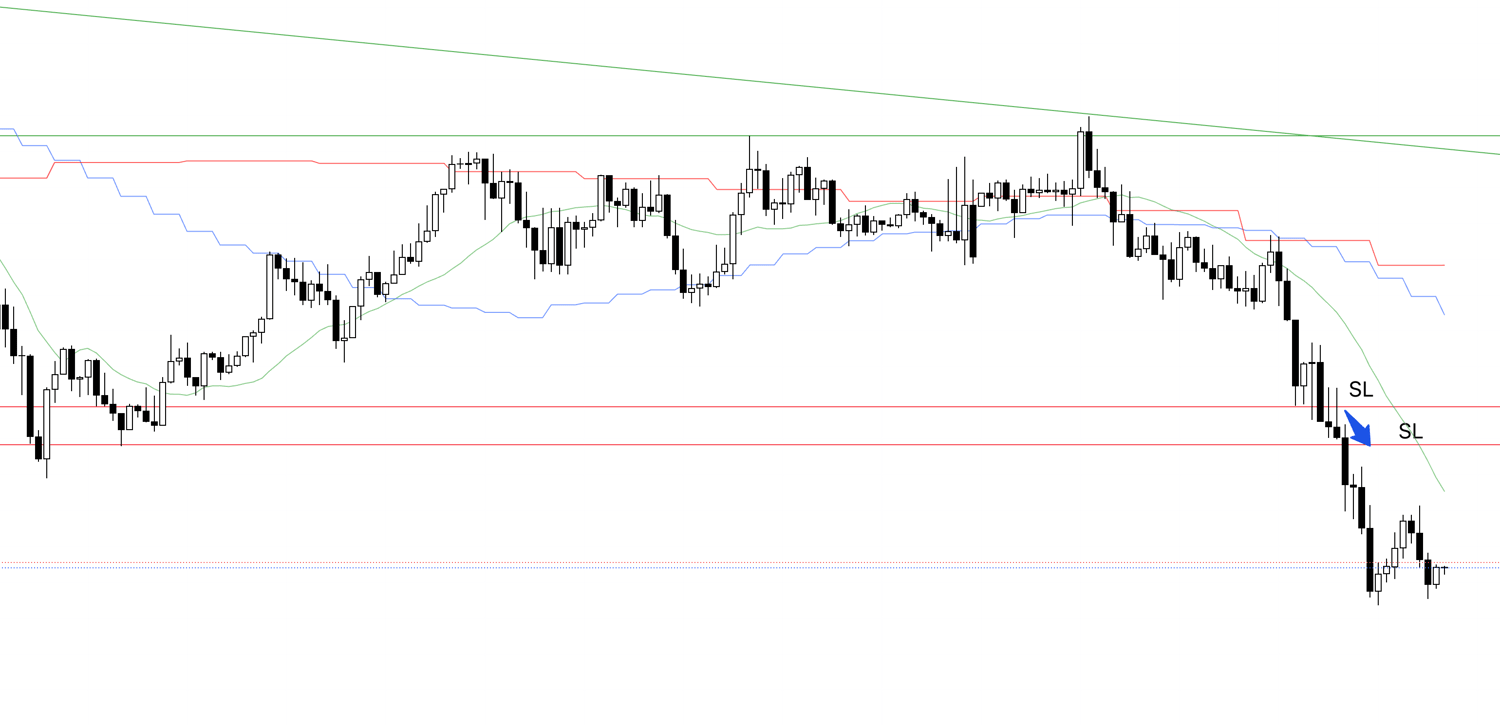
15m Chart
Then, I lowered the SL another level.
15m Chart
15m Chart
15m Chart
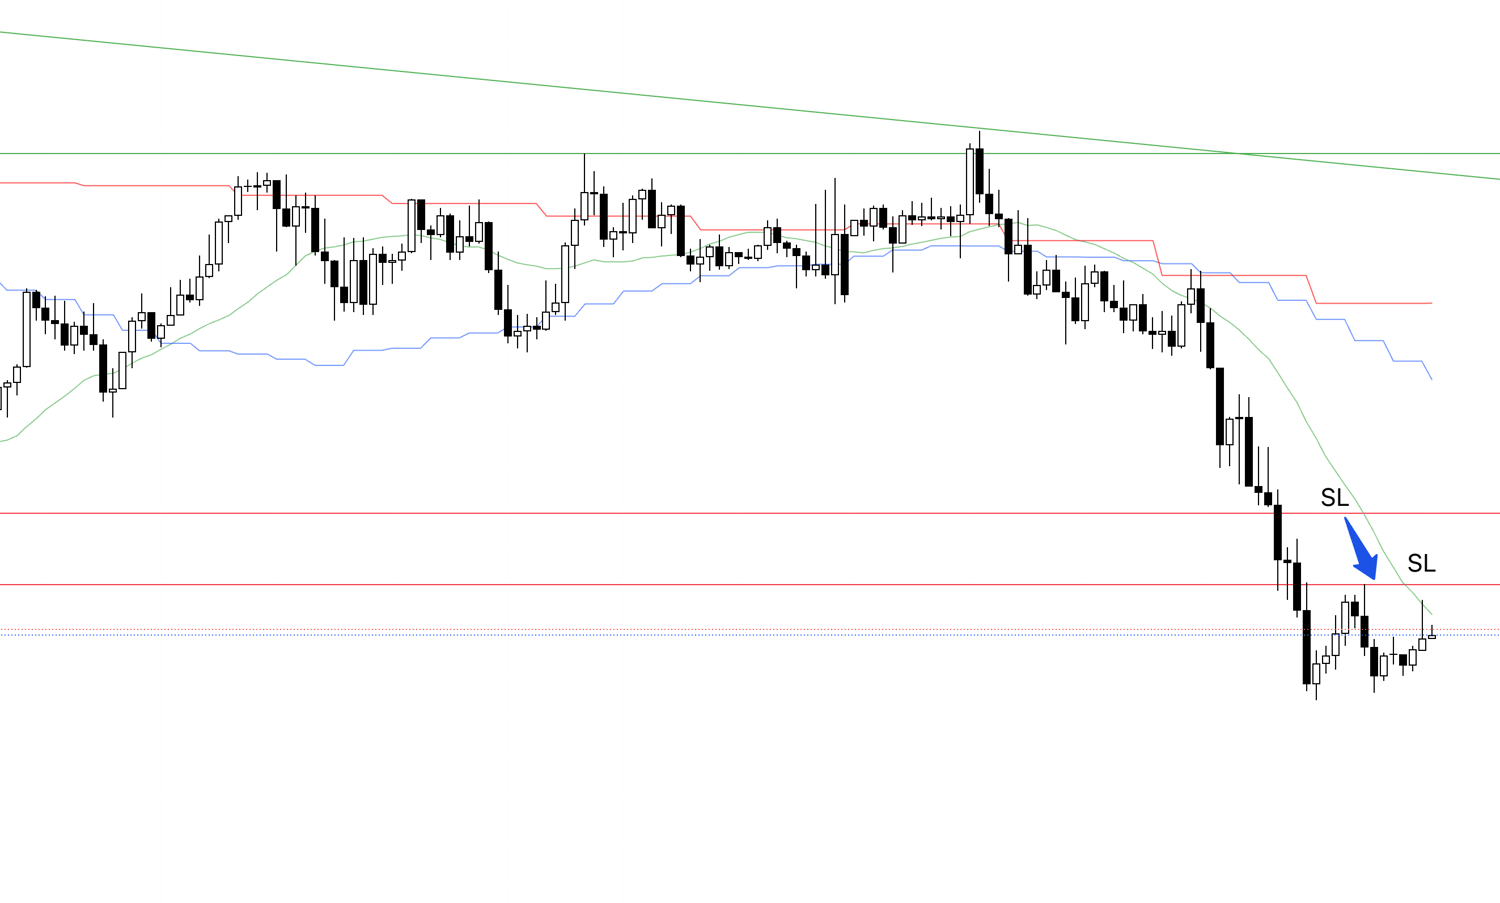
I lowered the SL one more level after this, but since I did it on my phone while out, no PC screenshot—sorry.
Later, a close notification came on my phone; it hit the trailing stop, ending the trade.
15m Chart
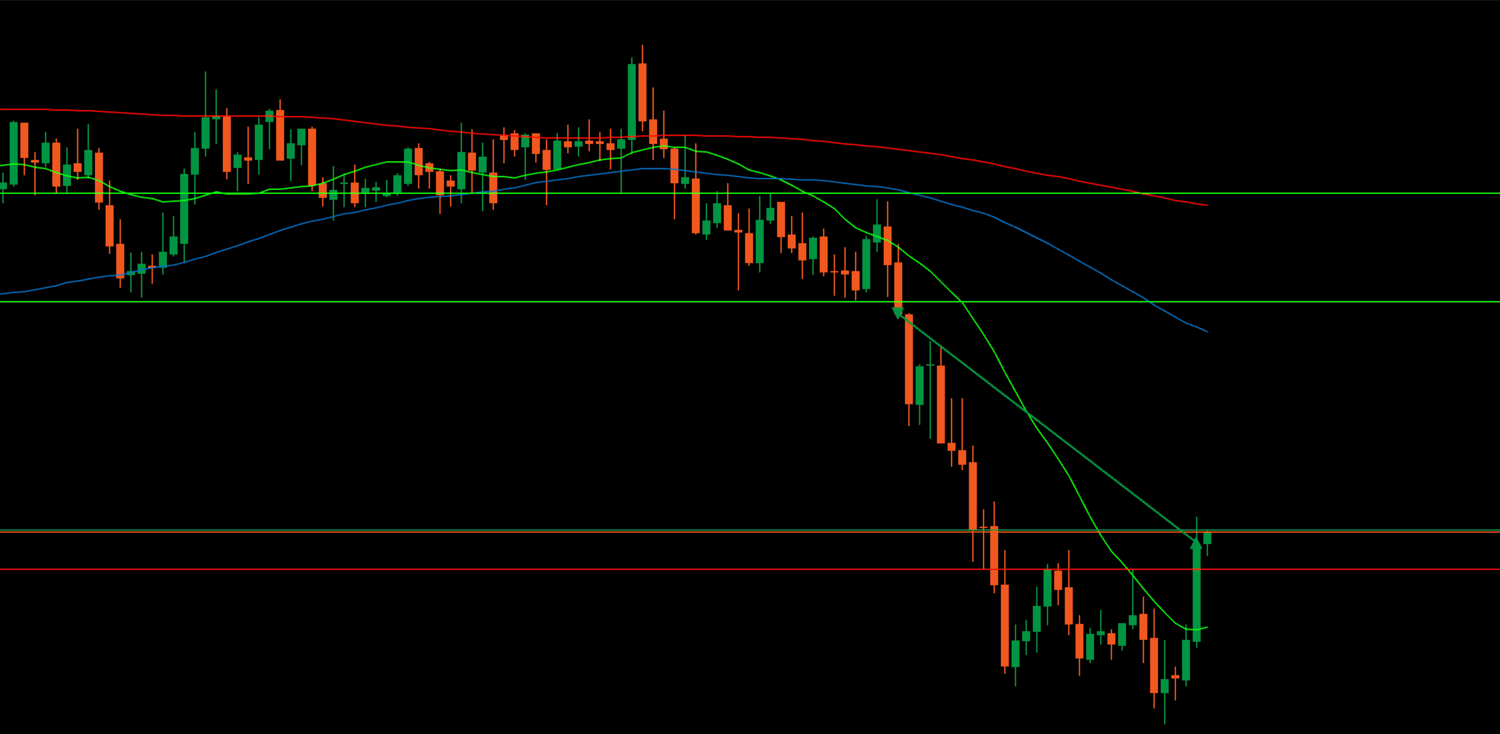
This is the actual 15m chart on cTrader where I placed the order; it hit the trailing stop (SL) after breaking the recent high and breaking the trend, closing the trade.
15m Chart

In summary, this was the trade.
〜・〜・〜・〜・〜・〜・〜・〜・〜・〜・〜・〜・〜・〜・
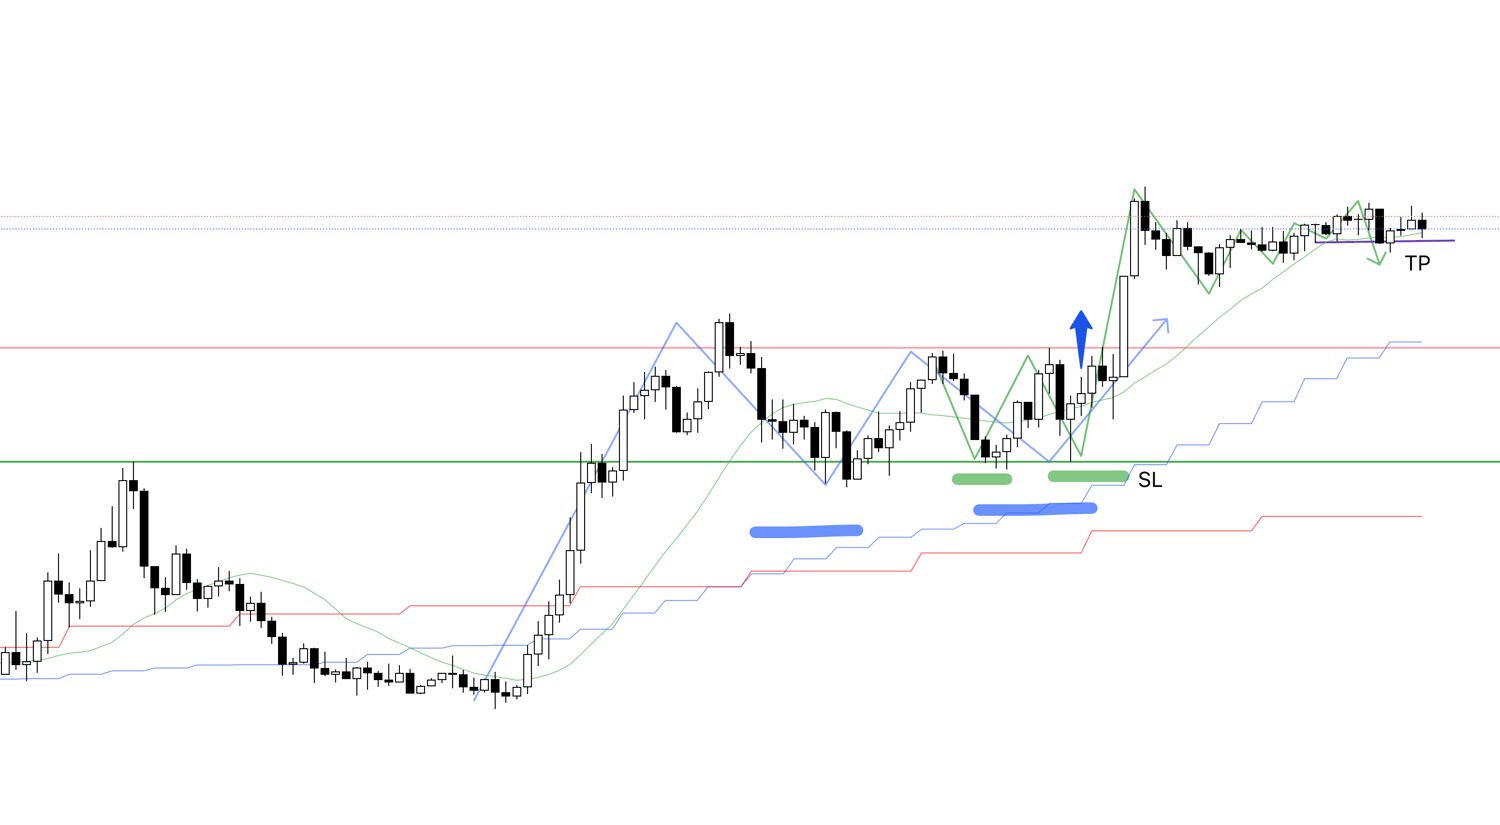
July 9 (Wednesday) EURUSD
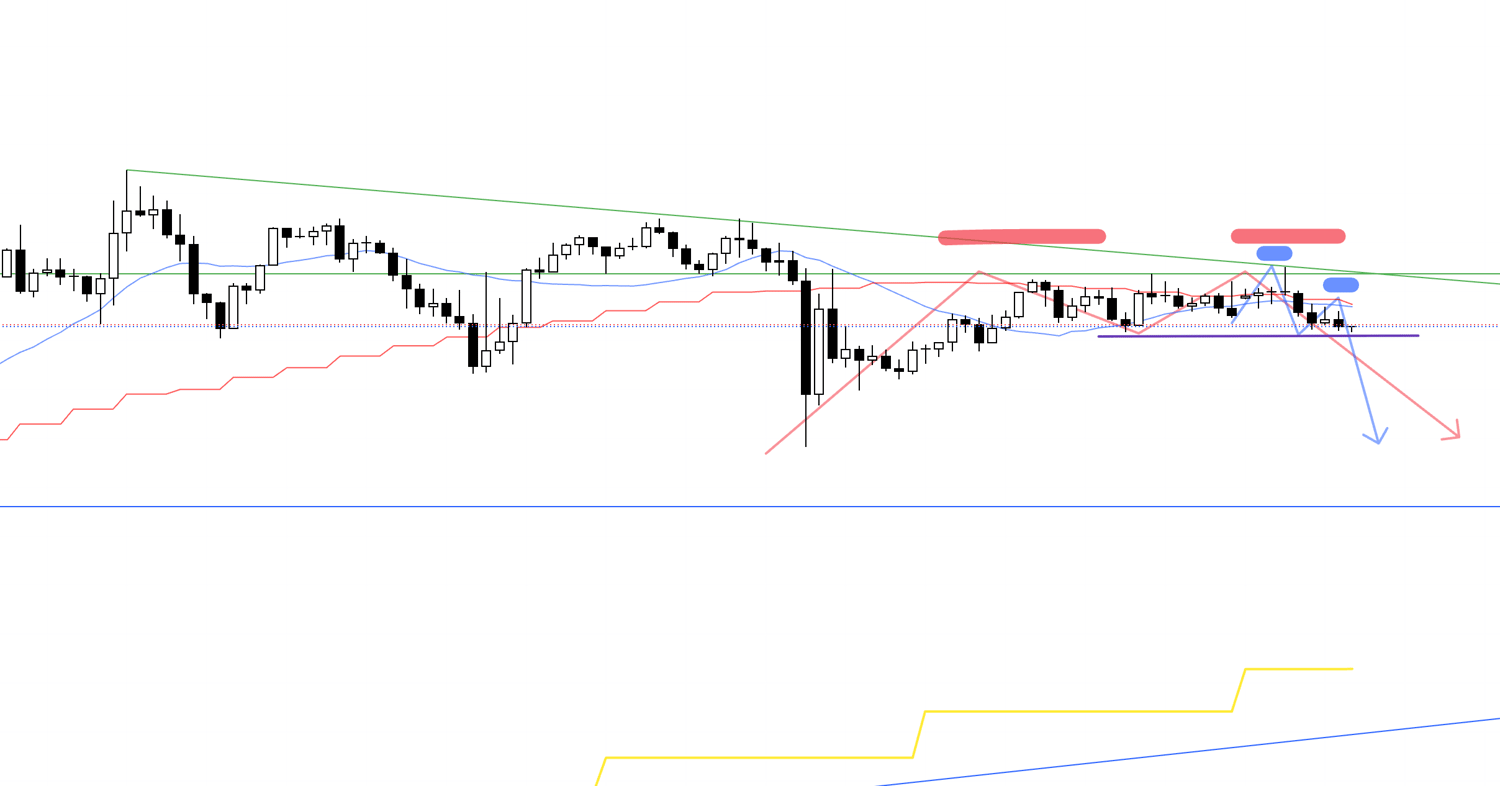
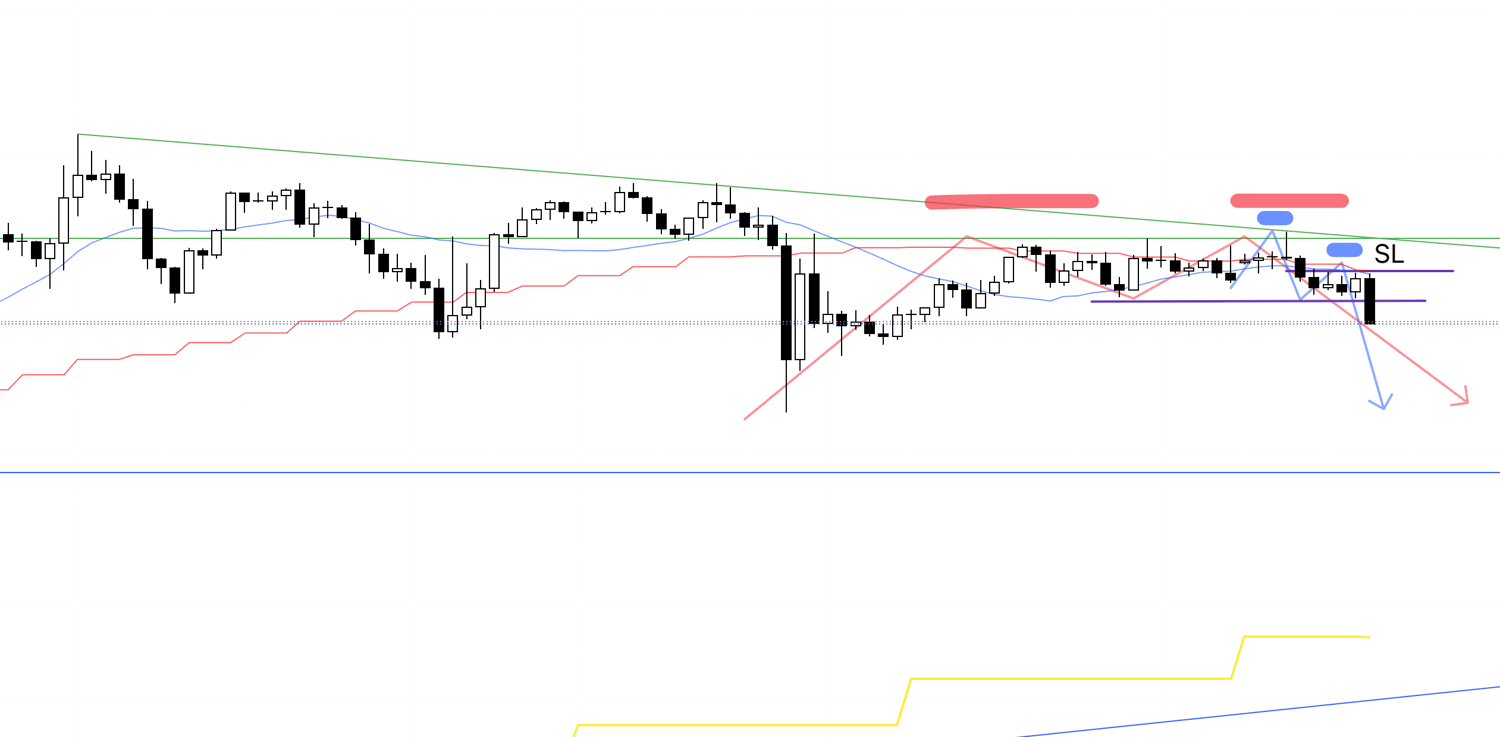
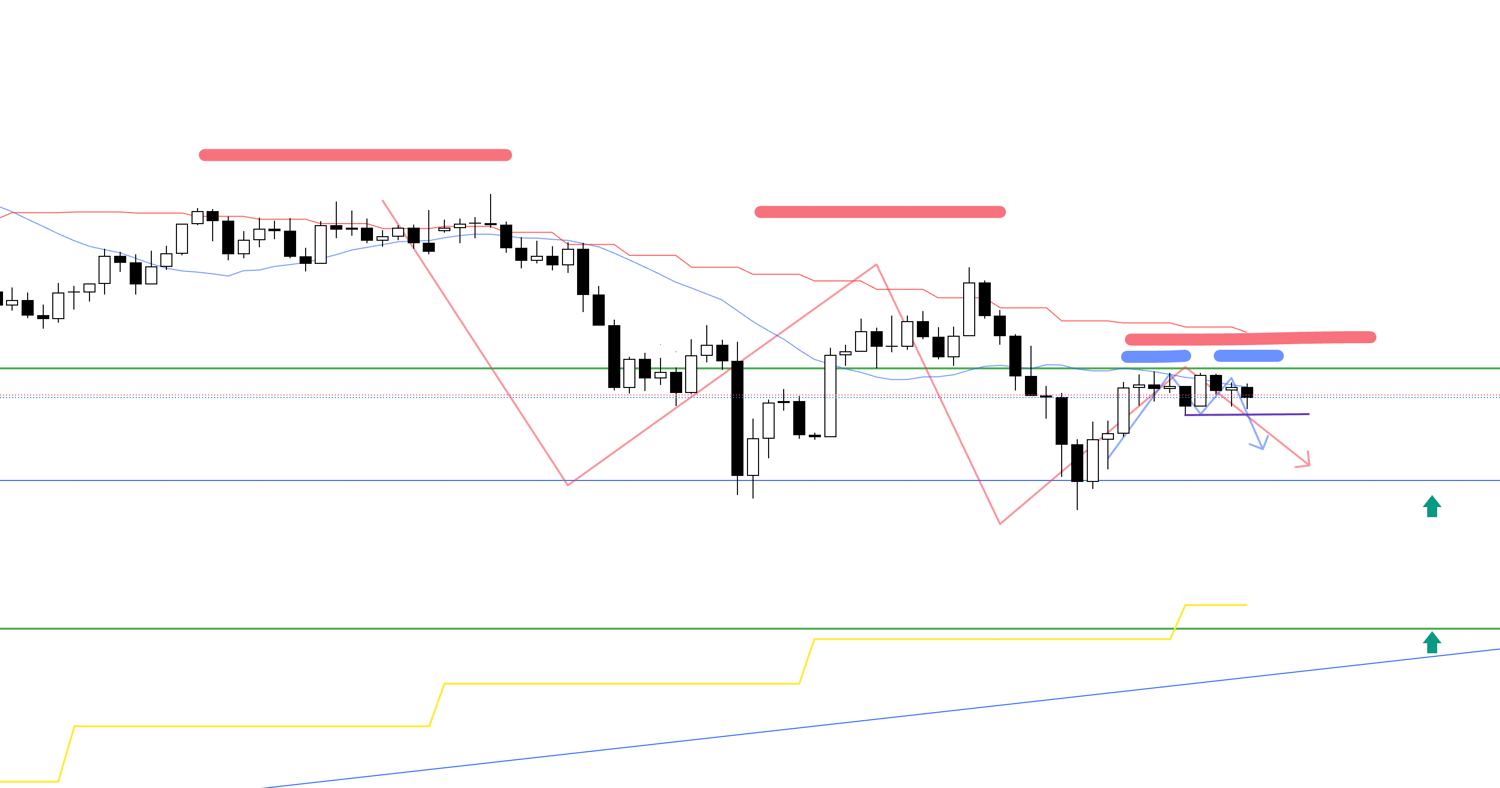
A sell-on-rally setup appeared on the 4h chart.
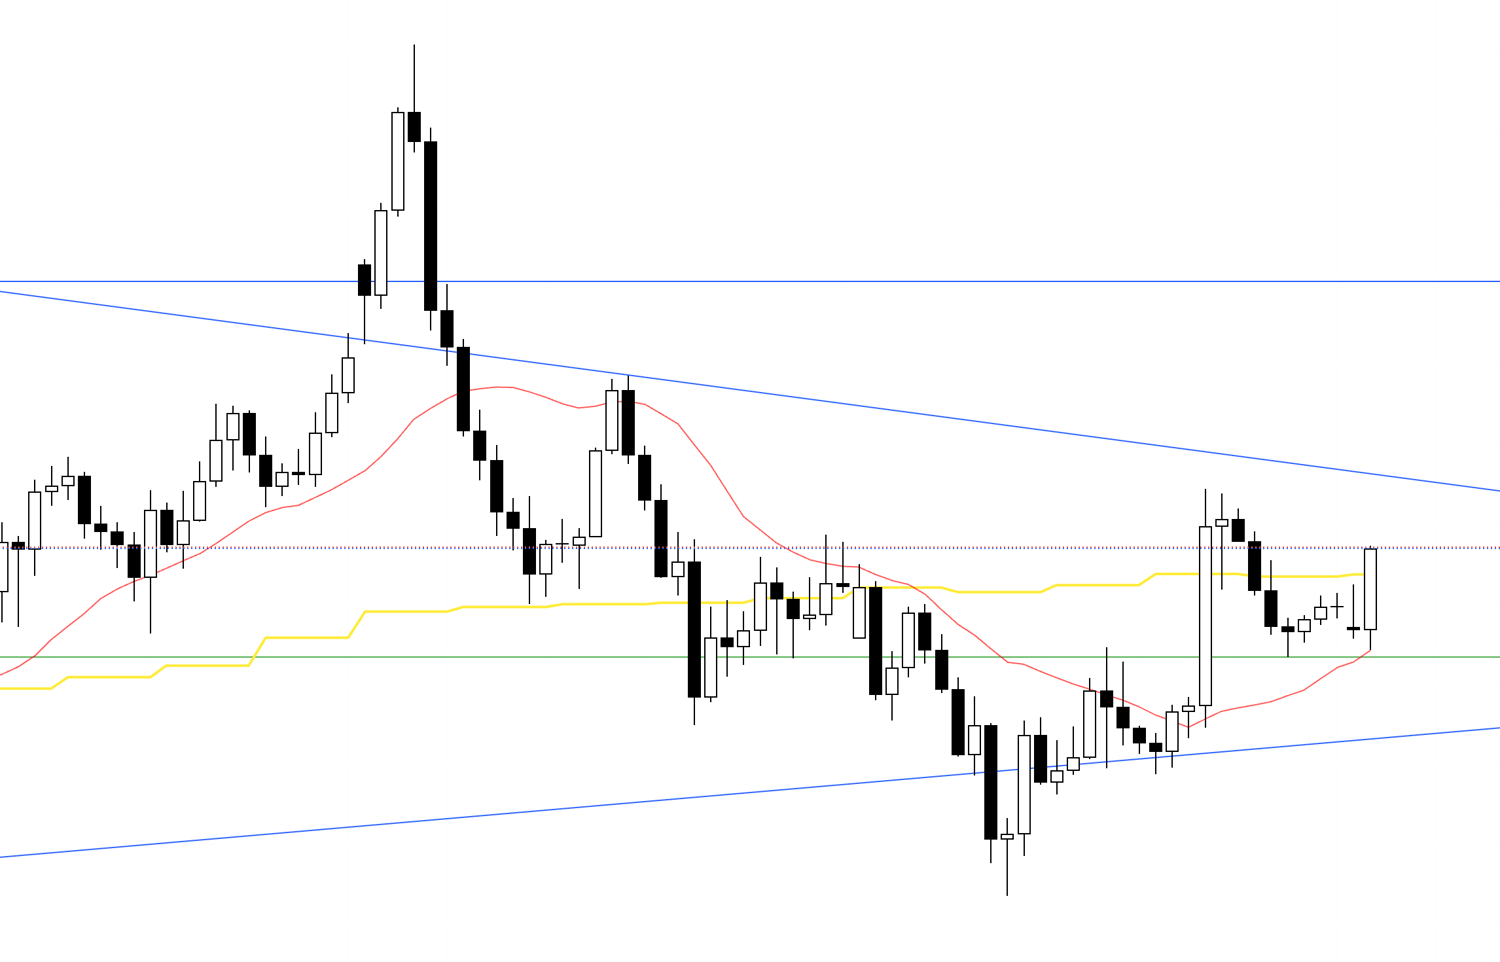
4h Chart
Recently, it slightly updated the previous low, trying to create a high-lowering point.
The blue line drawn since last weekend's scenario post seems effective, with buy orders clustered, making low updates difficult.
So, this 4h sell-on-rally point is where daily dip-buying can enter easily, so consider that risk when trading.
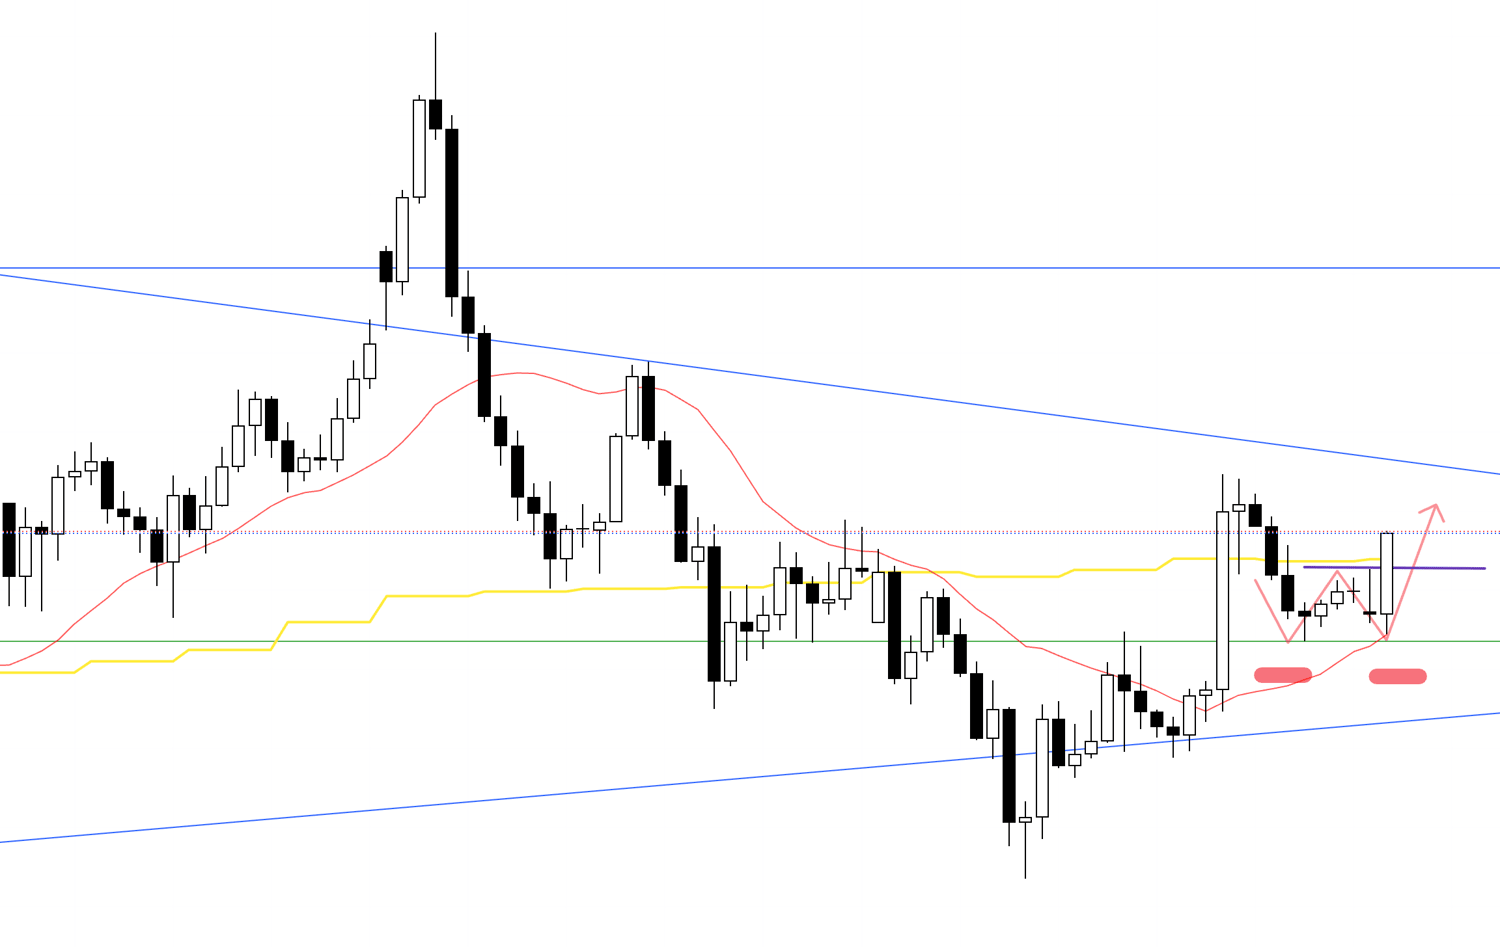
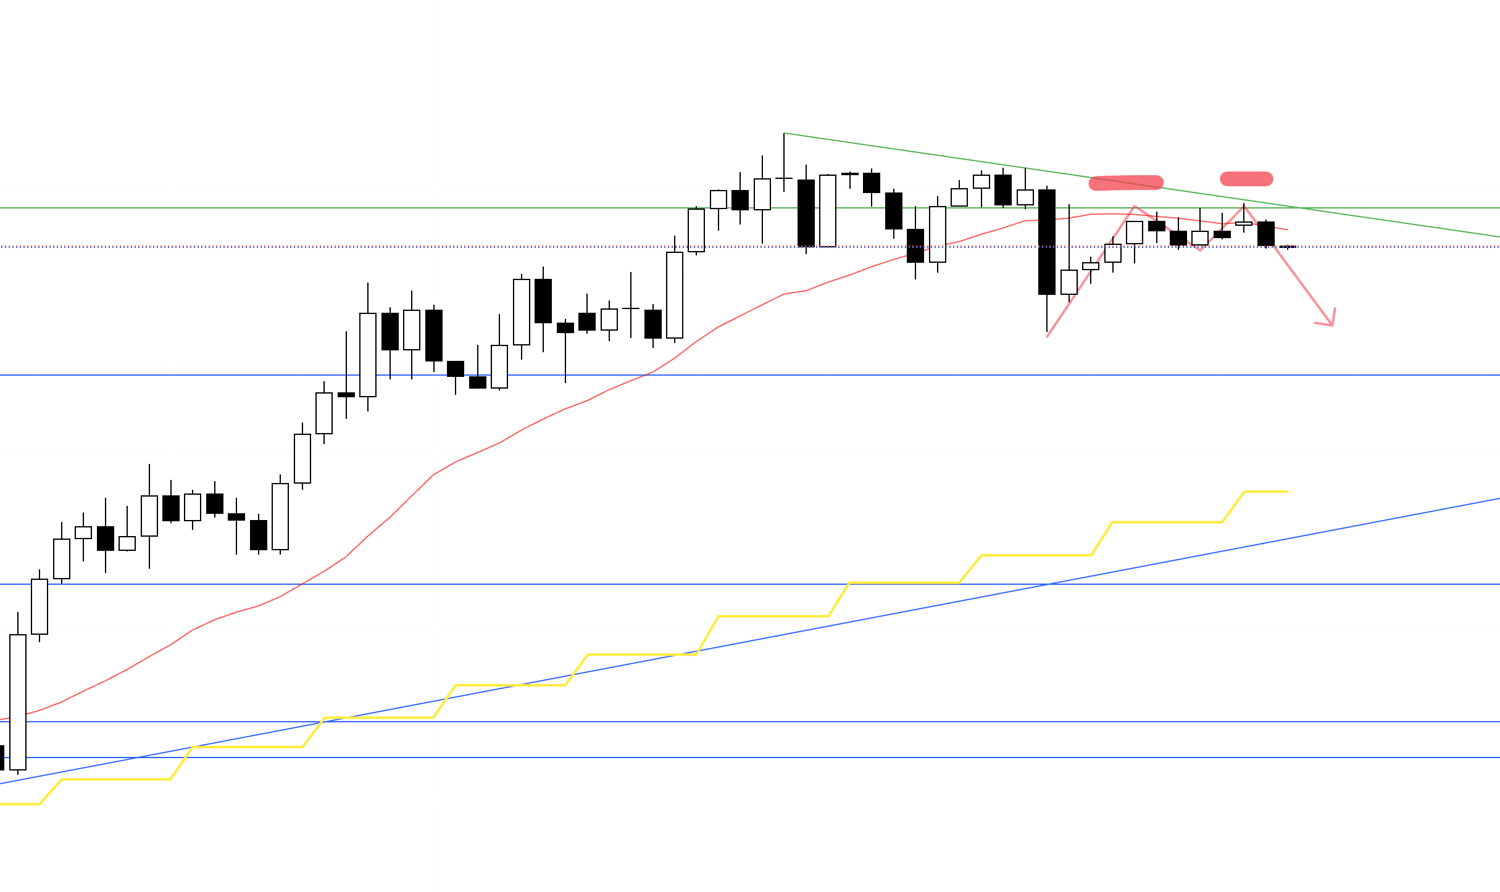
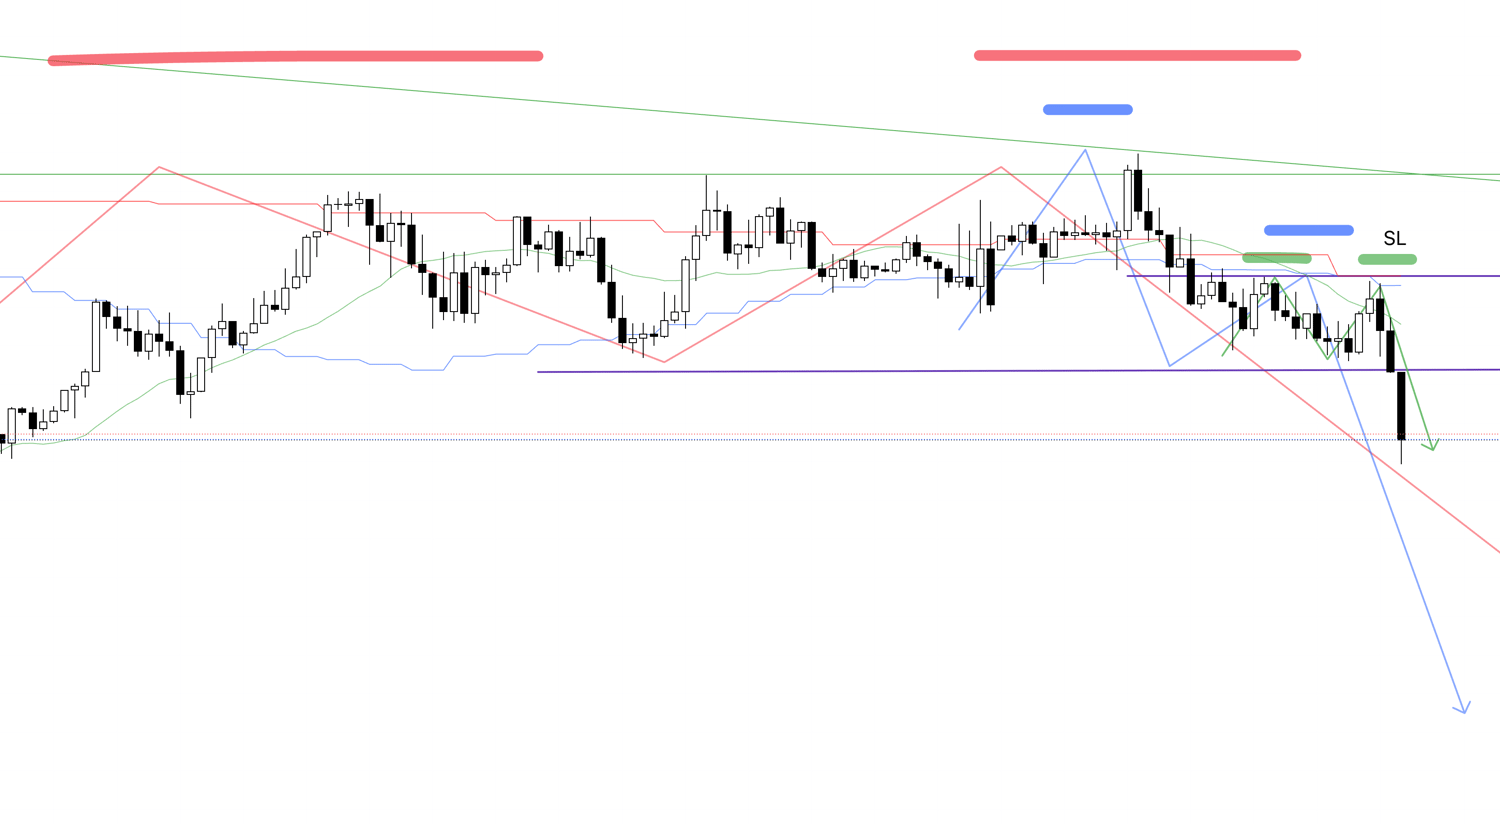
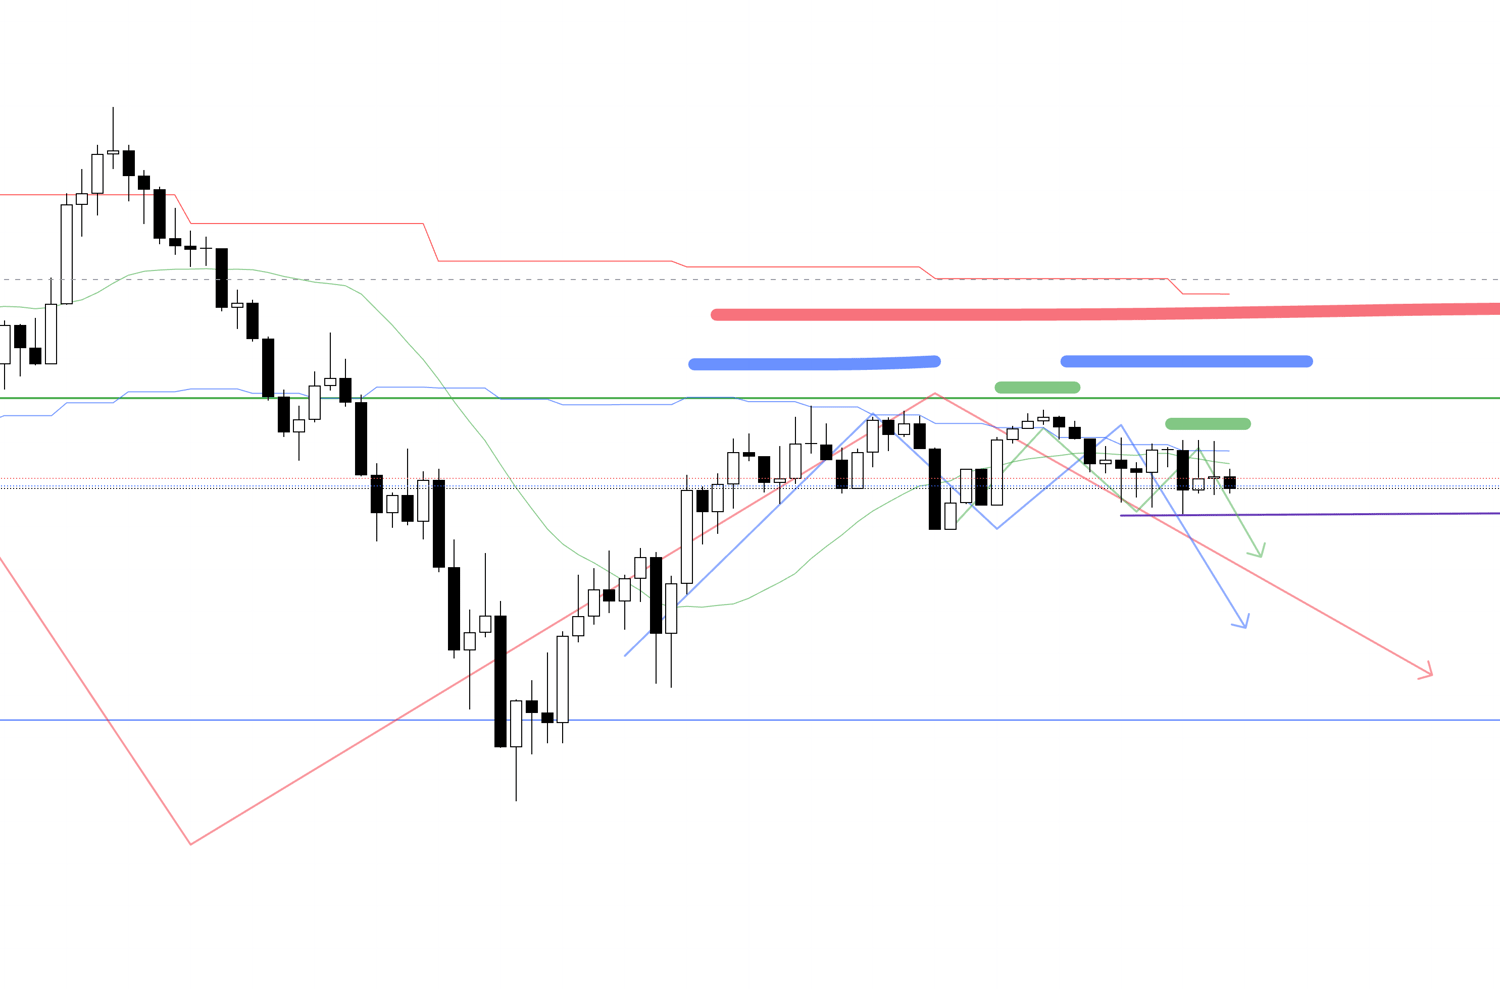
4h Chart
I overlaid daily movements in yellow on this 4h chart.
The daily is forming a dip in an uptrend; the green arrow point is where daily dip buys enter easily, so check remaining range and if risk-reward fits.
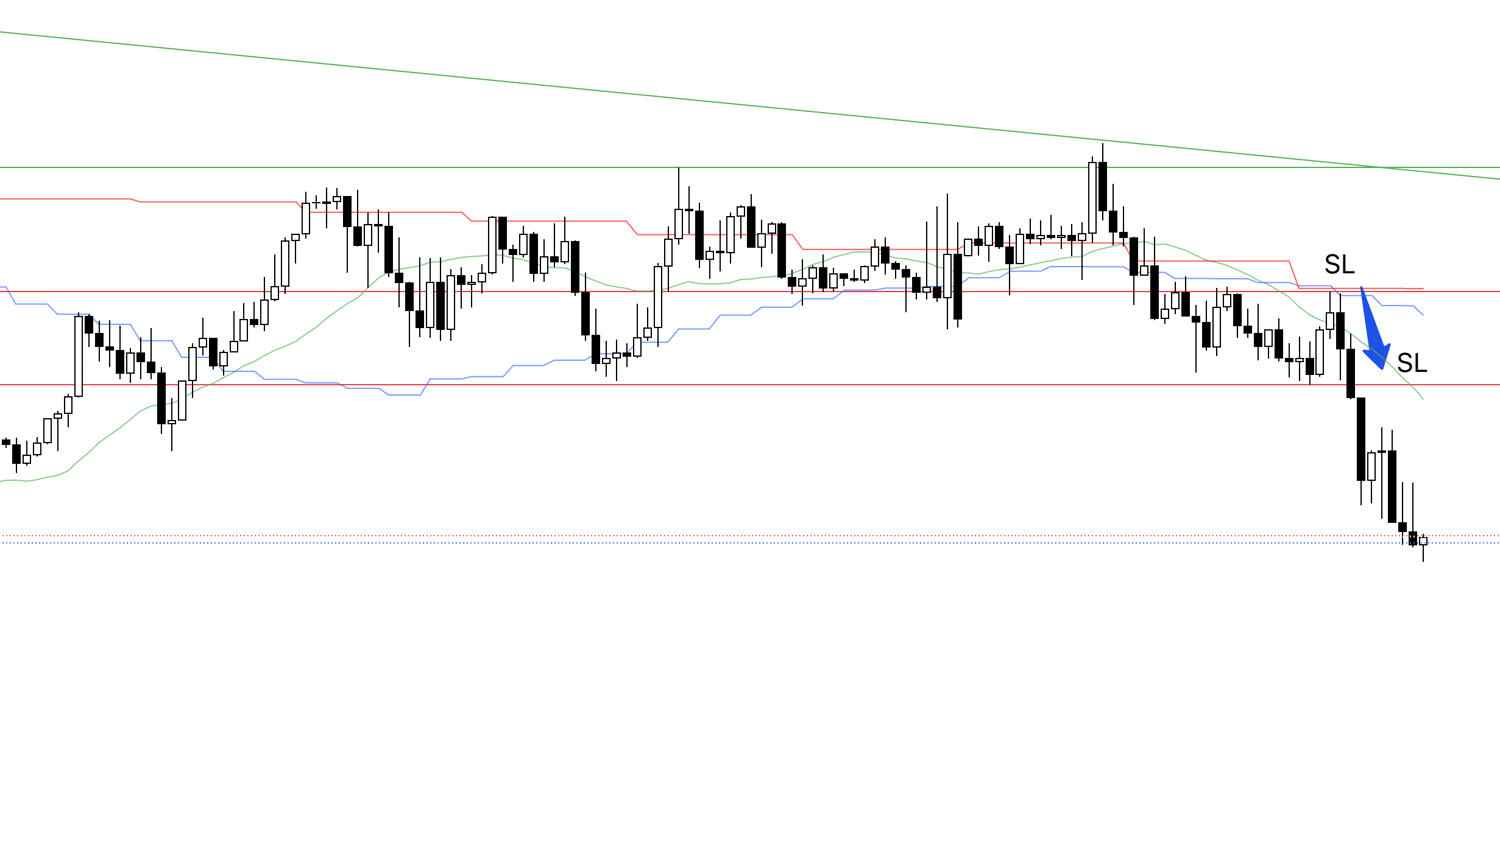
Let's check the 1h chart.
1h Chart
On 1h, updating the recent low within the right-side high of the 4h high-lowering point confirms high lowering.
The suppressed high is the green line where buyers/sellers switch; if it updates lows and confirms high lowering, it would normally be a highly advantageous sell point.
However, it's against the daily trend; entering on 1h to catch a 1h wave doesn't fit risk-reward.
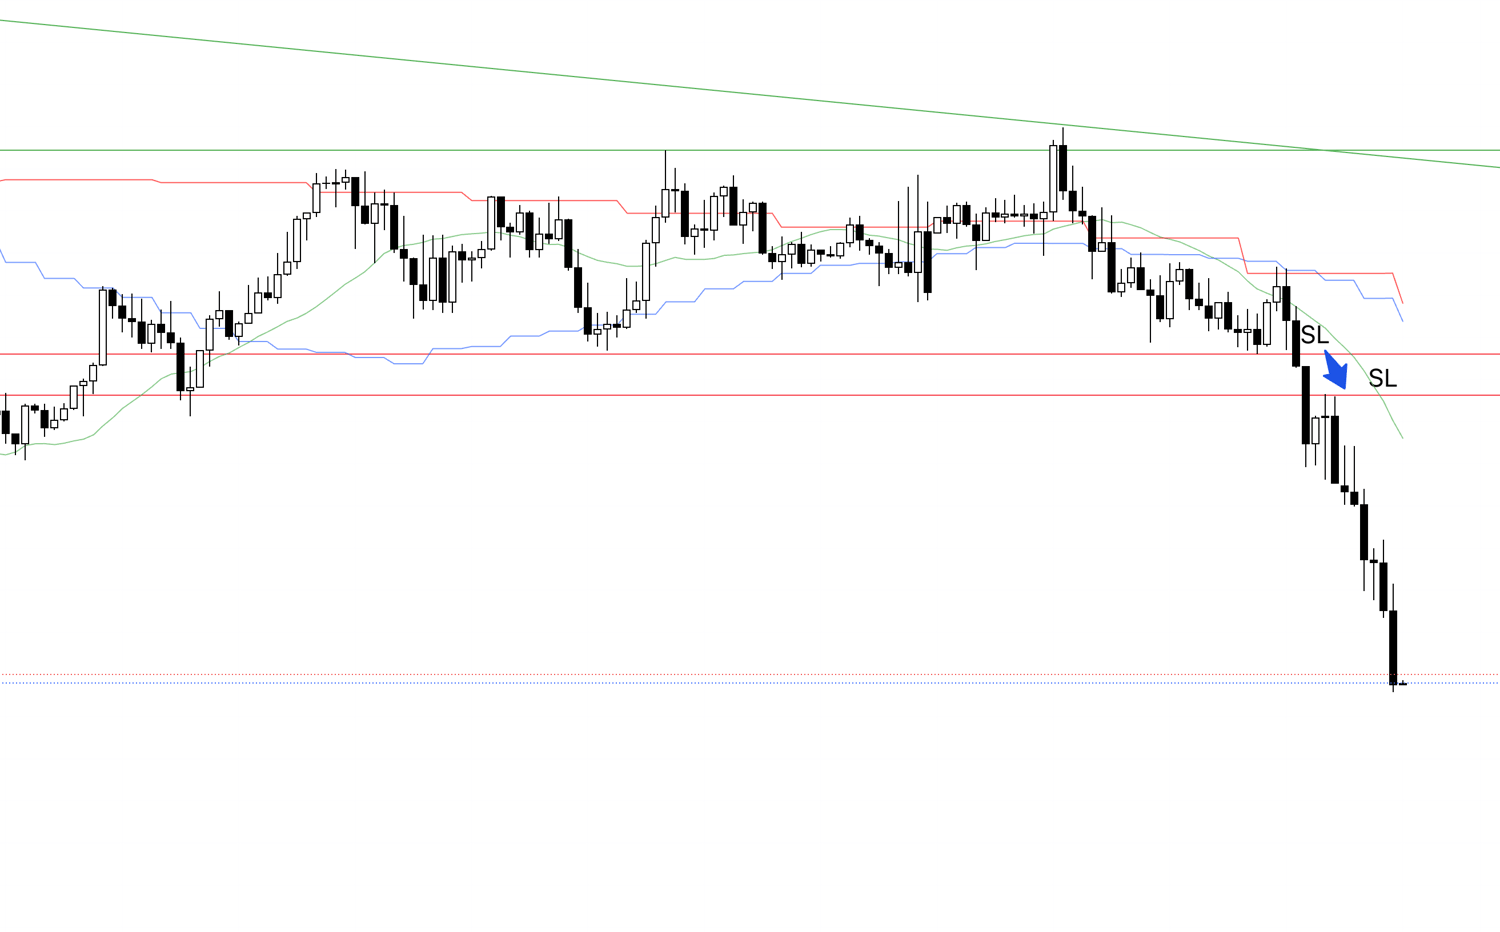
Let's check the lower 15m chart.
15m Chart
On 15m, updating the recent low similarly confirms low update and high lowering within the 1h right-side high.
For 15m trade, entry is updating the purple low line, but 1h low is close, so similar to 1h entry, risk-reward doesn't fit.
For these reasons, I skipped this EURUSD sell.
If the 15m entry allowed a tighter stop with good risk-reward, I might have considered it.
This isn't a executed trade explanation, but I believe sharing how I judge and skip entries is more important than win/loss outcomes, so I'm including it.
I hope it's helpful.
〜・〜・〜・〜・〜・〜・〜・〜・〜・〜・〜・〜・〜・〜・
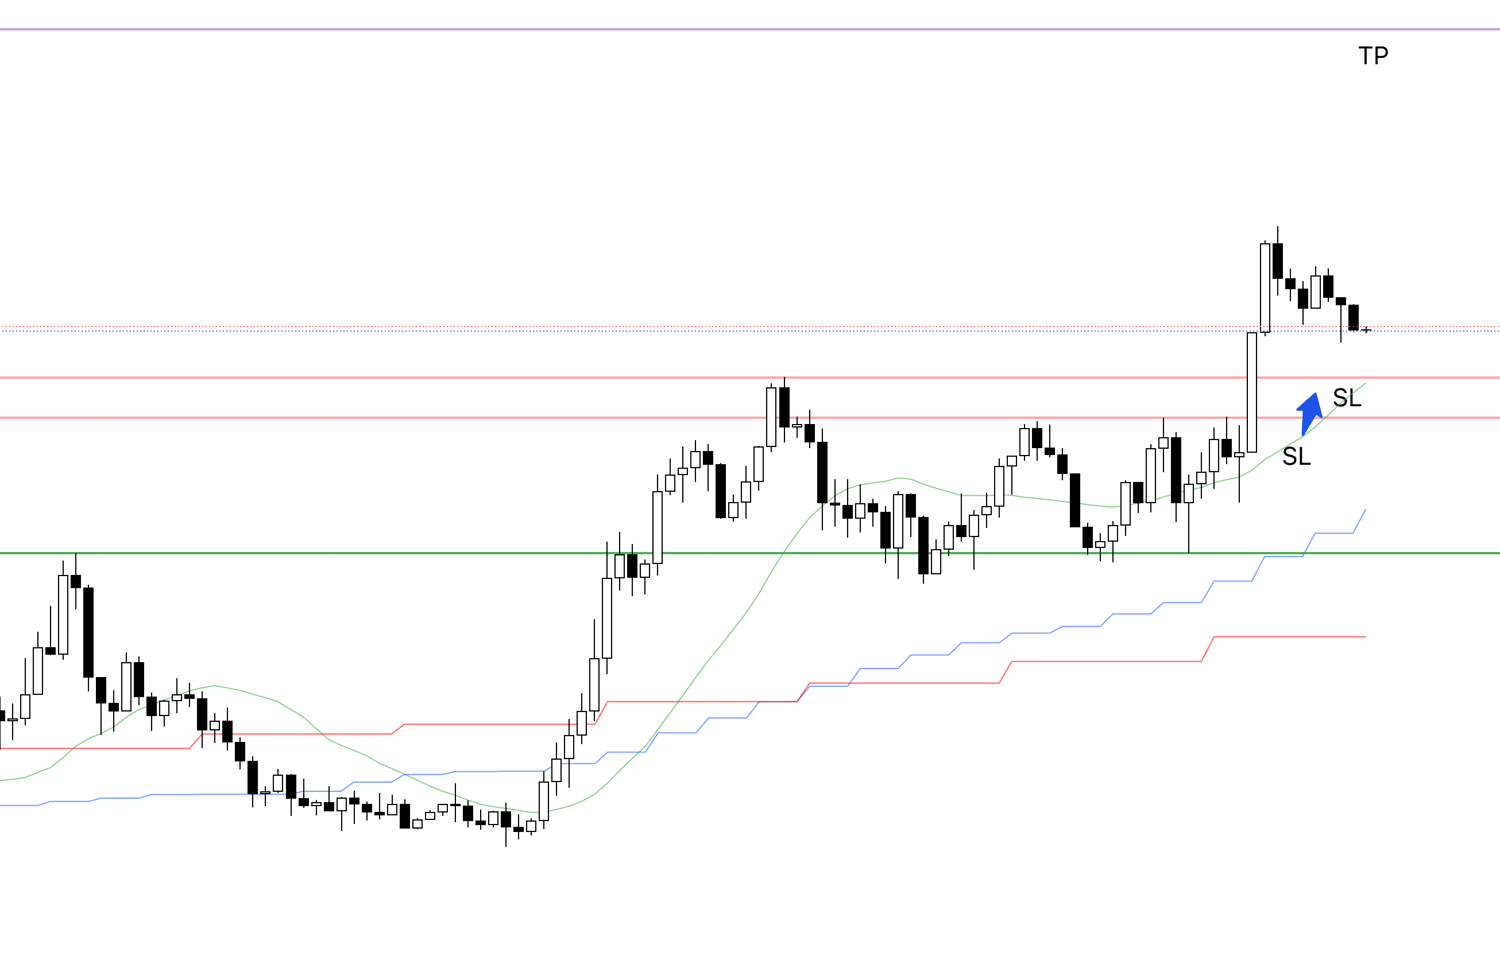
July 11 (Friday) USDJPY
I just placed a buy stop order on USDJPY.
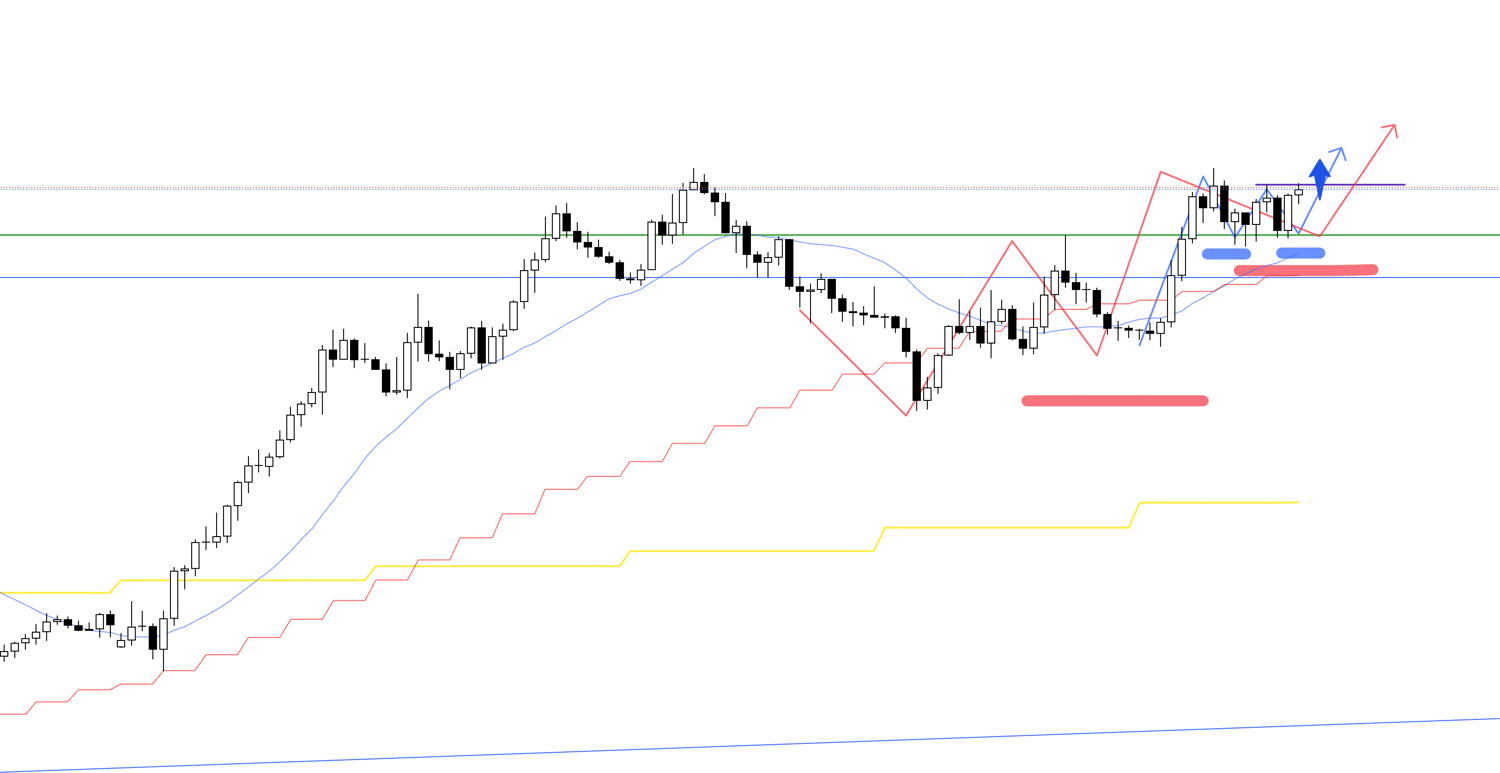
First, see the 4h chart below.
4h Chart
The 4h chart broke the previous uptrend temporarily but then updated highs and raised lows, re-entering an uptrend.
This is forming a daily dip decline on 4h, then rising as daily dip buying.
Yellow overlay is daily chart movements.
It's neatly supported at the green line, so if it updates highs, must buy.
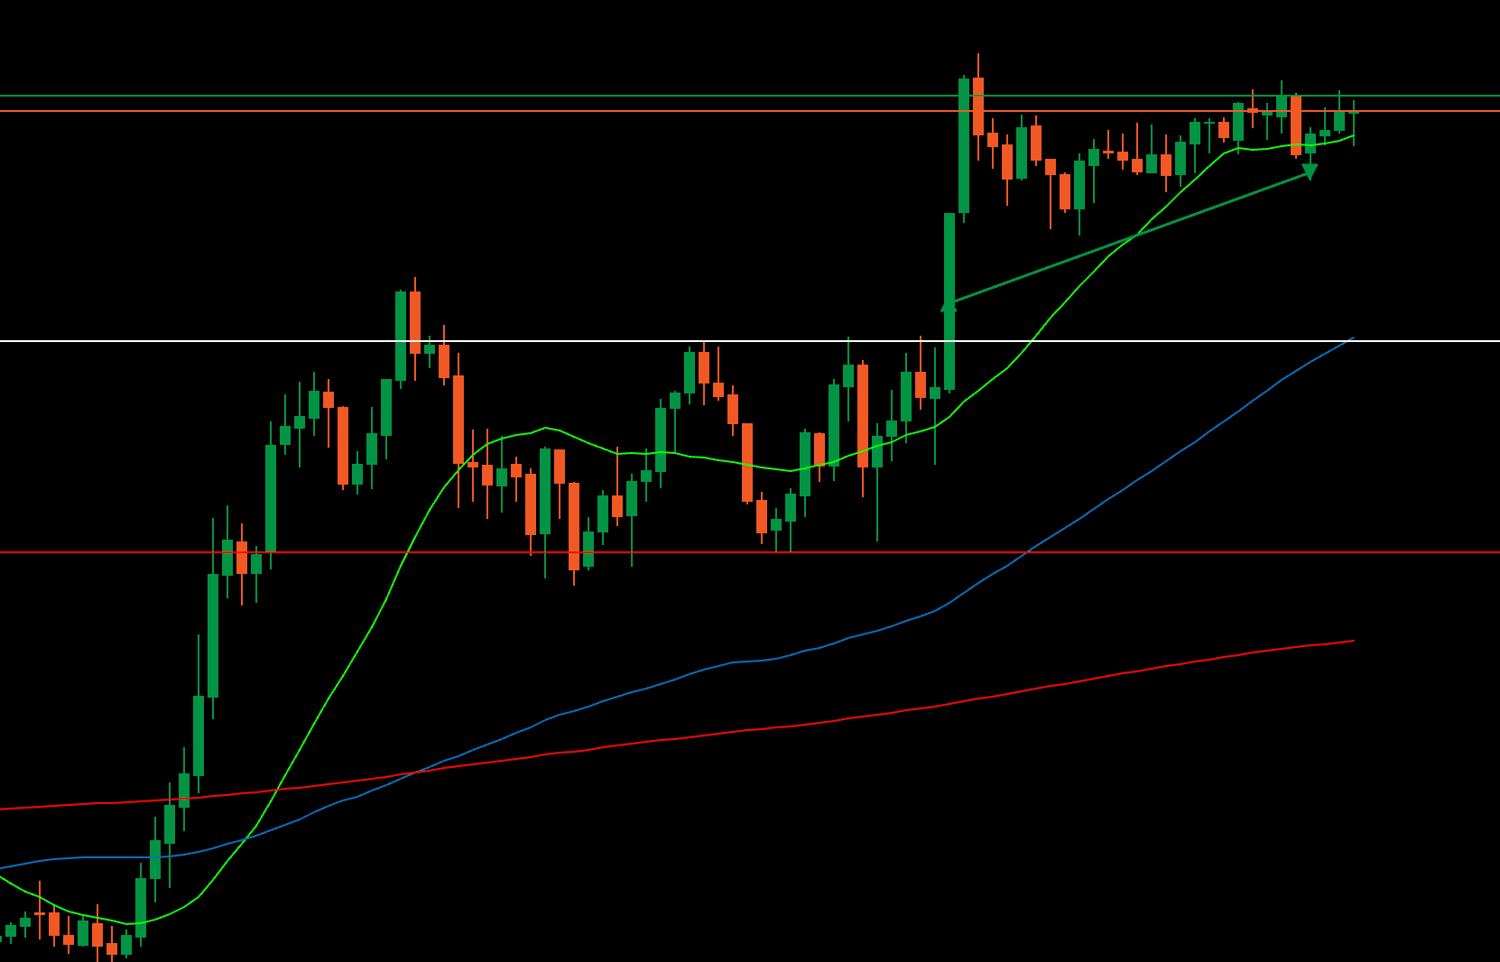
Let's see this point on the 1h chart for actual trading.
1h Chart
On 1h, within the 4h dip, it's raising lows and trying to update highs.
The high update point is entry, so I placed an entry order there, SL just below 1h low.
If it updates highs and executes, I'll follow the trend until it breaks.
15m Chart
This is the 15m chart on cTrader right after entry.
I plan to hold until 15m trend breaks, but since it's Friday, I don't hold over weekends, so if not closed by market close, manual close.
Or, I set TP at recent daily high, so hitting that closes it.
This is my Friday-only rule to avoid weekend holds.
15m Chart
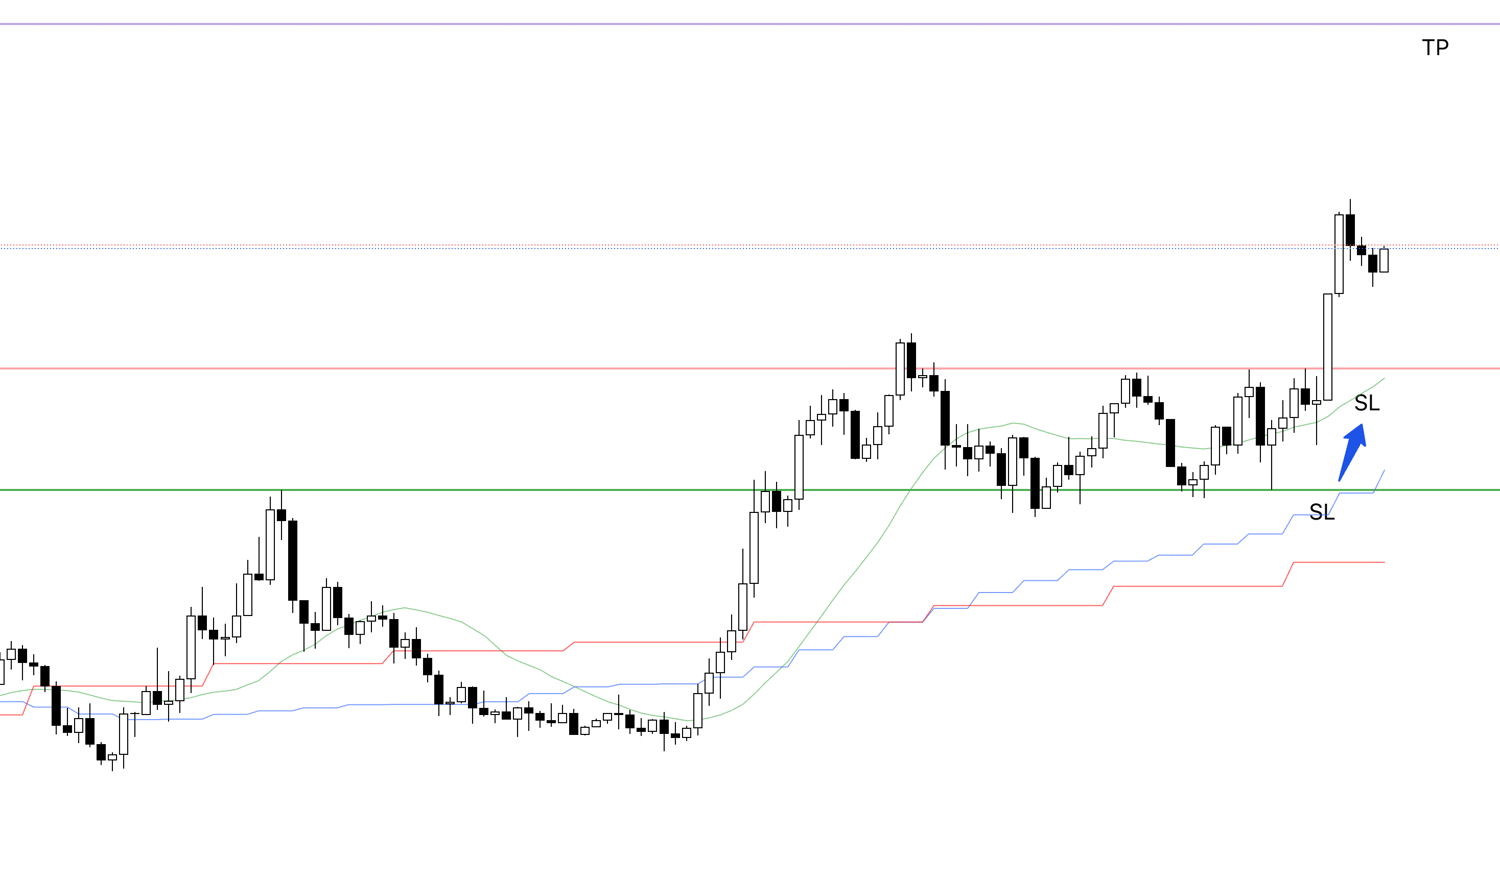
This is 15m; I just raised SL below the red line.
The upper purple line is previous daily high; since Friday, hitting it means profit take and end.
This is a Friday-specific rule to avoid weekend holds; normally, no TP, hold as long as trend continues.
15m Chart
I moved the trailing stop a bit.
It'll close if it breaks previous high line and moving average simultaneously.
15m Chart
This is my actual 15m on cTrader.
In Japan, it's midnight; I woke to alarm, raised trailing stop on phone, and it hit, closing the trade.
Now, summarizing this trade.
15m Chart
This is 15m.
Entry from point where 15m also raises lows and updates highs, at 1h low raise and high update timing.
After entry, trailed per rules, finally slightly broke 15m low, breaking trend, and closed.
〜・〜・〜・〜・〜・〜・〜・〜・〜・〜・〜・〜・〜・〜・
That concludes this week's trade points review.
This isn't written retrospectively on weekends; it's compiled from real-time notes and screenshots like a trade journal, capturing my thoughts before and during entries that day.
This week, I seriously considered entries only four times, executing two.
Some weeks have more trades, some none, but the key is "consistently repeating the same trades."
In trading, it's crucial to only take your setups and properly skip where you shouldn't.
To celebrate the blog launch, this 'Weekly Trade Report,' planned for Saturdays, will be free this month.
These weekend reports compile my real-time thought processes (entry, stop-loss, take-profit decisions) from actual trades that week.
From August, Saturday "Weekly Trade Reports" will be paid content, so take this chance to experience my real-time thinking.
Note, these are for educational purposes only, not trading instructions.
Any trading you do is your responsibility; invest time in strategy building and testing, and trade at your own risk.
I hope my trend-following strategy explanations help your own strategy development.