

Hello.
This "Trade Scenario" blog is scheduled to be posted "every week" on Sundays.
And every Saturday, I will post a "Weekly Trade Report" explaining how I actually thought about and executed trades during that week.
Did you read the "Weekly Trade Report" where I explained my trades from the past week yesterday?
If you haven't seen it yet, please take a look.
By reading it together with the Trade Scenario blog, I think you can reference the process of how to think in advance, what to wait for, and how to execute.
And this scenario is not a prediction.
It's not a prediction, but my trade plan of "if this happens, I'll do this."
I don't predict the market, and this is not that kind of thing, so please understand that in advance.
And this is not giving you buy or sell instructions, and it's provided solely for educational purposes.
I cannot take any responsibility for the results of any trades you make, so please trade at your own risk.
Now, let's start by looking at the Euro Dollar scenario.
〜・〜・〜・〜・〜・〜・〜・〜・〜・〜・〜・〜・〜・〜・
EURUSD
First, please take a look at the 4H chart.
4H Chart

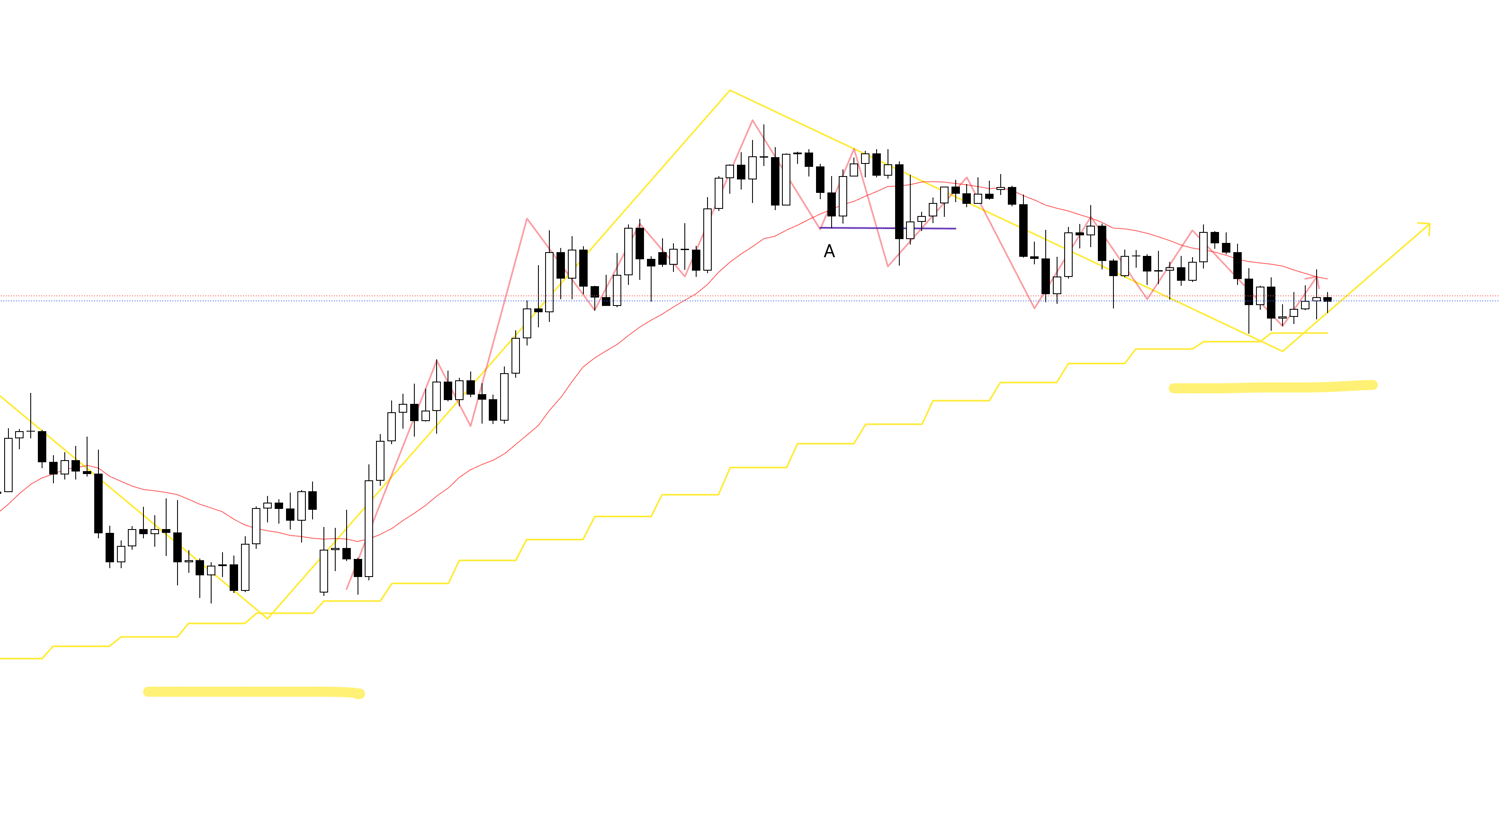
Currently, as shown, what was an uptrend on the 4H chart ended the uptrend by breaking the low of the purple line indicated by "A" (or even the low before that), and afterward, it has been updating lows and lowering highs in a downtrend.
However, this downtrend, when viewed on the higher timeframe of the daily chart, becomes a decline forming a pullback.
The movement on the daily chart is depicted in yellow within this 4H chart.
In other words, if the 4H chart transitions to an uptrend, the "low point" of that uptrend transition becomes the entry point for buying.
With that in mind, let's consider the buying scenario.
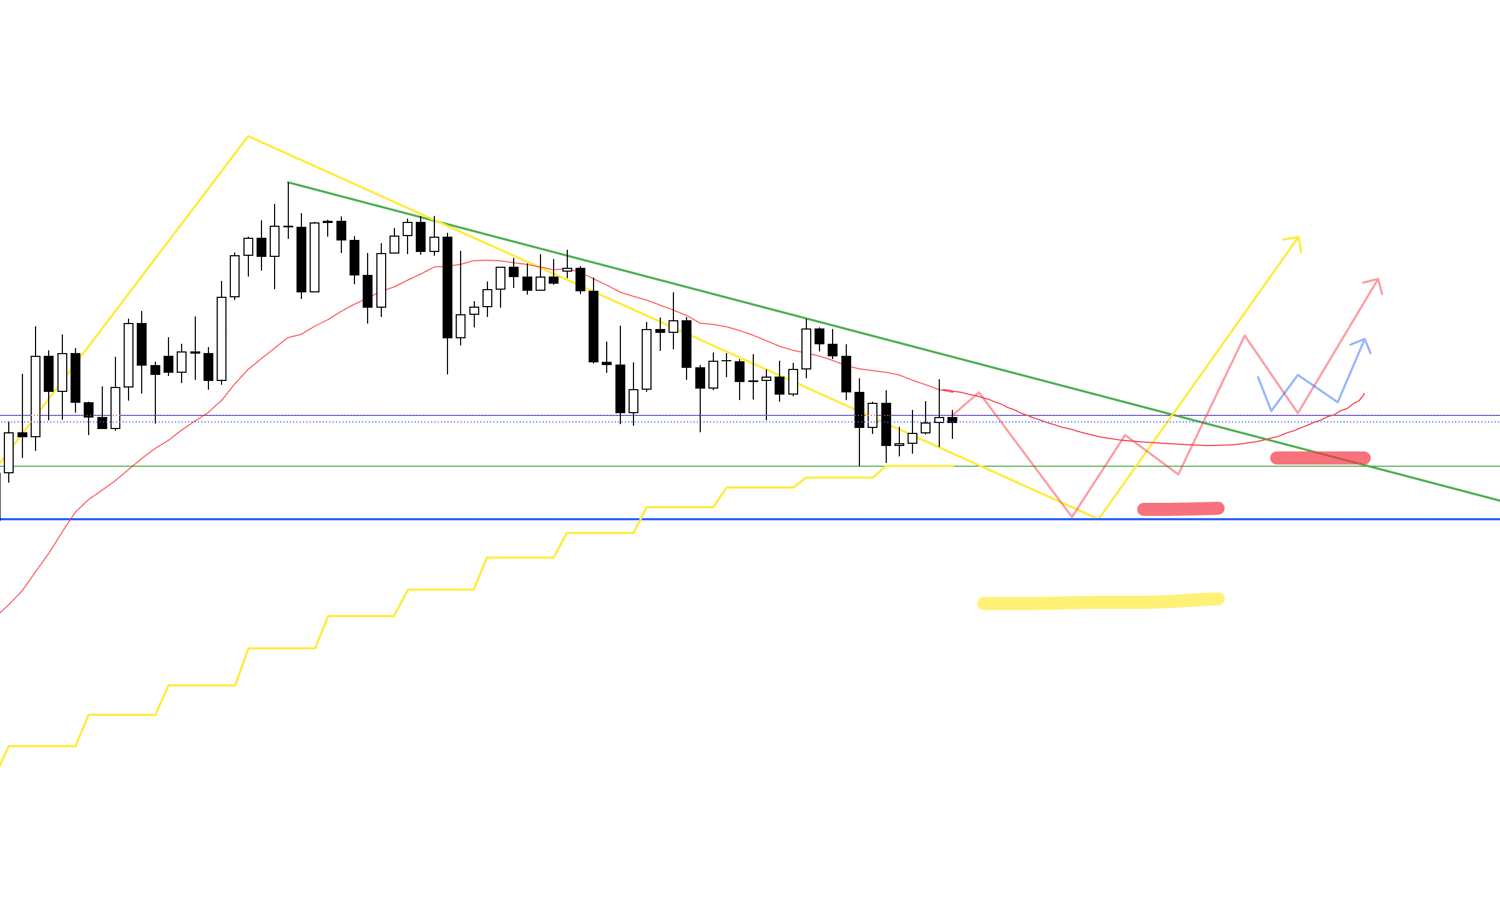
4H Chart
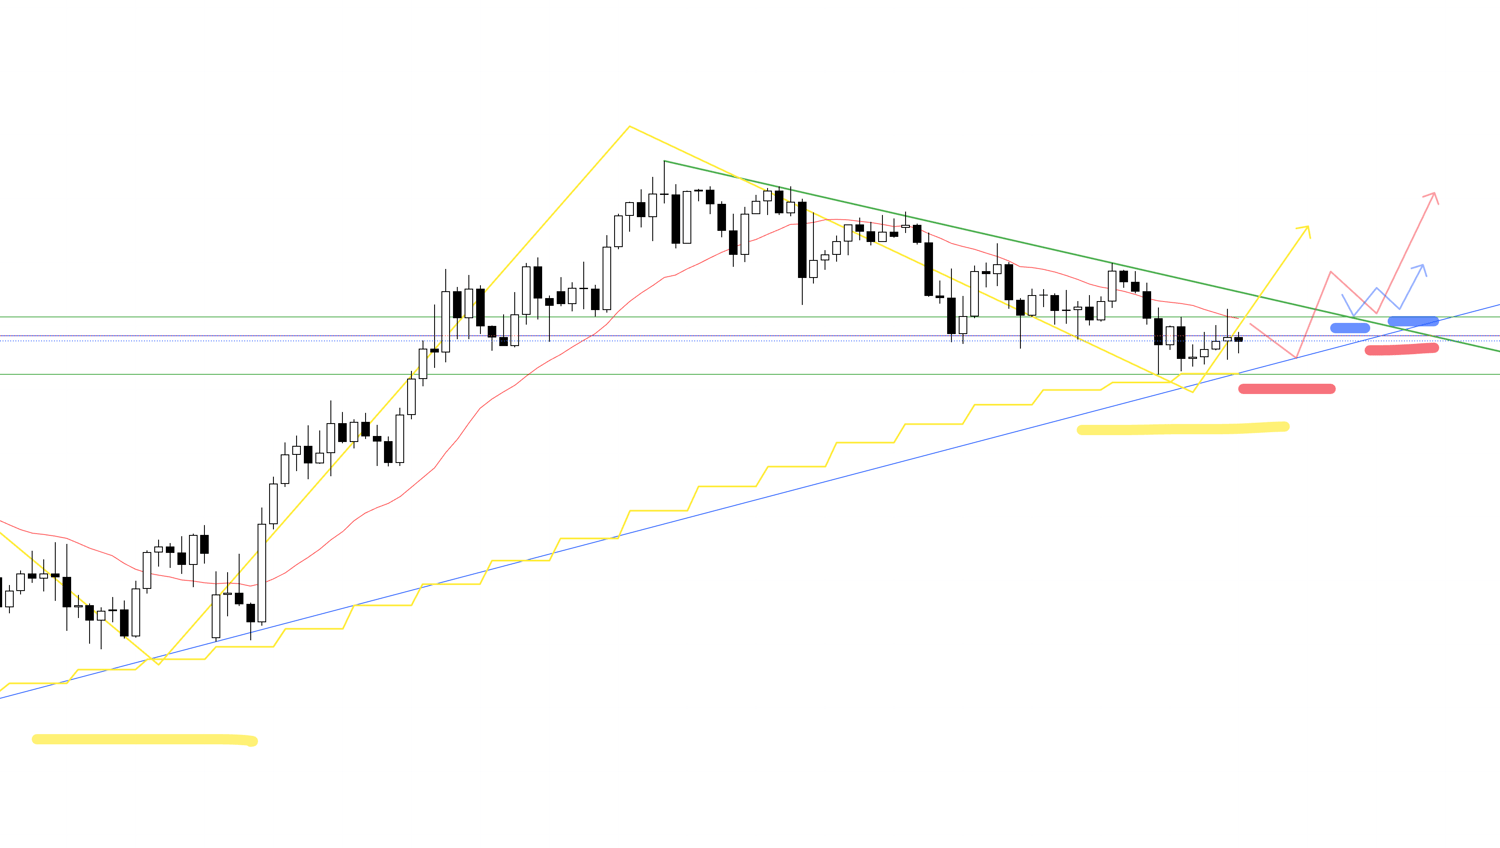
In this way, within the low-raising points for pullback buying on the daily chart, if there is a point on the 4H chart where lows are raised and highs are updated, and furthermore, on the lower timeframe of the 1H chart, a point where lows are raised and highs are updated, I will consider buying.
The movement on the 4H chart is depicted in red in the chart, and the movement on the 1H chart is depicted in blue.
This point is a pullback transitioning from the previous downtrend to an uptrend on the 4H chart, and it aims for the point where the trend transitions on the lower timeframe of the 1H chart, so it's a point where you can enter buys from a low position and capture the subsequent rise on the higher timeframe.
At this time, it's important whether the trendline indicated in green that is suppressing from above has been broken upward once and then formed a pullback.
If it's also supported by the blue trendline that can be recognized on the daily chart, which seems to have been effective from before, the advantage for an upside move increases.
Daily Chart
On the daily chart, it becomes a pullback buy like this.
However, currently, there is still some space left up to the previous high on the daily indicated by the blue line in the figure, and the possibility of a decline that fills this space must also be considered.
In that case, the following buying scenario can be considered.
4H Chart
However, in this case, the moving average (4H 20SMA) is suppressing from above, and the green trendline is close, so I won't trade it.
4H Chart
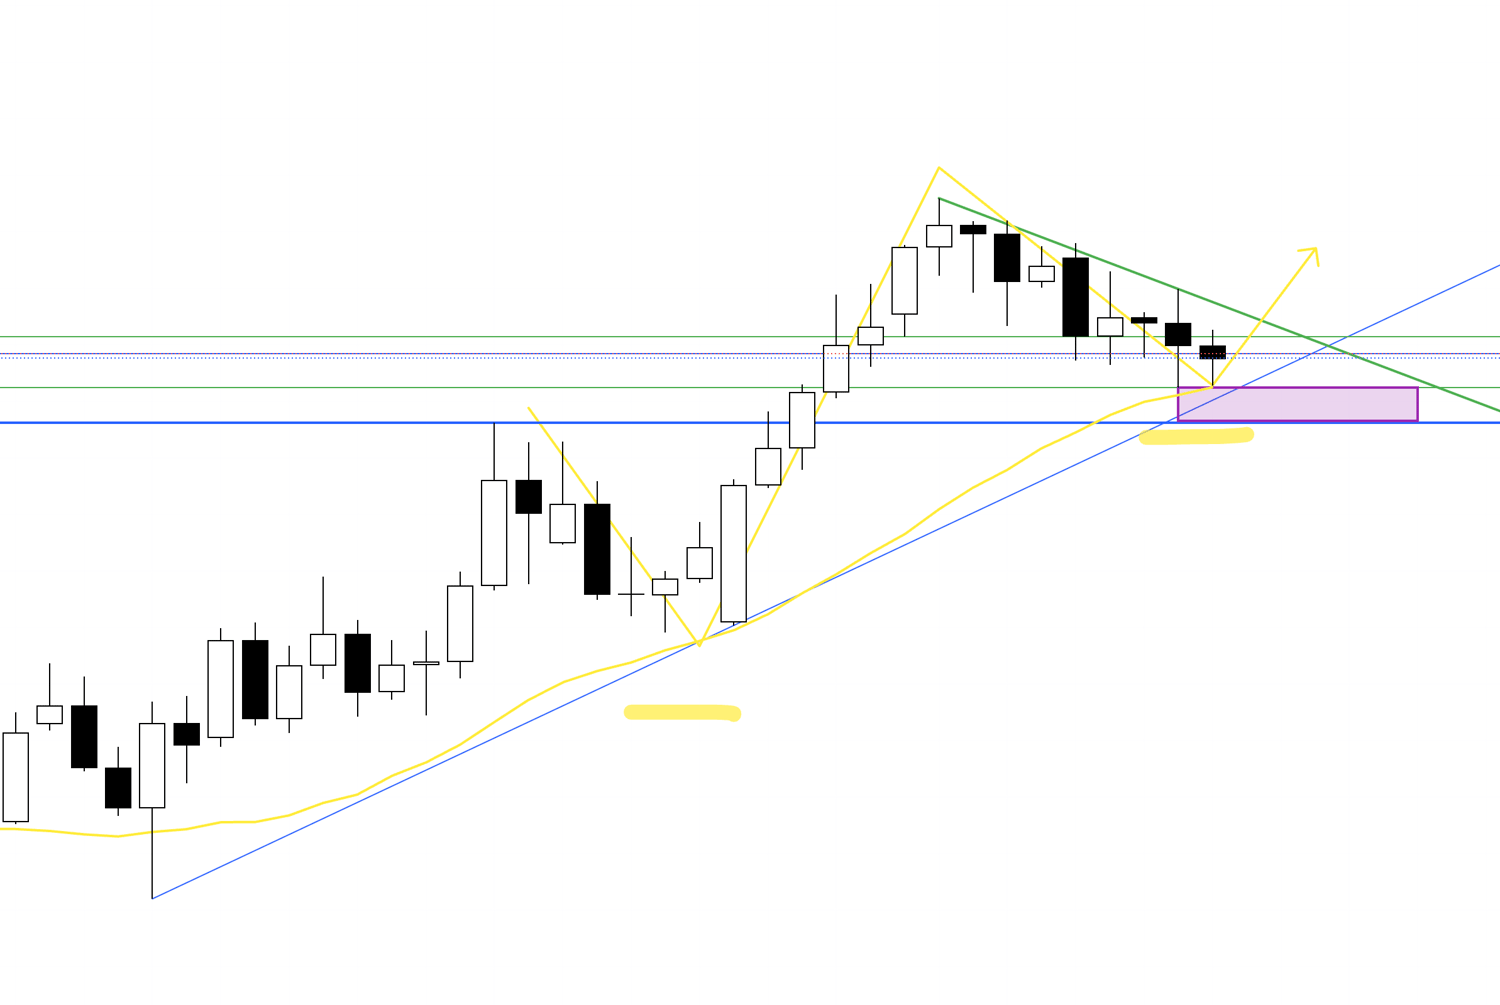
If, hypothetically, it breaks above the trendline or MA that was suppressing like this, and now starts raising lows while being supported from below by the MA, I will consider buying.
Now, let's consider the selling scenario next.
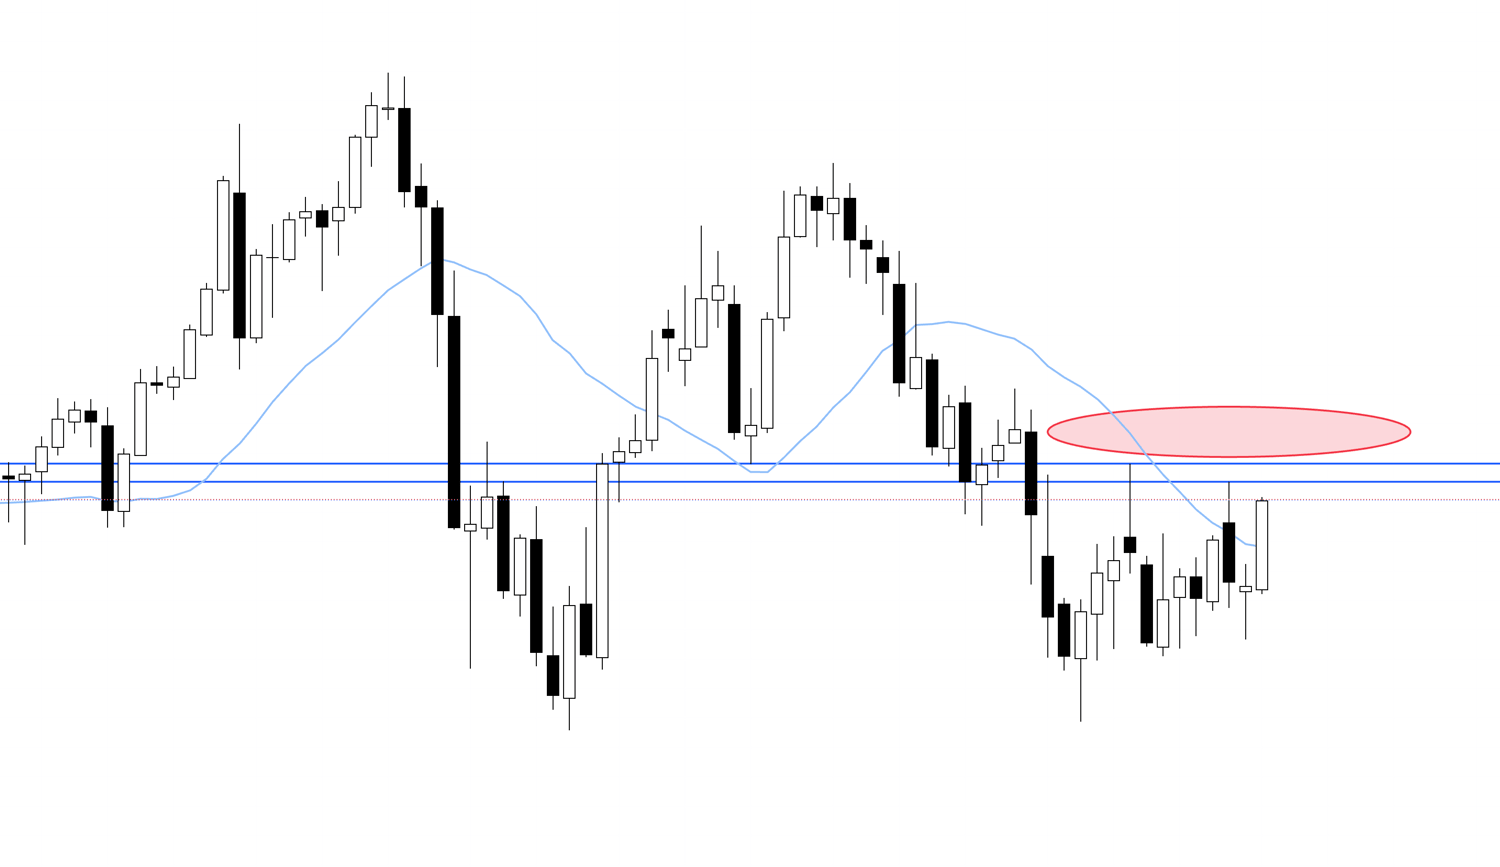
4H Chart
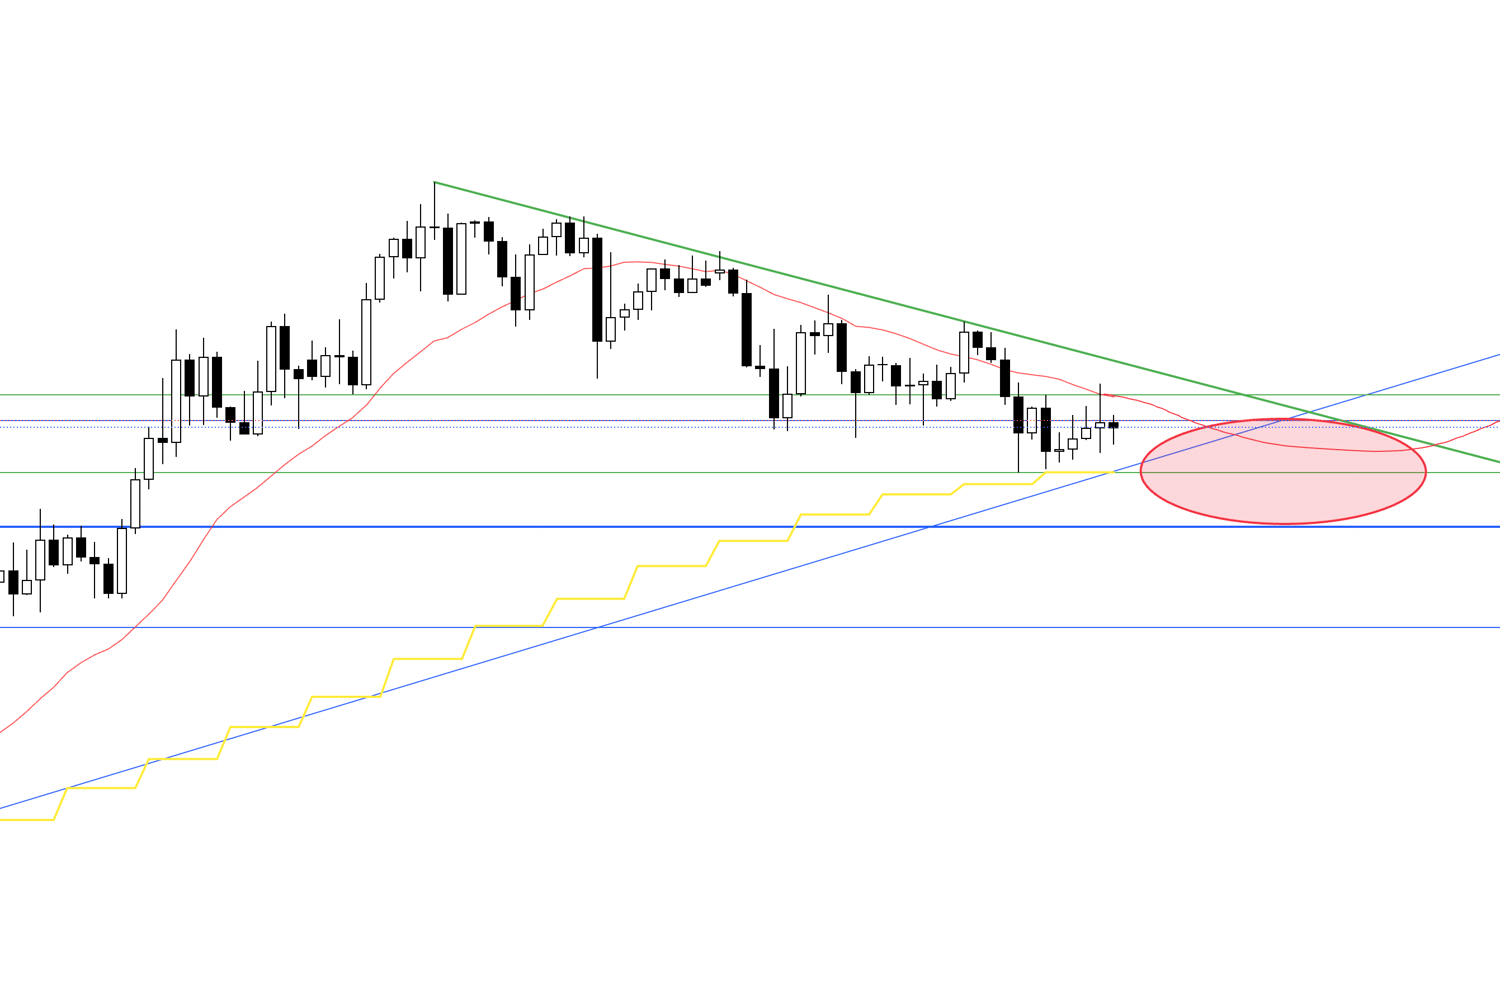
As we've been seeing, currently it's a pullback buying point on the daily chart, and on the 4H chart, it's in a downtrend, but since it's a point where many pullback buy orders on the daily will come in, it's a point where the intentions of the 4H chart (selling) and daily chart (buying) intersect, with a high possibility of volatile price action.
Considering such risks, I don't think I'll consider selling at the place indicated by this round oval.
4H Chart

The ideal is to create a new high-lowering point on the current daily chart.
If it once ends the downtrend on the 4H chart and then creates a new downtrend again at the initial point, I would consider selling, but it looks like that might take time, so it may be from next week onward.
Now, let's consider another selling scenario.
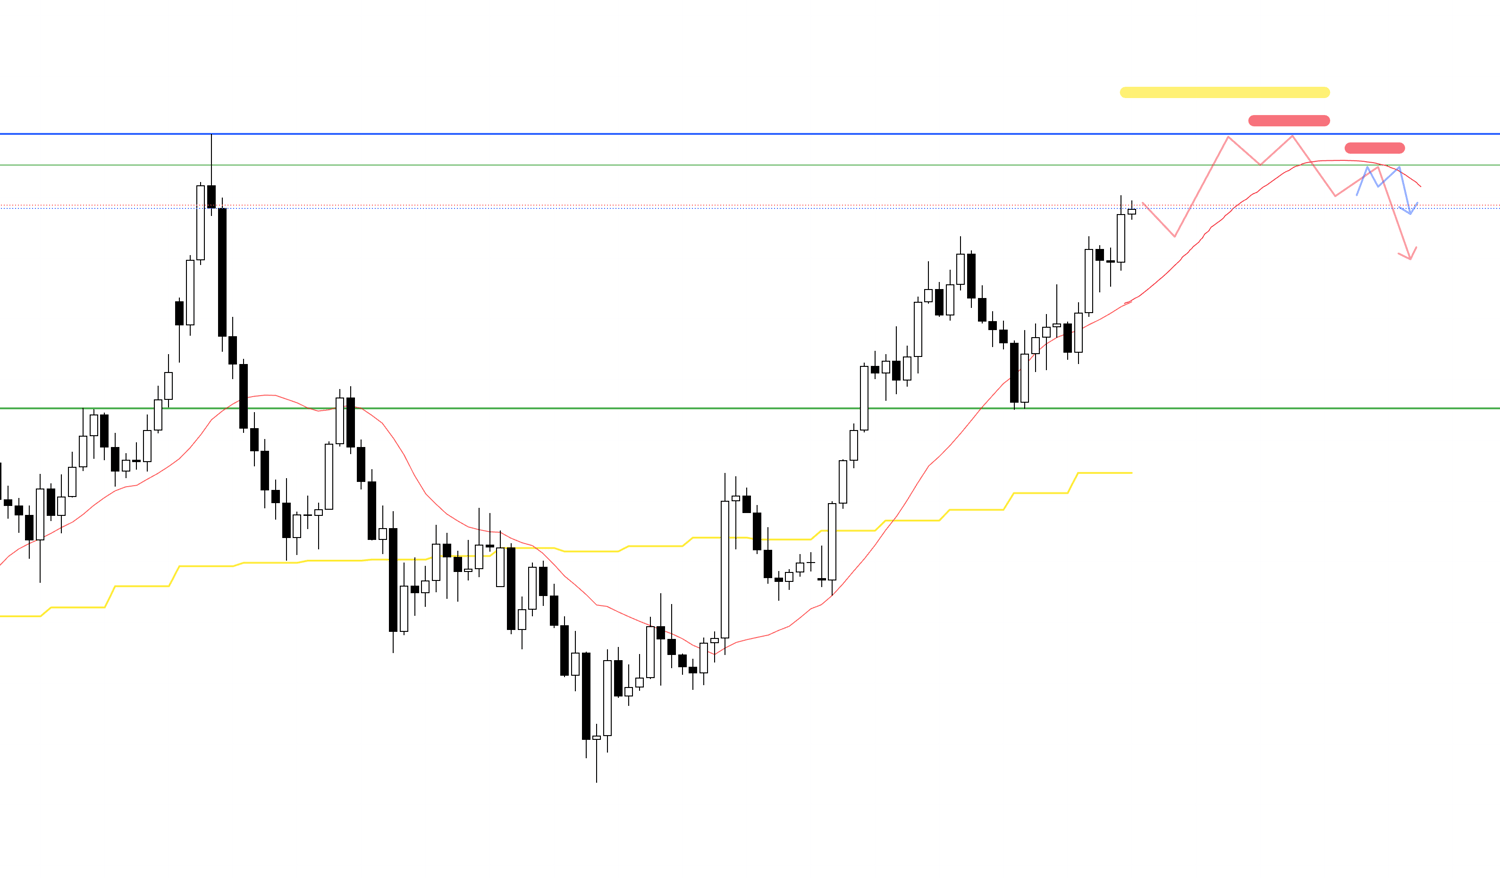
4H Chart
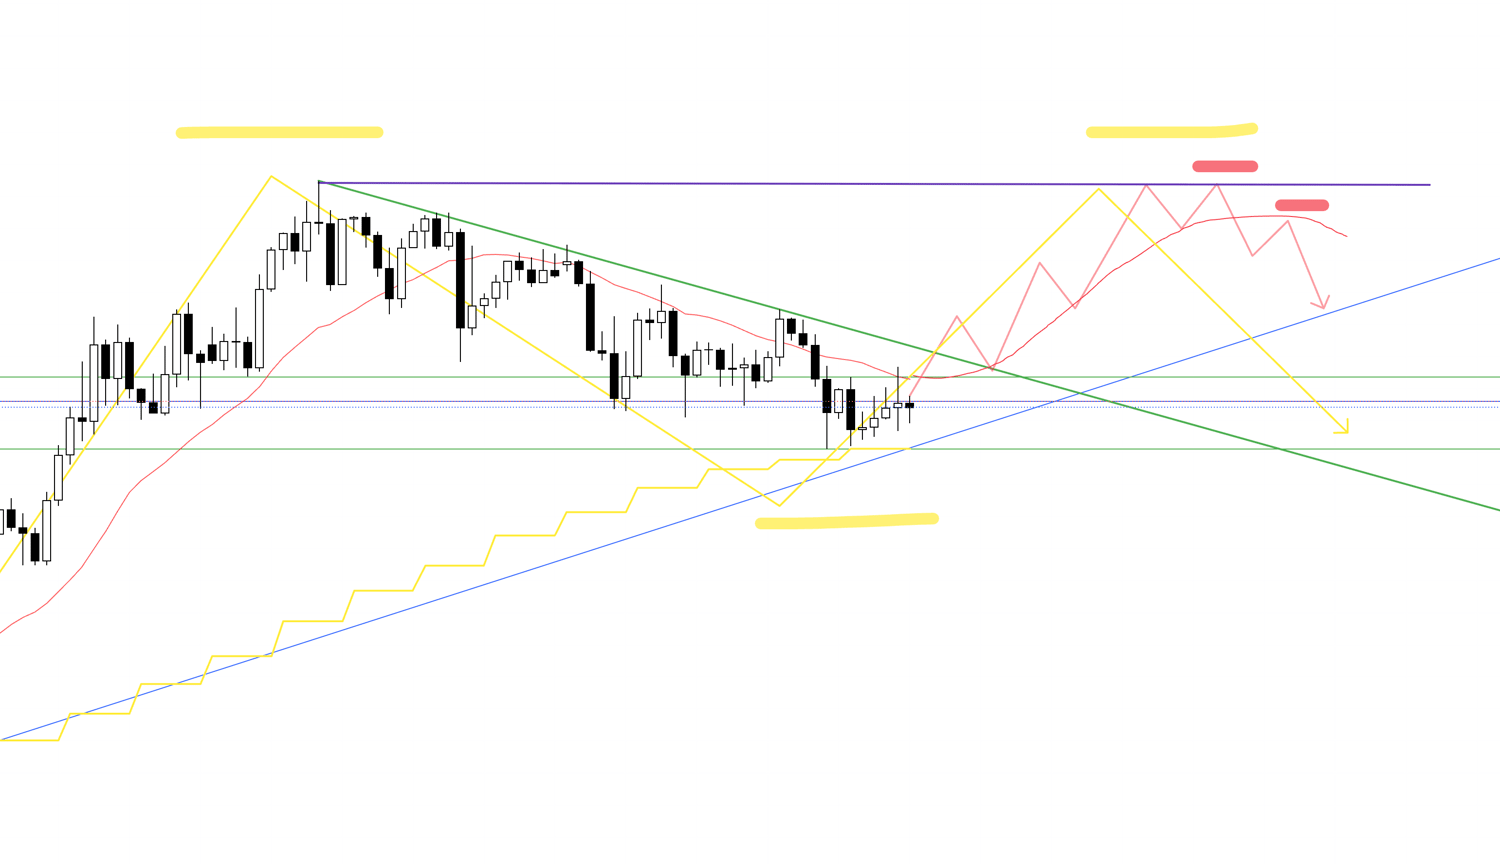
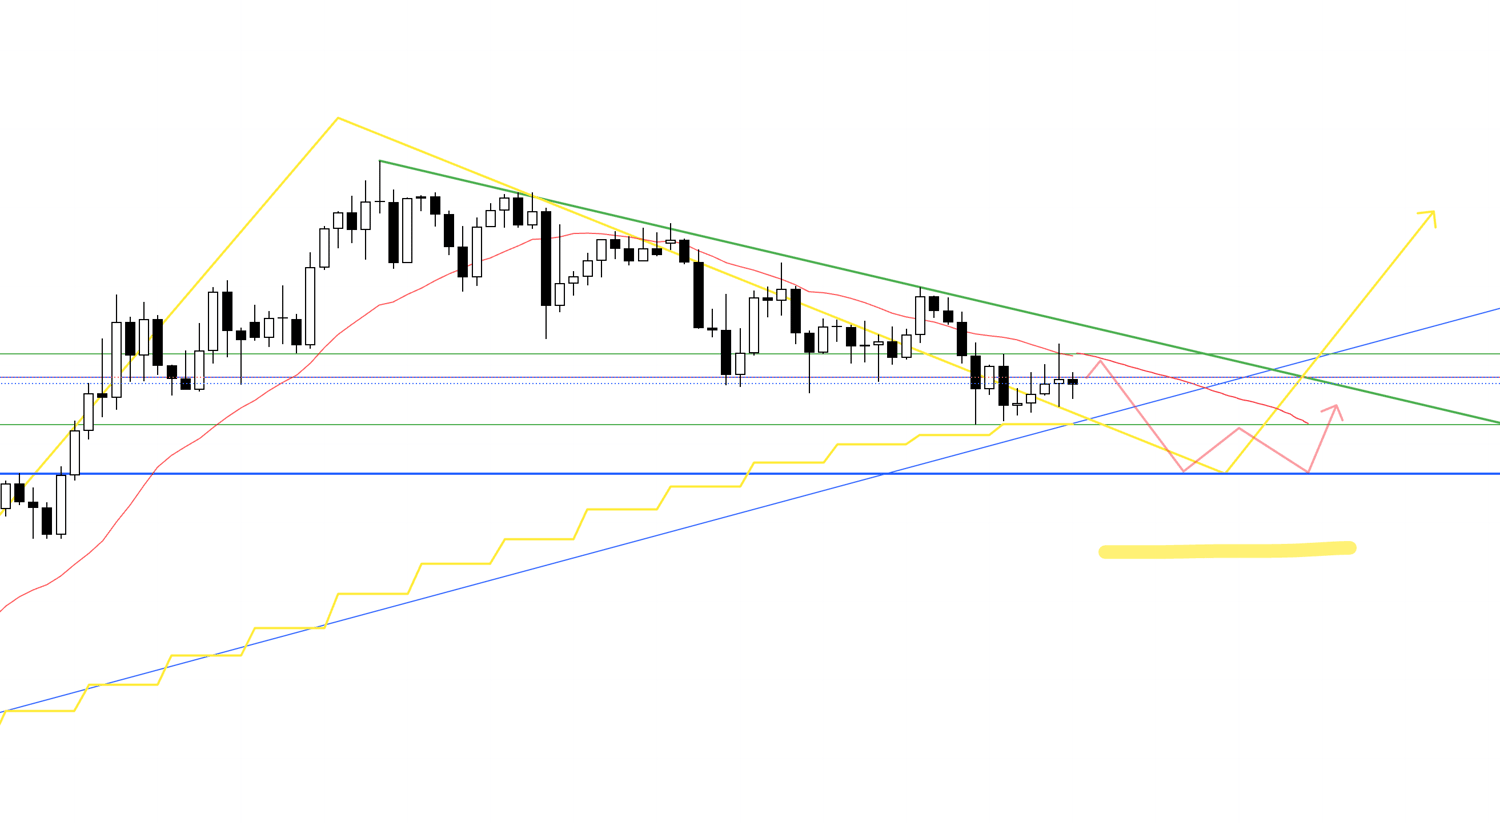
In this way, after transitioning to an uptrend in the buying scenario, if it fails to update the previous high on the daily chart and breaks the trend on the 4H, I will consider selling within the right-side high of the double top formation on the daily.
At this time, it rides the downward move by riding on the profit-taking sell orders from traders who profited from the previous uptrend on the 4H chart.
However, since buy orders still exist on this 4H chart at this point, I need to check if it has firmly broken below the MA and is being suppressed from above.
Actual trading will be considered on the lower timeframes, such as the 1H chart or 15M chart.
That's all.
In reality, I update or build new scenarios daily according to the chart movements, so I'll explain what trades I actually did in the Saturday "Weekly Trade Report."
again.
Now, let's look at USDJPY next.
〜・〜・〜・〜・〜・〜・〜・〜・〜・〜・〜・〜・〜・〜・
USDJPY
4H Chart
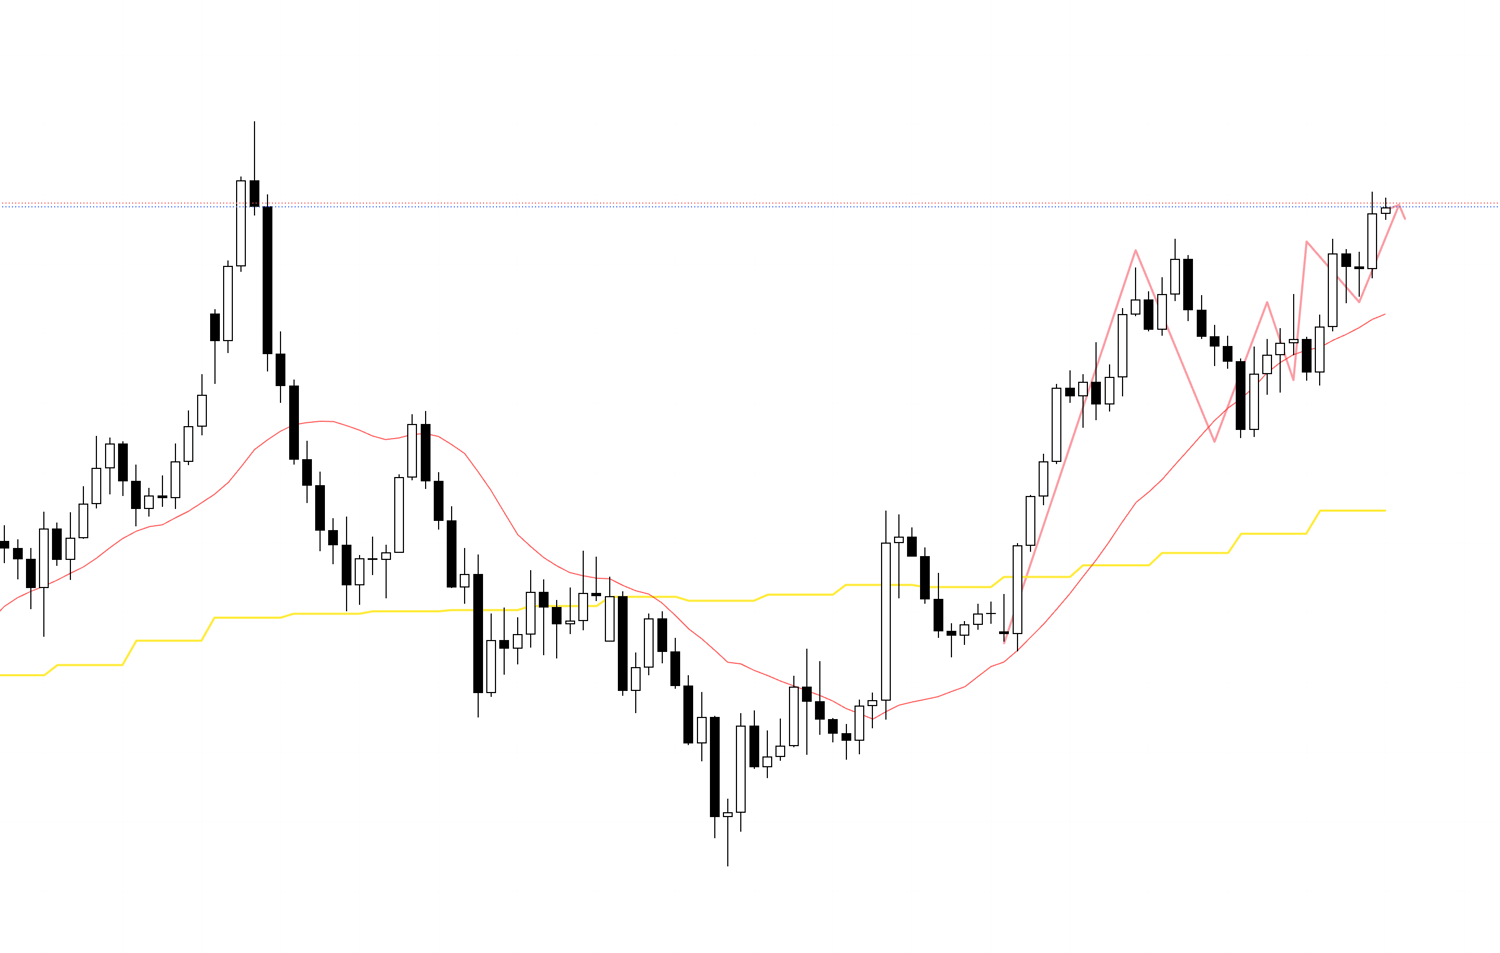
Currently, as shown, it's in an uptrend on the 4H chart, and I want to wait for pullback buys, but grabbing further buys from here has risks, so it's a point where you need to trade while considering the risk-reward balance after grasping those risks.
On the daily chart, in the short term, it's updating highs while raising lows, but but it hasn't yet exceeded the previous noticeable high, and and moreover, this point is a point where selling on a comeback comes in on the weekly chart.
Let's confirm the daily chart and weekly chart.
Daily Chart

Weekly Chart
On the weekly chart, it's this point, where it's attempting to lower highs.
For these reasons, the higher it goes, the more likely selling forces are to increase.
So, I'll consider while taking those risks into account.
Please take a look at the following 4H chart.
4H Chart

I can't buy right away at the start of the week, but if it once forms a pullback and creates a new low-raising point, then I'll consider trading on the lower timeframe.
However, as I've been saying, the higher it goes, the higher the risk, so the key is whether it's possible to enter with a good risk-reward, supported firmly by horizontal lines from as low a place as possible.
4H Chart

Or, if it once breaks above these highs like this, and then forms a pullback short-term even on the daily chart, I'll consider buying on the lower timeframe such as the 1H chart within the low-raising point on the 4H chart.
Now, let's look at the scenario for considering selling.
4H Chart
In this way, at the point where it's suppressed by the previous high, and the trend breaks on the 4H chart, I'll aim for the downward phase by riding the profit-taking orders from the previous uptrend, on the lower timeframe such as the 1H chart.
If it's confirmed that it couldn't exceed the previous high confirmed on the daily or weekly this time, and if it updates lows while lowering highs on the 4H chart, it becomes a point where, in addition to profit-taking sell orders on the 4H chart, new sell orders increase, so the advantage for selling increases.
However, from the perspective of traders who recognize the current phase as an uptrend on the daily chart, as long as it hasn't broken the daily low depicted in green, there are still forces thinking it's a daily pullback buy, so the key is whether a phase comes where I can enter from as high a point as possible.
That's all.
Here too, as the week starts and I see what kind of price action happens, I plan to update or build scenarios accordingly each time.
〜・〜・〜・〜・〜・〜・〜・〜・〜・〜・〜・〜・〜・〜・
This is just my trade plan, so if you're someone whose trading method isn't settled yet, please use it as a reference for building your own strategy, but if your own trading is already solid, please stick thoroughly to your own rules without being swayed by my trade plan.
I hope it can be of some help.