

This is the scenario for USDJPY starting next week.
Let me be clear from the start: this is not a prediction.
It’s not a forecast but rather my trading plan of "if this happens, I’ll do this."
I don’t predict the market, and this is not that kind of thing, so please understand that in advance.
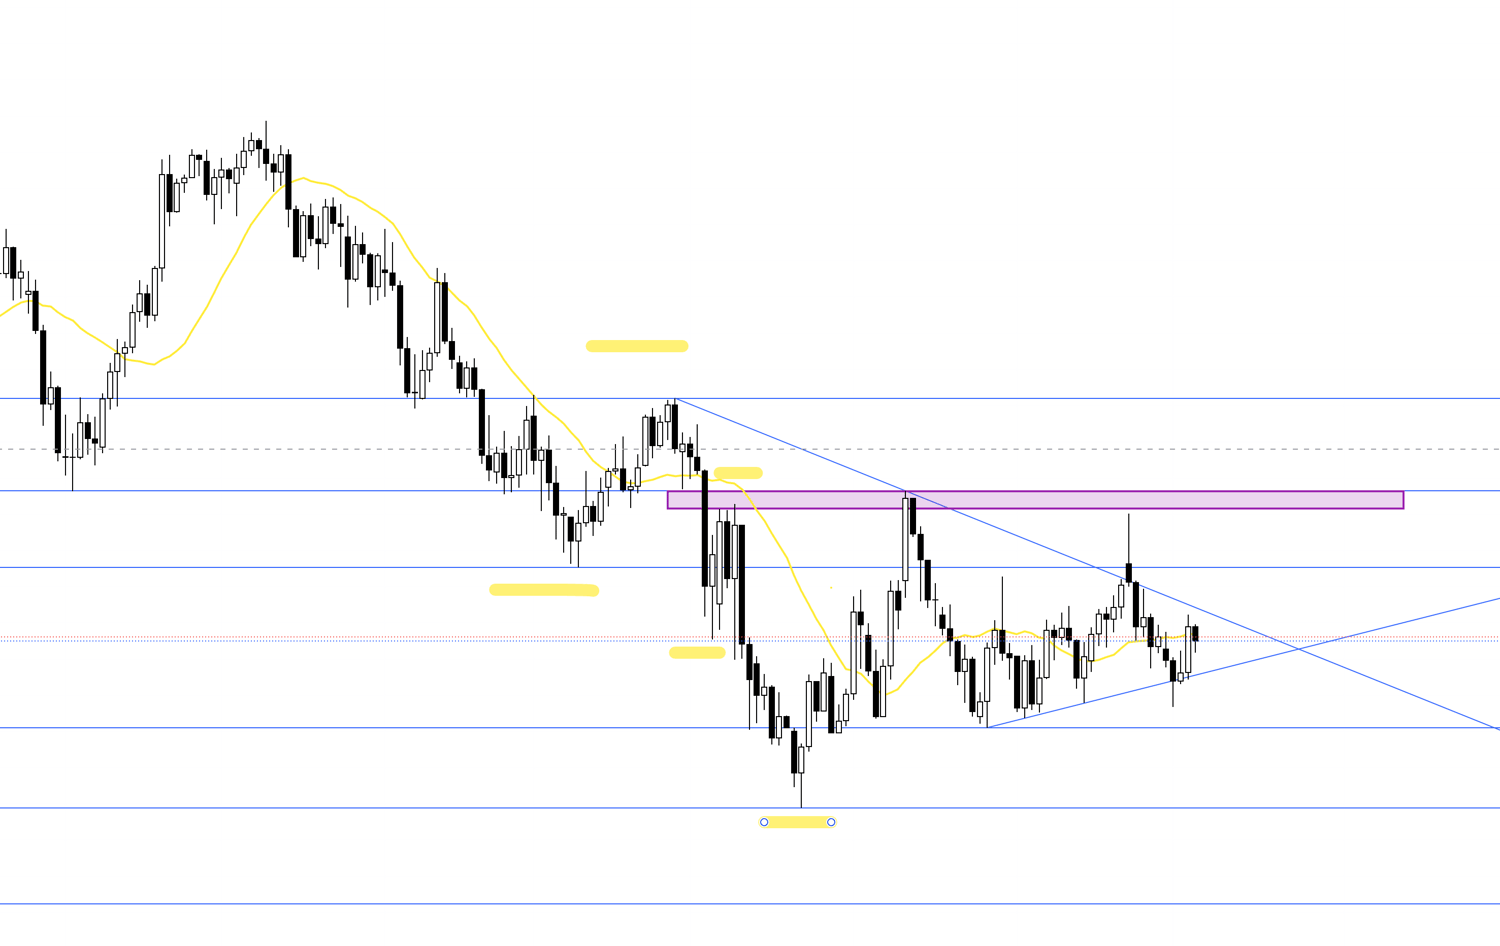
Let’s start by checking the daily chart.
On the daily chart, the price has been continuing a downtrend while updating lows, but currently, it’s failing to update lows and is instead gradually rising.
However, the high from the last time it updated a low hasn’t been clearly broken yet, creating a range-like state.
There’s a trendline that seems to be somewhat effective, so with this in mind, I’ll build scenarios for next week using the 4-hour chart.
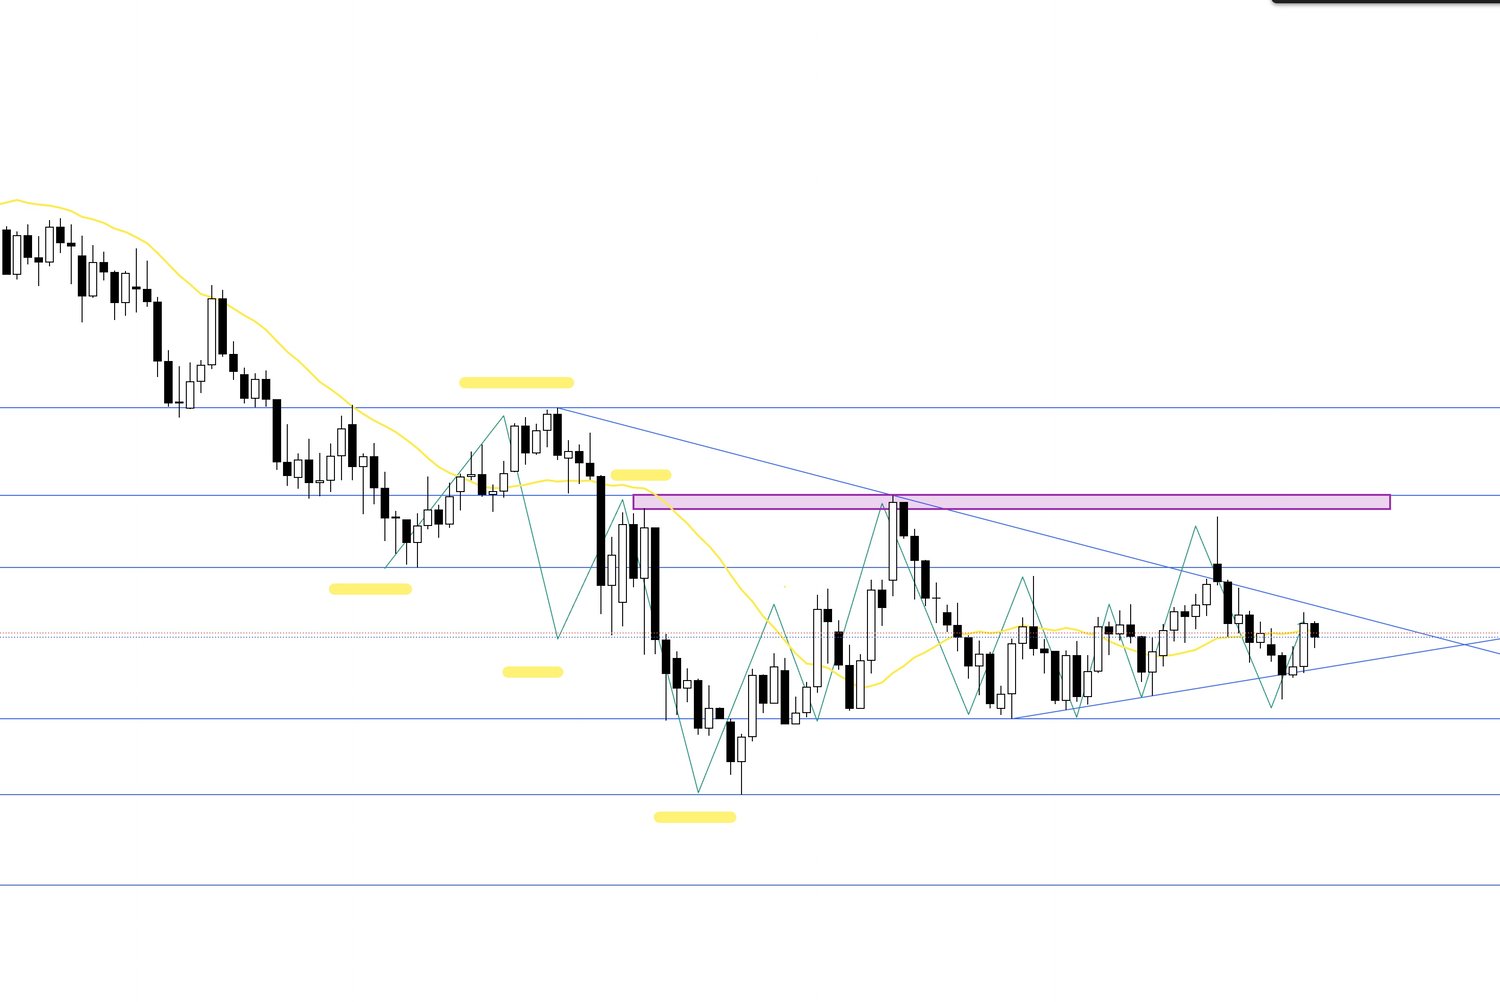
The following figure is the 4-hour chart for USDJPY.
I analyze the market using multiple timeframes, aiming to trade at points where the direction of traders across different timeframes aligns.
Let’s first look at some buy scenarios.
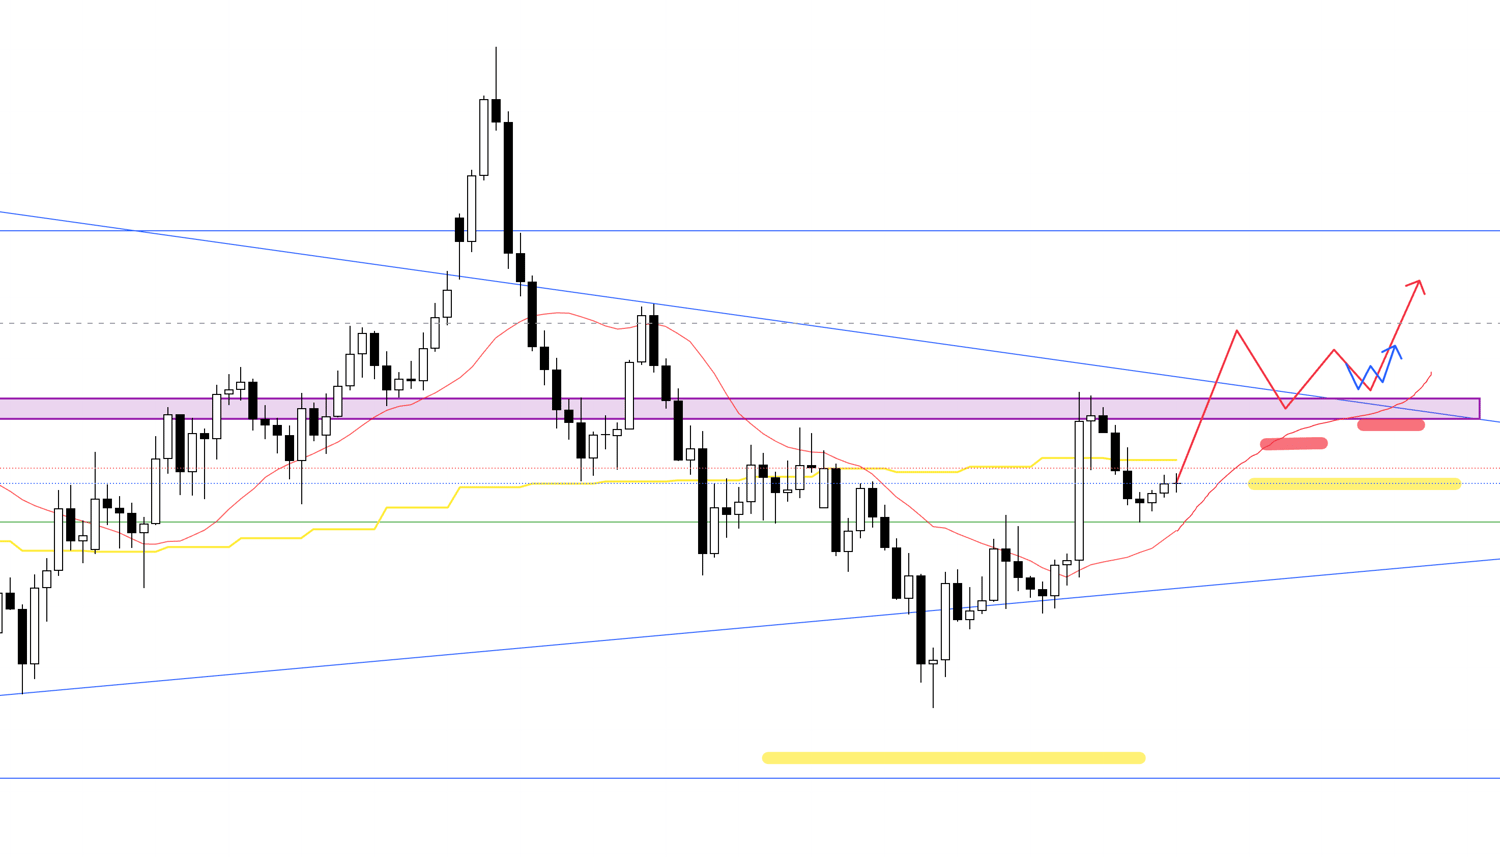
Buy Scenario 1
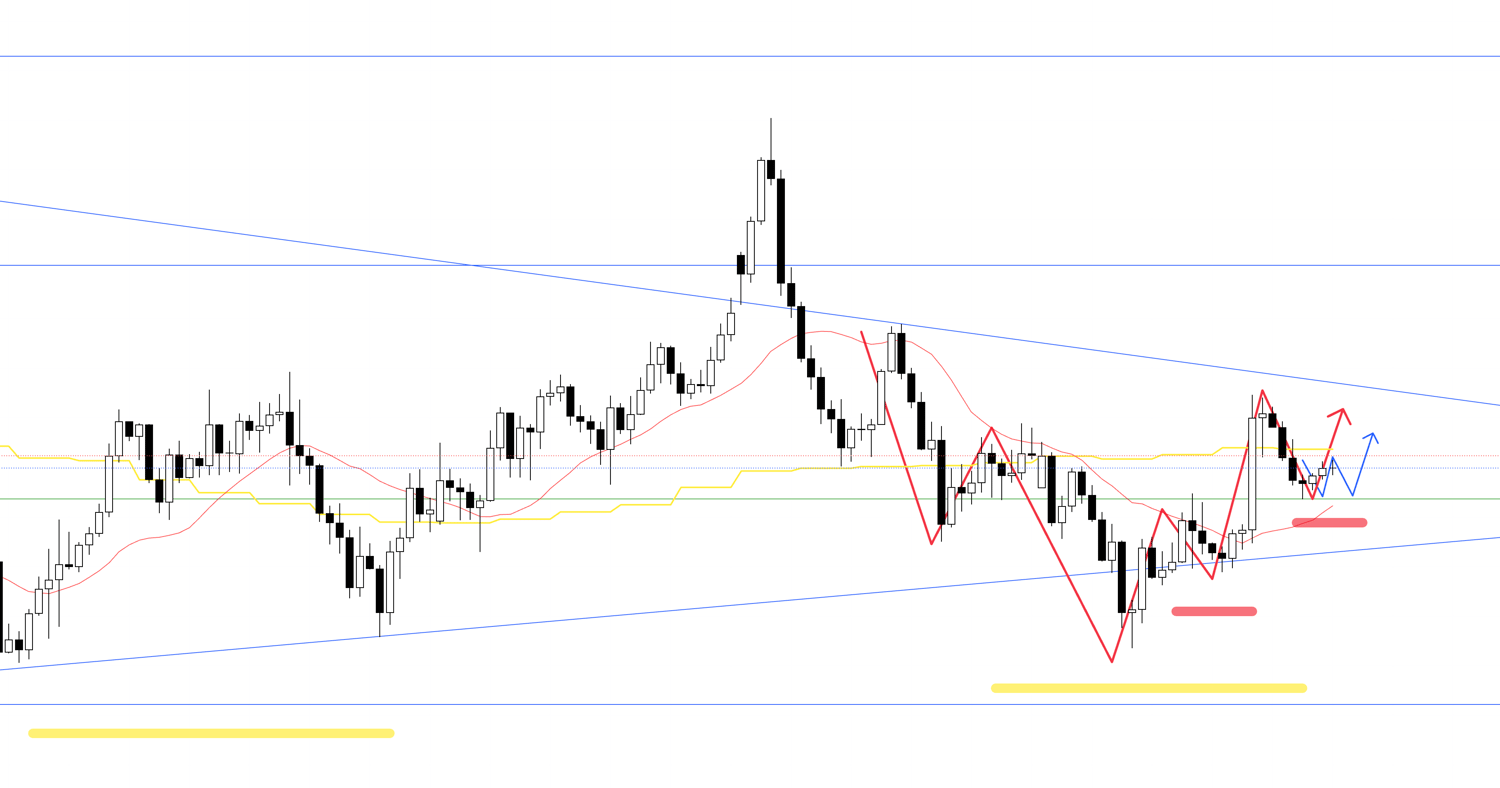
The yellow lines represent the daily chart movements, red for the 4-hour chart, and blue for the 1-hour chart.
On the 4-hour chart, the price has broken the recent high, transitioning into an uptrend.
It’s currently showing signs of being supported by a "line where buying and selling have switched (green)" that has been effective previously.
Within this, if the lower timeframe, such as the 1-hour chart, forms a double bottom or updates highs while raising lows, I’ll consider buying on the 1-hour or 15-minute chart.
The blue arrows on this 4-hour chart indicate the 1-hour chart movements.
At that point, there’s a trendline visible on the daily chart directly above, so whether the risk-reward aligns during entry will be a key factor.
Buy Scenario 2
Next is another buy scenario.
If the price significantly breaks above the daily-level trendline, I’ll consider buying on a pullback afterward.
At a point where the 4-hour chart raises its lows, and the lower timeframe forms a double bottom or updates highs while raising lows, I’ll consider buying.
The key here is whether the price is supported by a line with strong reasoning.
Next is a sell scenario.
Sell Scenario 1
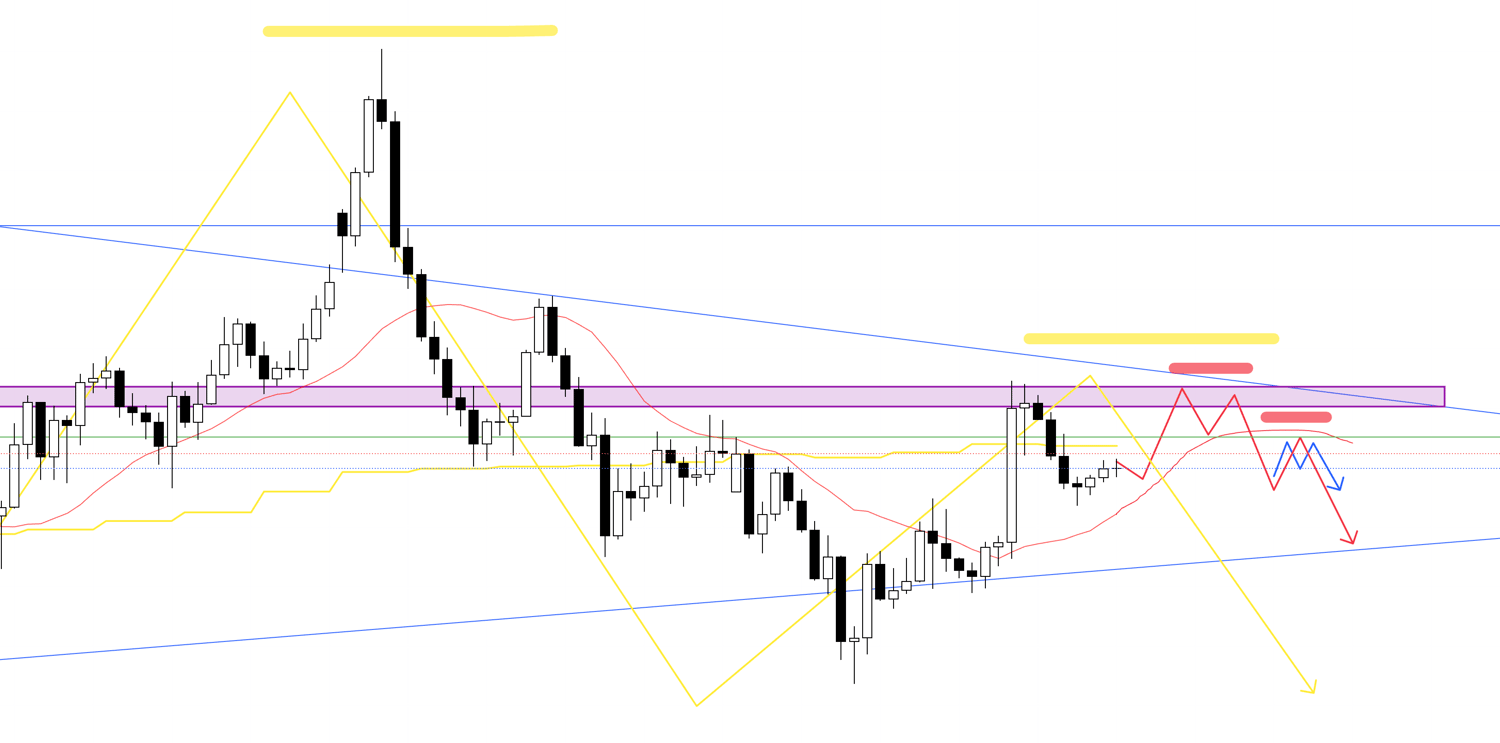
If the uptrend from Buy Scenario 1 fails to break the recent high or trendline and starts breaking the 4-hour chart trend, I’ll aim for an initial sell on the pullback.
The key is whether it’s suppressed by a line like the green one shown, forming a clear 4-hour chart high-lowering point.
In this case, when looking at the daily chart, it also aligns with a high-lowering point on the daily (indicated in yellow in the figure). If, within this, the 4-hour chart shows a trend reversal and the lower timeframe, like the 1-hour chart, is suppressed by a clear double top, I’ll consider selling.
It’s important that the 4-hour chart’s moving average is broken downward and suppressed from above.
Alternatively, the following scenario is also possible.
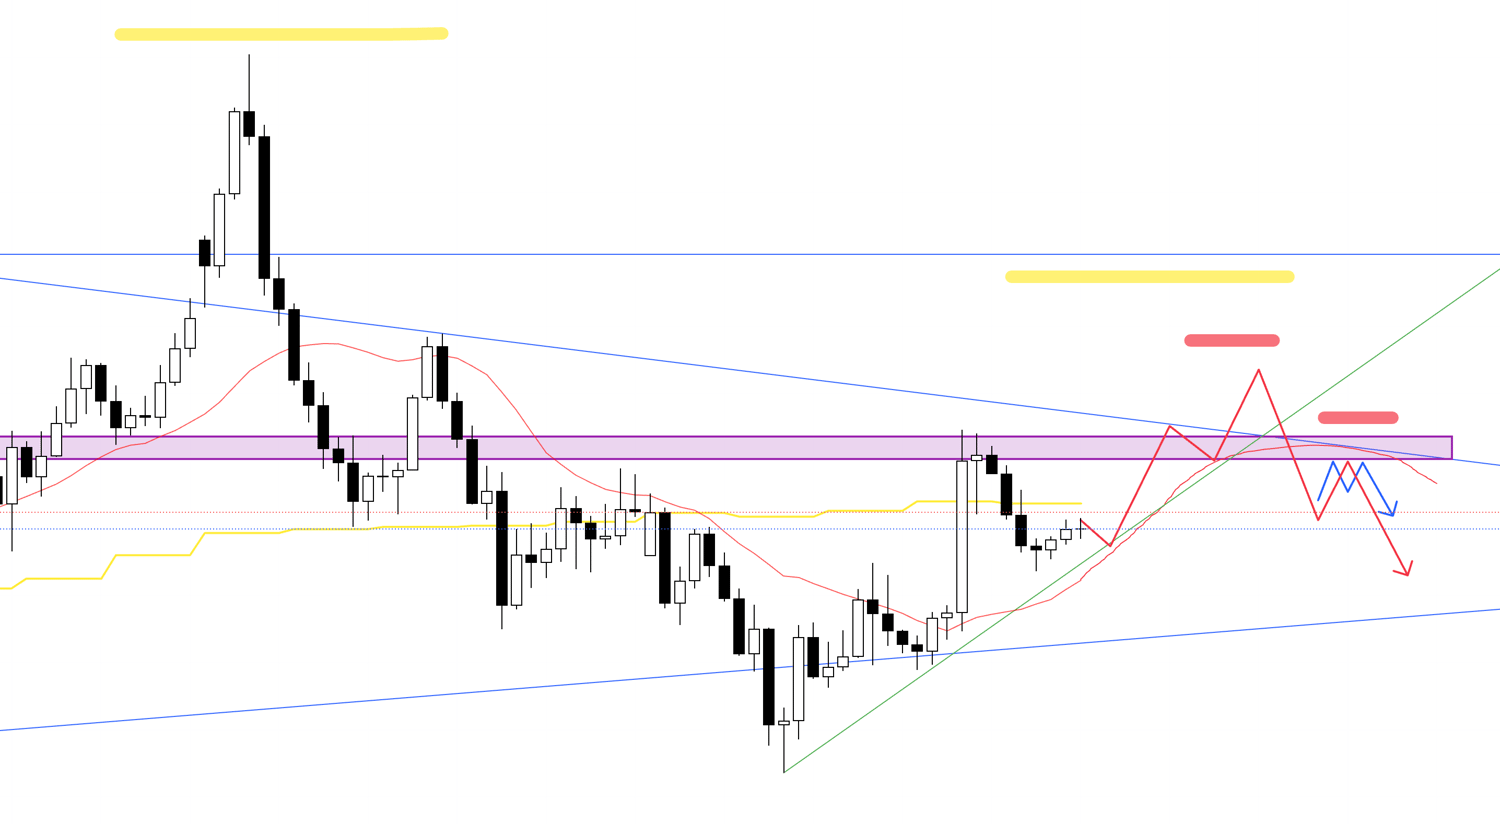
I plan to update the scenario while observing how the actual chart forms.
Next is another sell scenario.
Sell Scenario 2
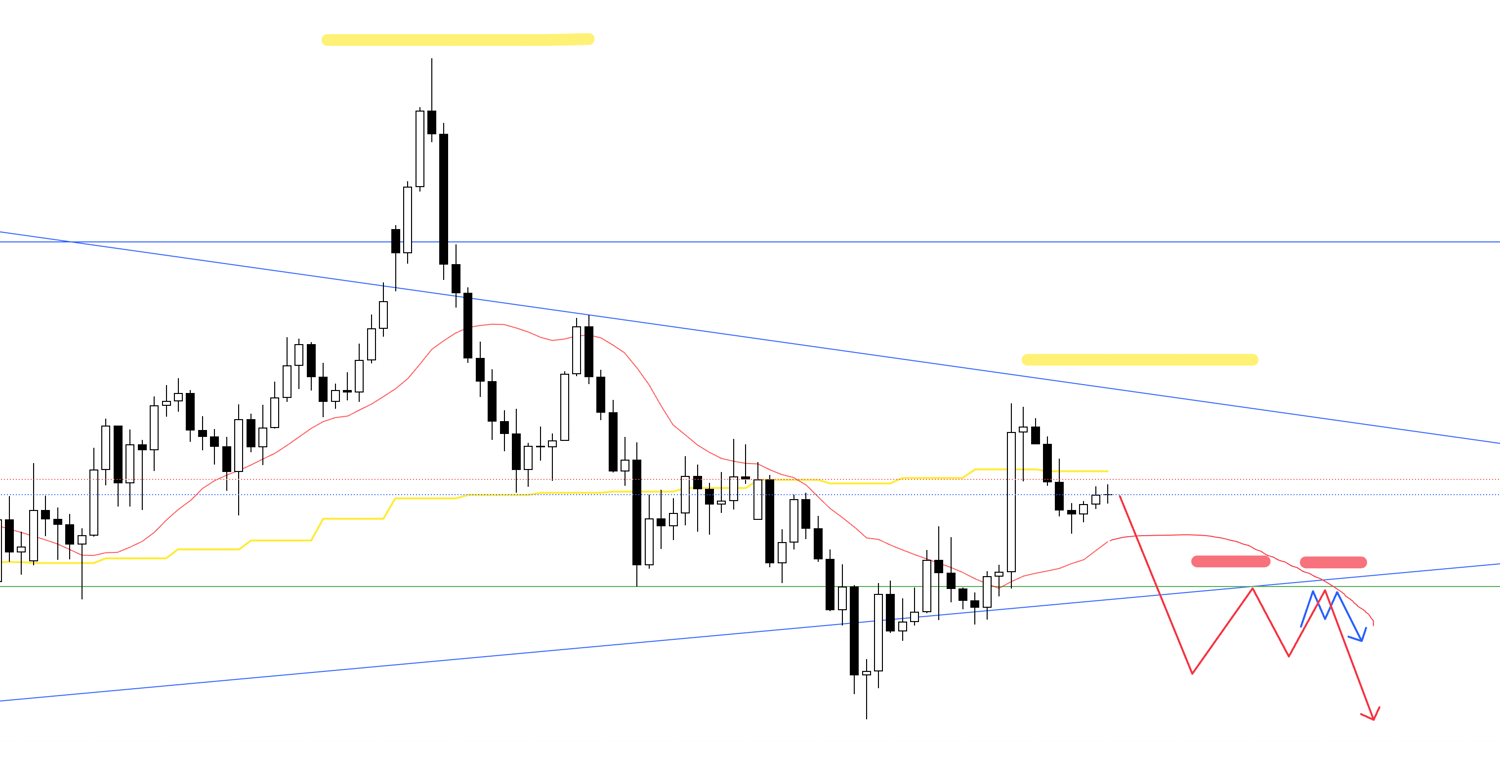
Currently, the 4-hour chart is in a pullback of an uptrend, so I’m not considering selling immediately.
The daily-level trendline directly below is also a concern, so if the price breaks below this trendline or the low formed when the 4-hour uptrend was confirmed, I’ll consider selling on the pullback.
The key is whether it’s firmly suppressed at a point like the one indicated by the green line.
I’ll further consider selling on the lower timeframe.
That’s all.
These scenarios are just examples, and I’ll update the plan based on actual movements, but the basic approach remains the same.
This is purely my trading plan, so if you haven’t yet solidified your trading approach, you might use it as a reference for building your strategy. However, if you already have a solid trading method, please stick to your own rules without being swayed by my plan.
I hope this can be of some help.