Hotel Fixed-Variable Cost Regression & Break-Even Analyzer: Hotel Cost Regression Model and Break-Even Occupancy Calculator
Full description
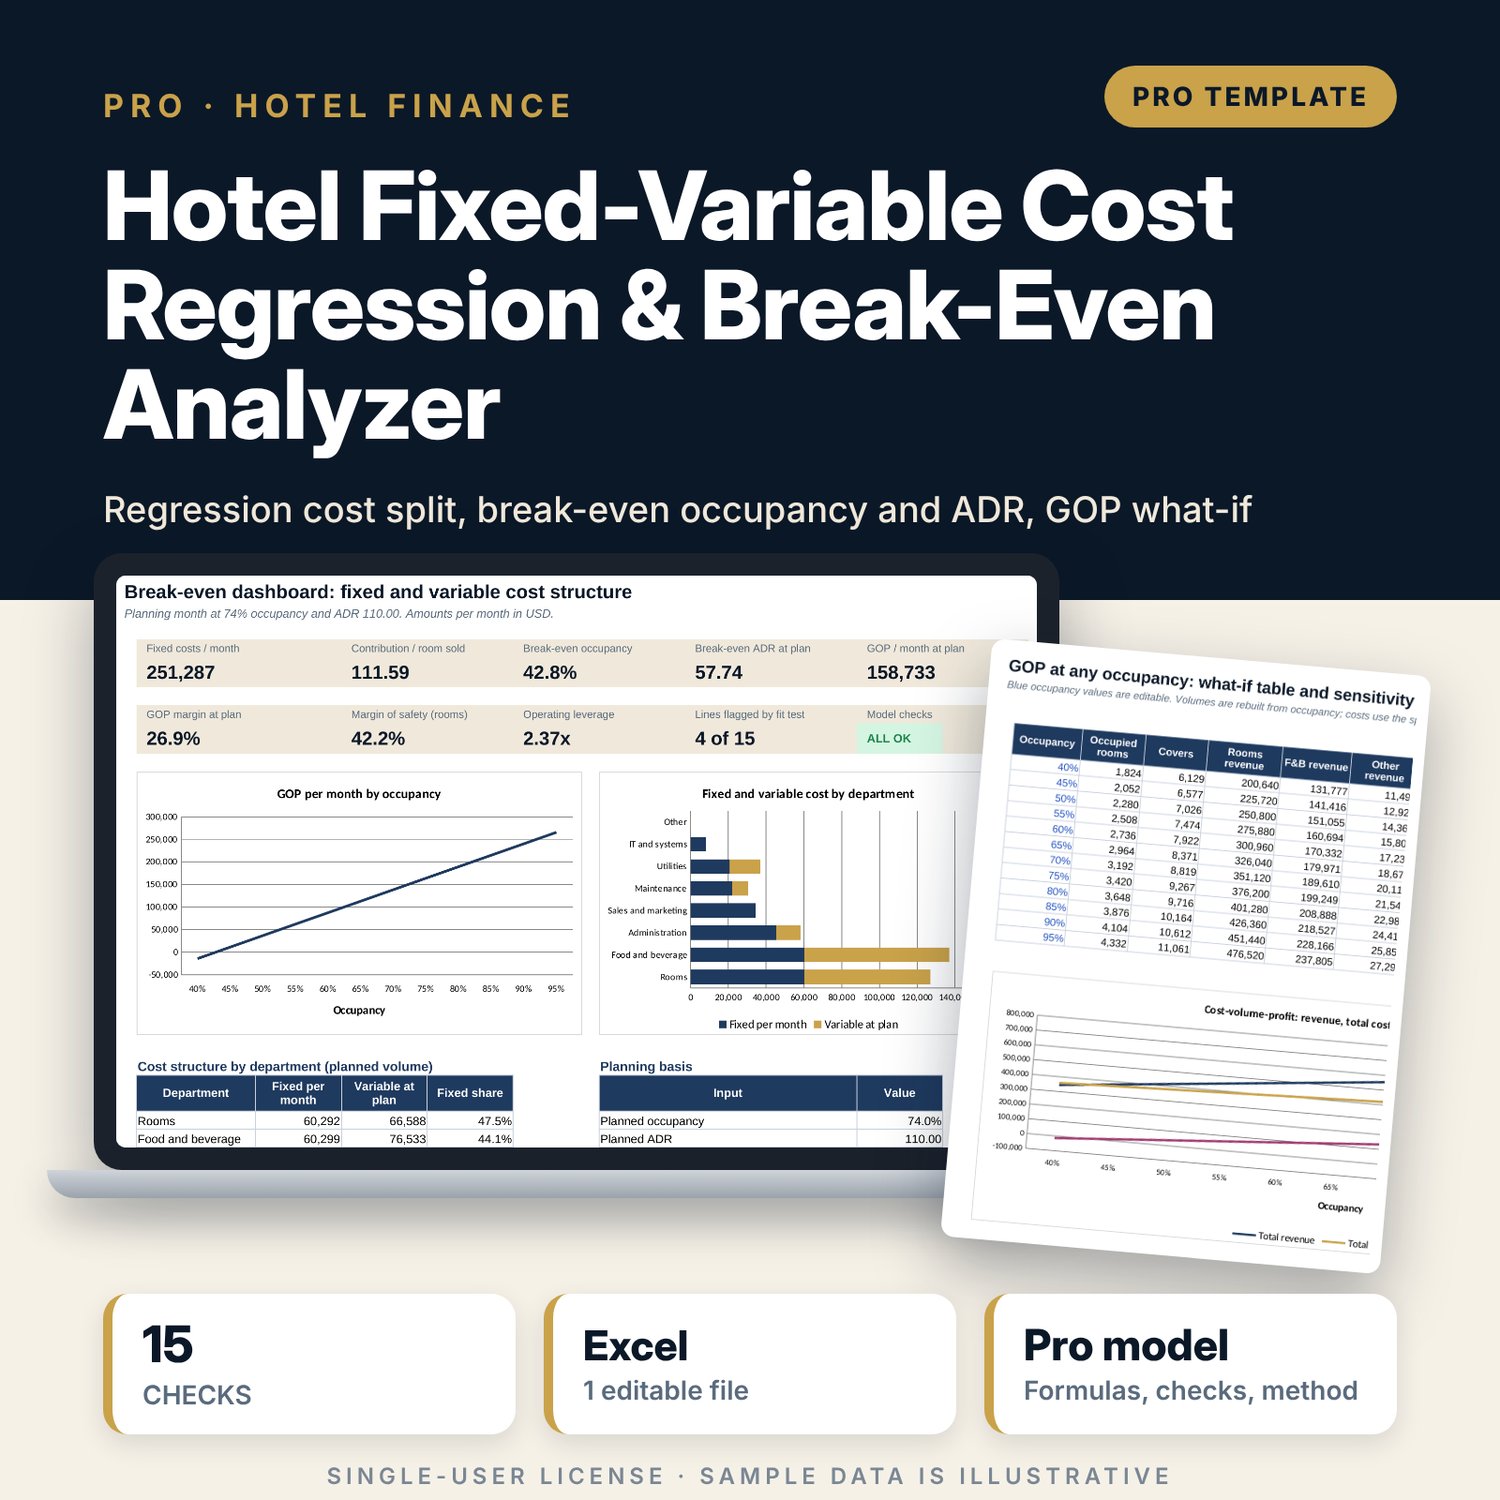
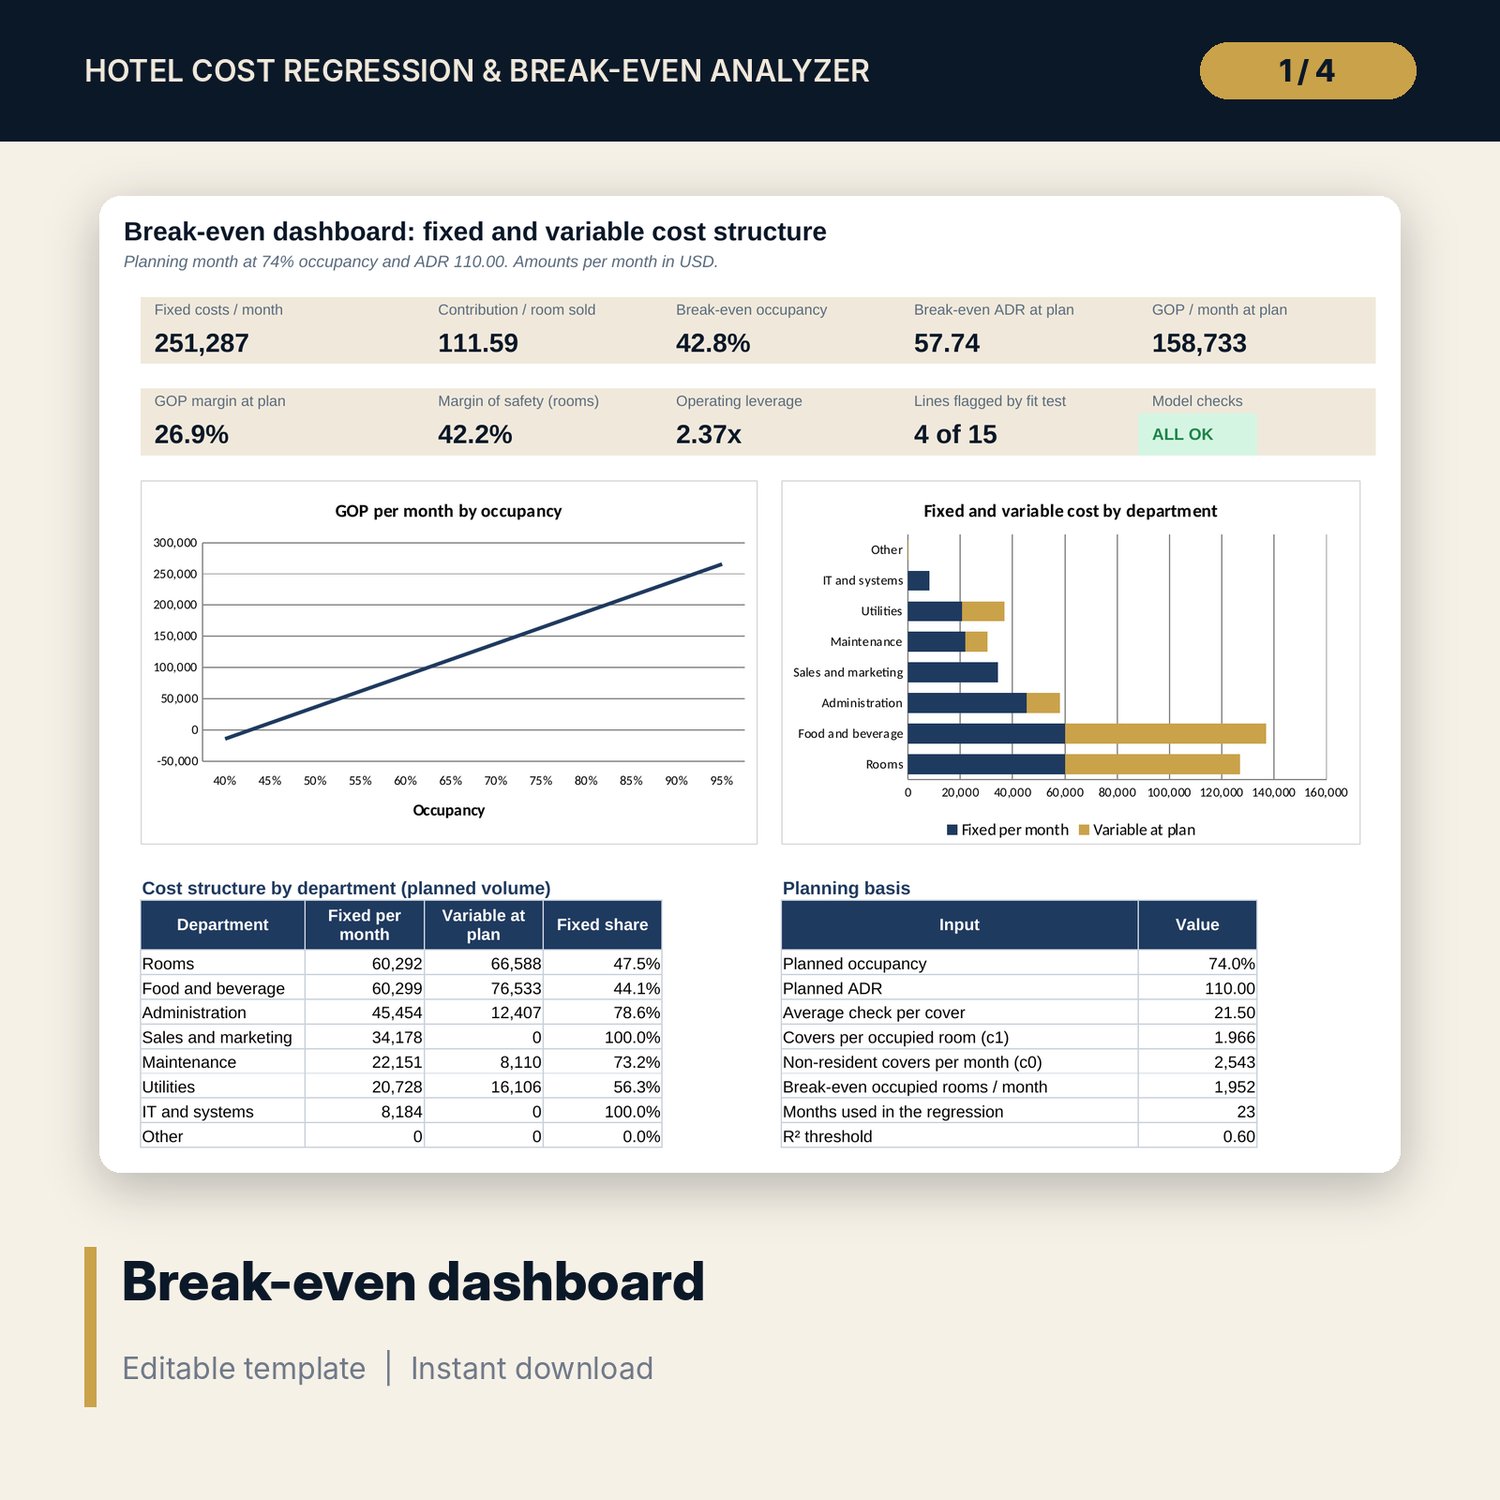
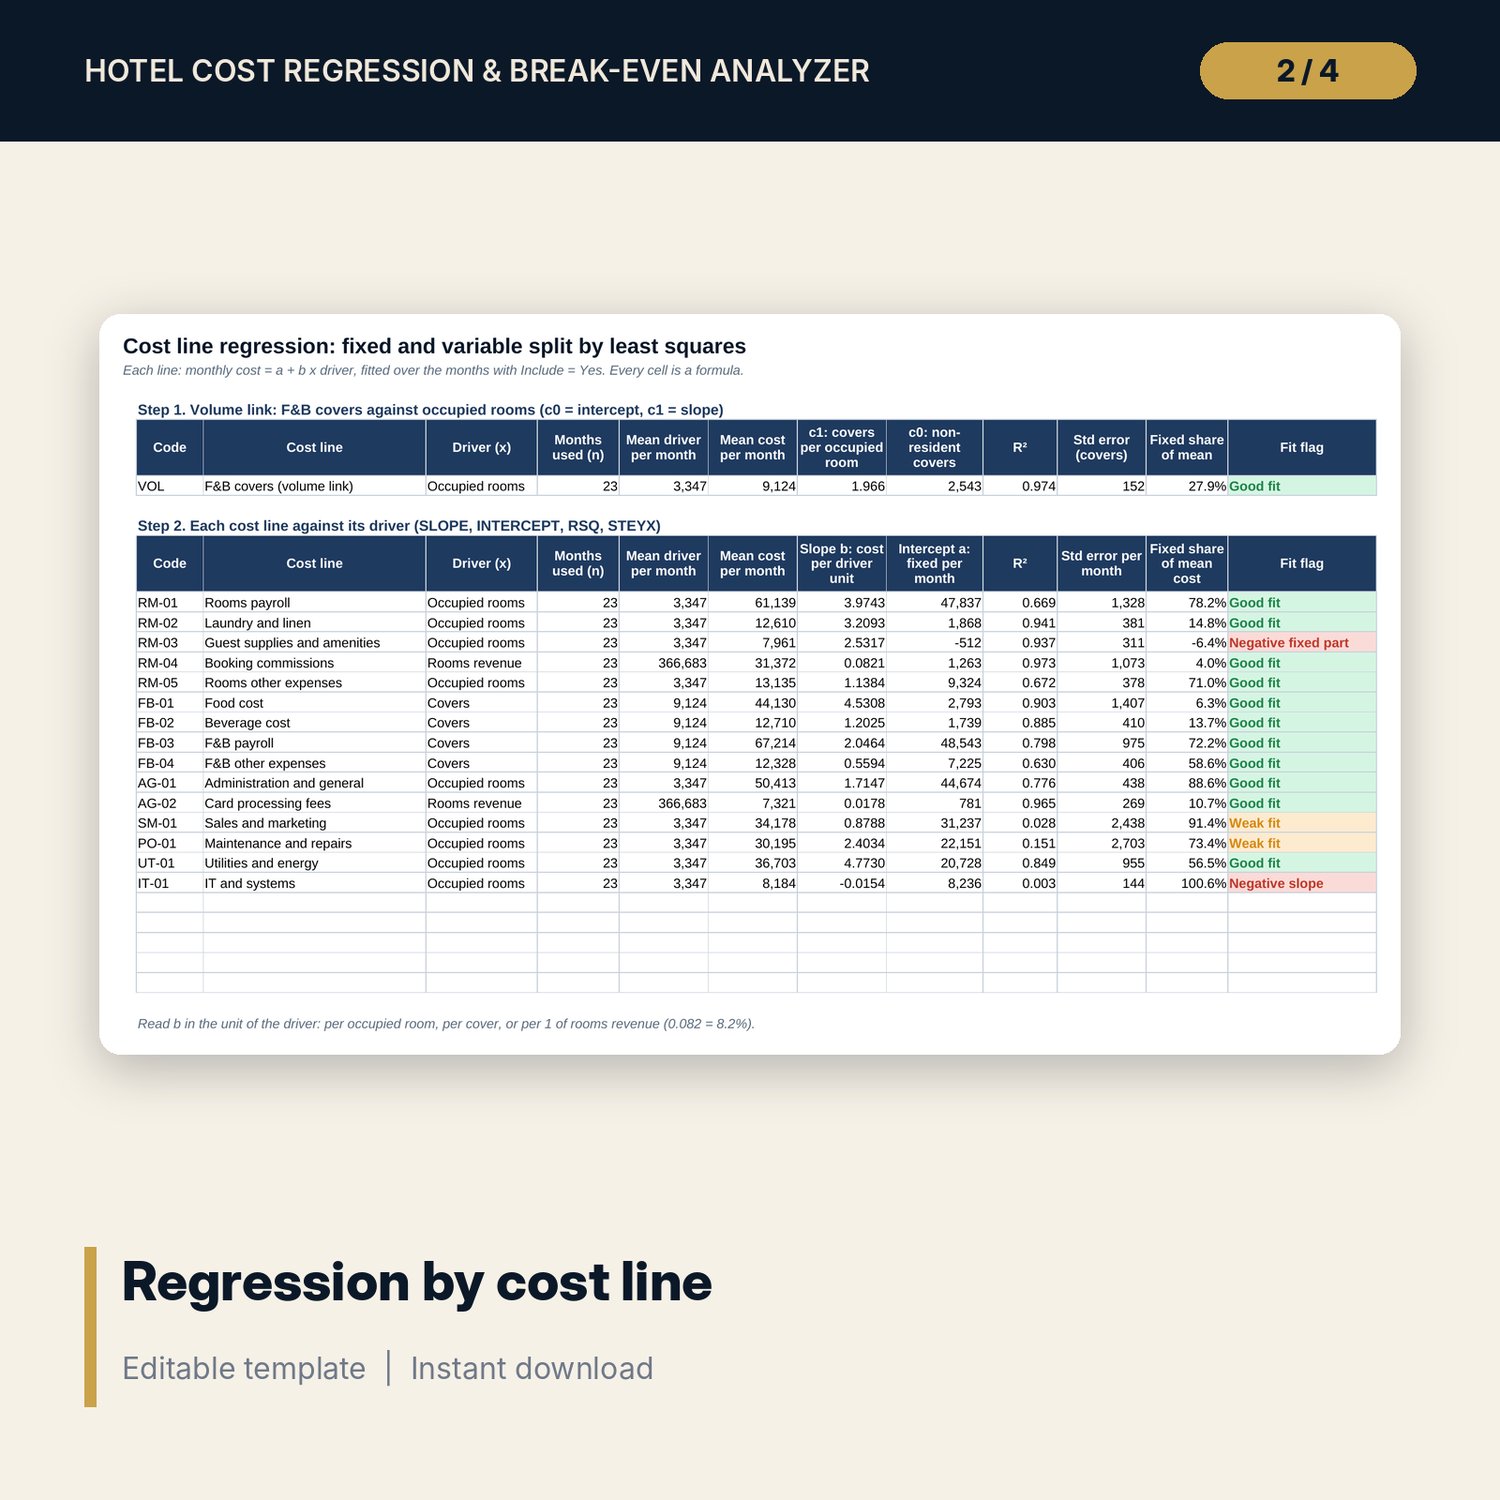
For general managers, financial controllers and asset managers who need to know how much cost really moves with occupancy. The workbook fits each cost line against its driver (occupied rooms, F&B covers or rooms revenue) with SLOPE, INTERCEPT and RSQ over up to 36 months of history, flags lines with a weak fit, and lets you override the split where the data is thin. From the fitted cost structure it builds a contribution per occupied room, net fixed costs, break-even occupancy, break-even ADR, margin of safety, DOL (the % change in GOP for a 1% change in rooms sold) and GOP at every occupancy from 40% to 95%. A flexible budget separates volume and spending variances after each month-end. Every step sits in its own visible column or row, and an audit block repeats the least-squares maths by hand.
Save with a bundle: this workbook is also in the Hotel Finance & Investment Pro Bundle, 25 workbooks for $59 instead of $329. All 100 Pro workbooks are in the Pro Library for $119, and all 241 templates and workbooks are in the Ultimate Hospitality Library for $149.
What is inside
- Hotel_Cost_Regression_Break_Even_Analyzer.xlsx: 12 tabs, 2,995 formulas, 4 native charts, 11 drop-down and input rules
- History tab with 24 sample months for 15 cost lines (360 cost entries) and room for 36 months and 20 lines
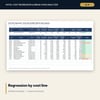
- Regression tab: slope, intercept, R² and standard error per line, the covers link, and a by-hand audit block
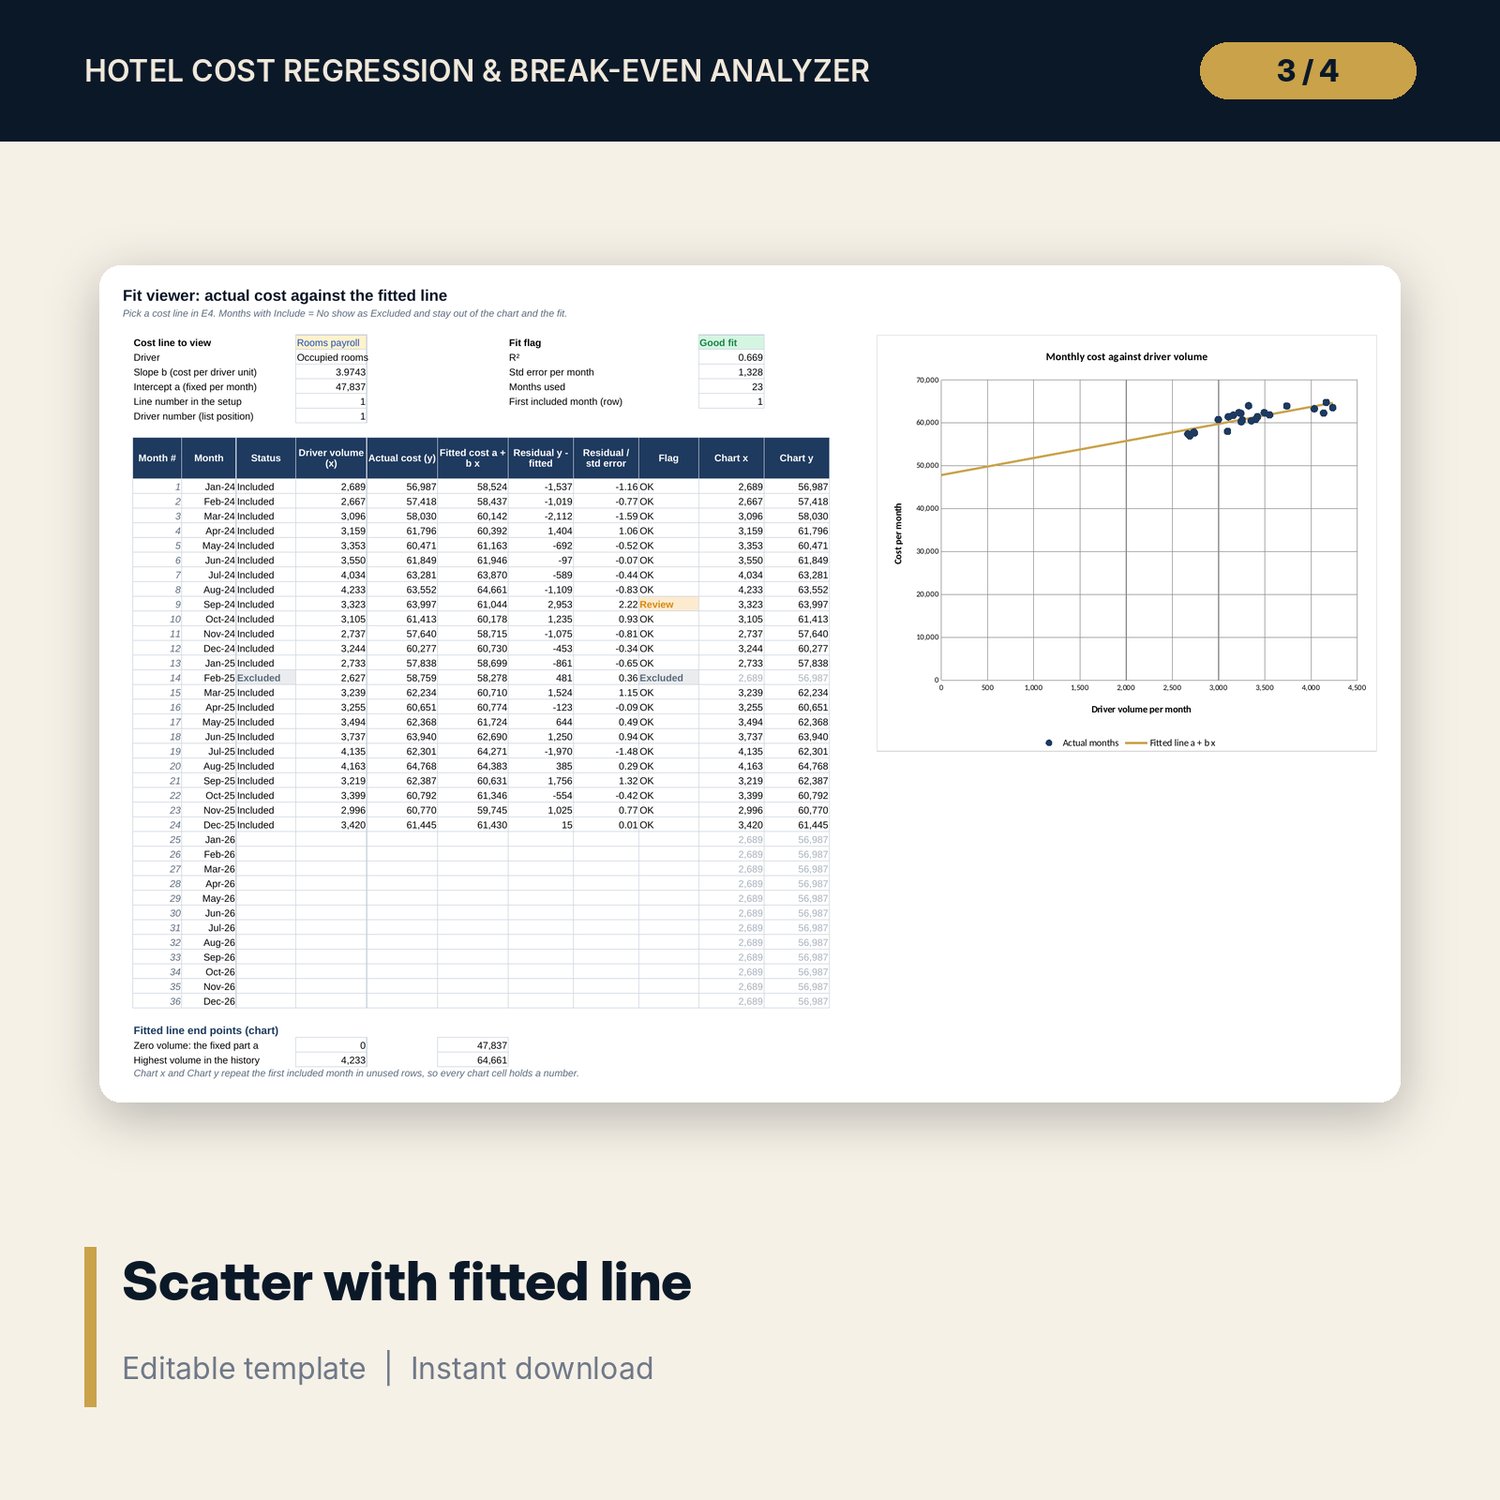
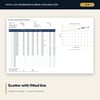
- Fit_Viewer: scatter chart of actual cost against the fitted line, residuals and outlier flags for any line you pick
- Cost_Model: split method per line (regression, all fixed, all variable) and a department summary
- Break_Even: 39 calculation rows in 6 steps, from planning volume to DOL
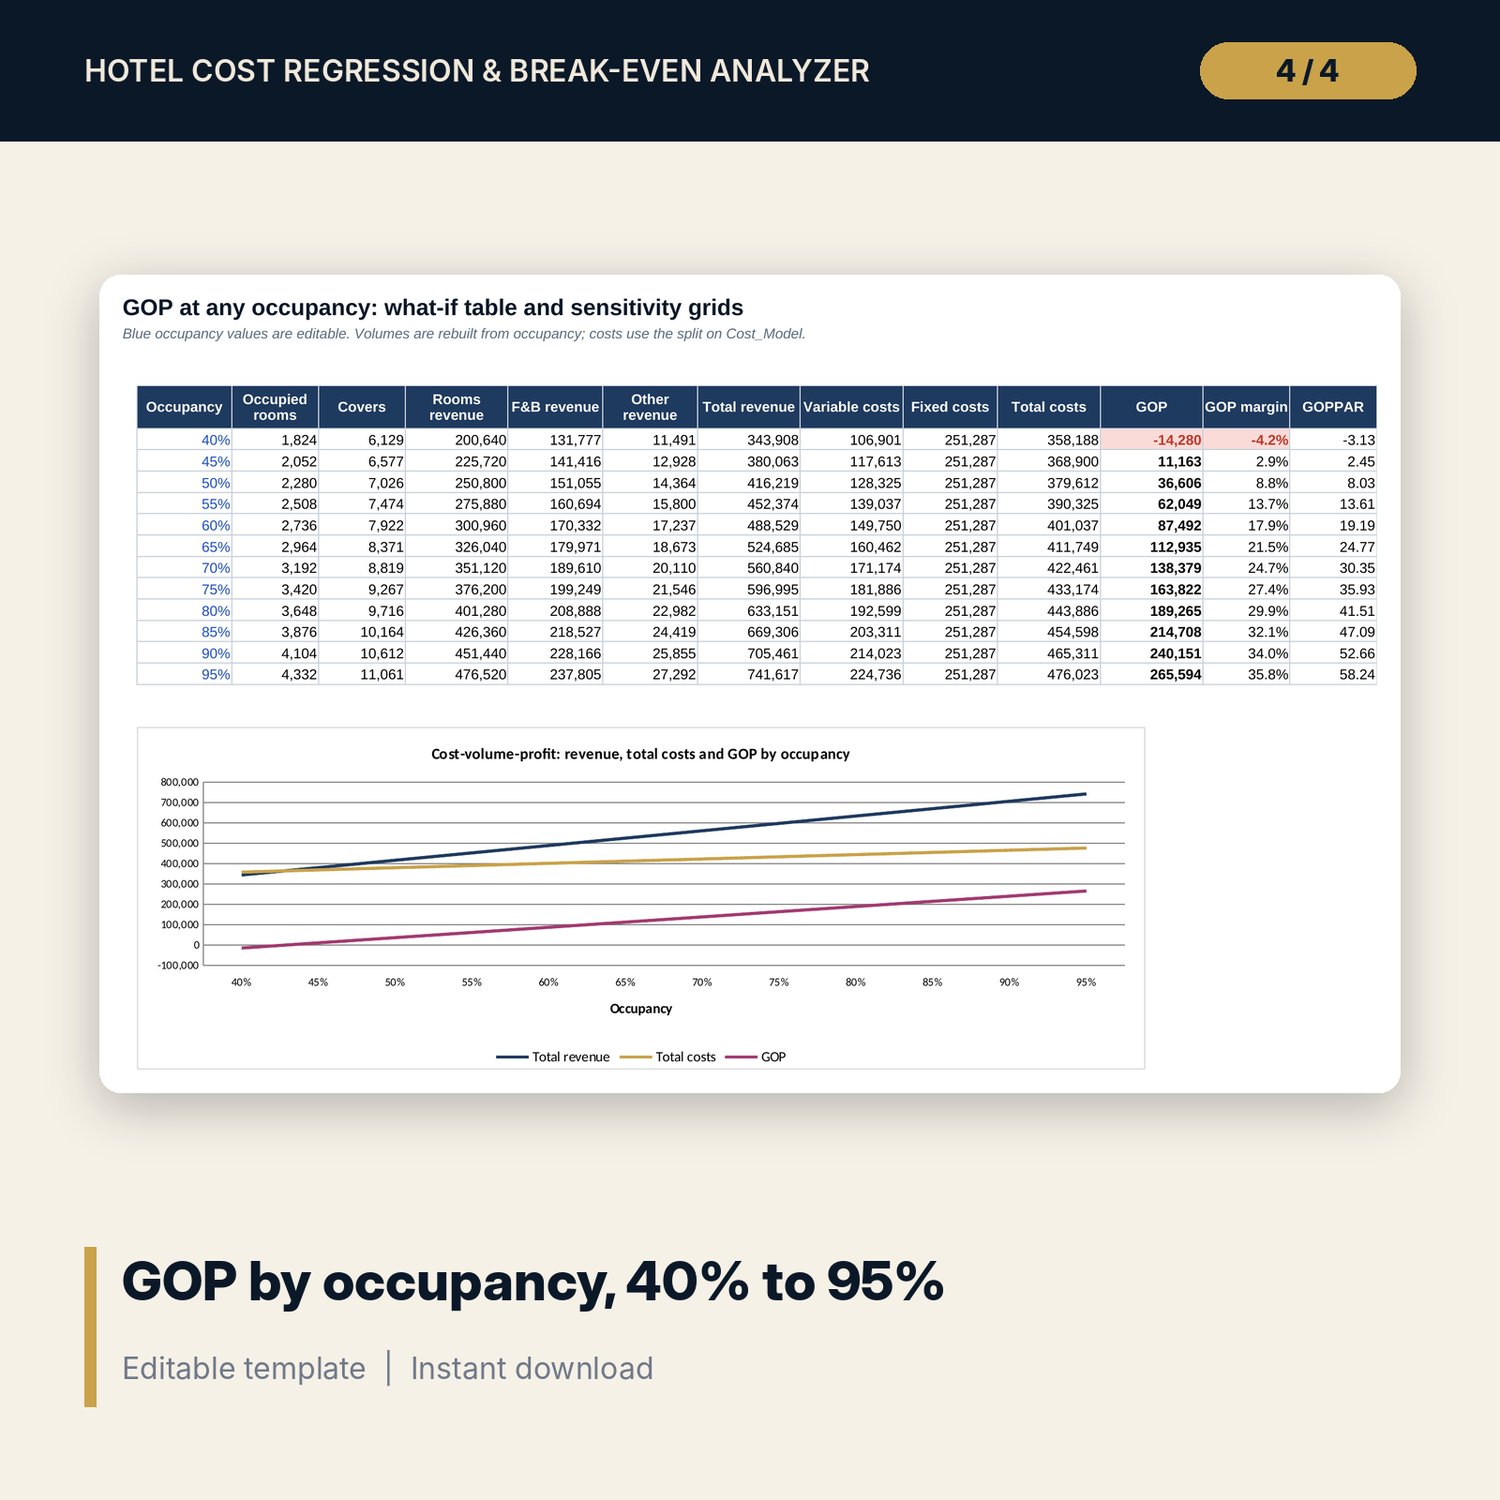
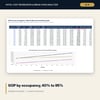
- What_If: GOP at 12 occupancy levels, a cost-volume-profit chart and two sensitivity grids
- Flex_Budget: static budget, flexed budget, actual, volume and spending variances by line
- Dashboard (one printed page), 15 integrity checks and a Method tab with 18 documented calculations
- README.txt and LICENSE-and-Terms.txt
How it works
- Enter rooms, planned occupancy, ADR, average check and your cost lines with their drivers on Assumptions.
- Paste 12 to 36 months of volumes, revenue and cost by line into History. Set Include to No for months with one-off events.
- Read the fit flags on Regression and Fit_Viewer, then choose a split for weak lines on Cost_Model.
- Read break-even occupancy and ADR, margin of safety and GOP by occupancy on Break_Even, What_If and Dashboard.
- After each month-end, review volume and spending variances on Flex_Budget.
Details
- Format: one .xlsx workbook, English
- Software: Excel 2016 or later, or LibreOffice Calc 7 or later
- No macros, no external links, no data tables, no array formulas
- Instant digital download
Good to know
- Sample data is illustrative. Replace it with your own figures.
- The workbook is a planning tool, not financial or accounting advice. Verify local requirements for reporting and tax.
- Regression describes the range of your history. Results far outside that range, or after a change in how the hotel operates, need judgement.
- Single-user license. Do not redistribute.
FAQ
How many months of history do I need?
At least 12; 24 or more gives steadier results. The model accepts up to 36 months and flags any line with fewer months than your minimum.
What if a cost line has a weak fit?
The line is flagged when R² falls below your threshold. Look at it on Fit_Viewer, exclude one-off months, or switch the line to All fixed or All variable on Cost_Model.
Can I use my own cost lines and departments?
Yes. There are 20 line slots. Name each line, pick a department and choose occupied rooms, covers or rooms revenue as its driver.
Does it handle commissions that move with rate rather than rooms sold?
Yes. Lines driven by rooms revenue are treated as a share of revenue, so break-even ADR accounts for them.
Does it need macros or add-ins?
No. Every result is a standard worksheet formula, including the sensitivity grids.