


Project Analysis Dashboard
How to Use the Dashboard:
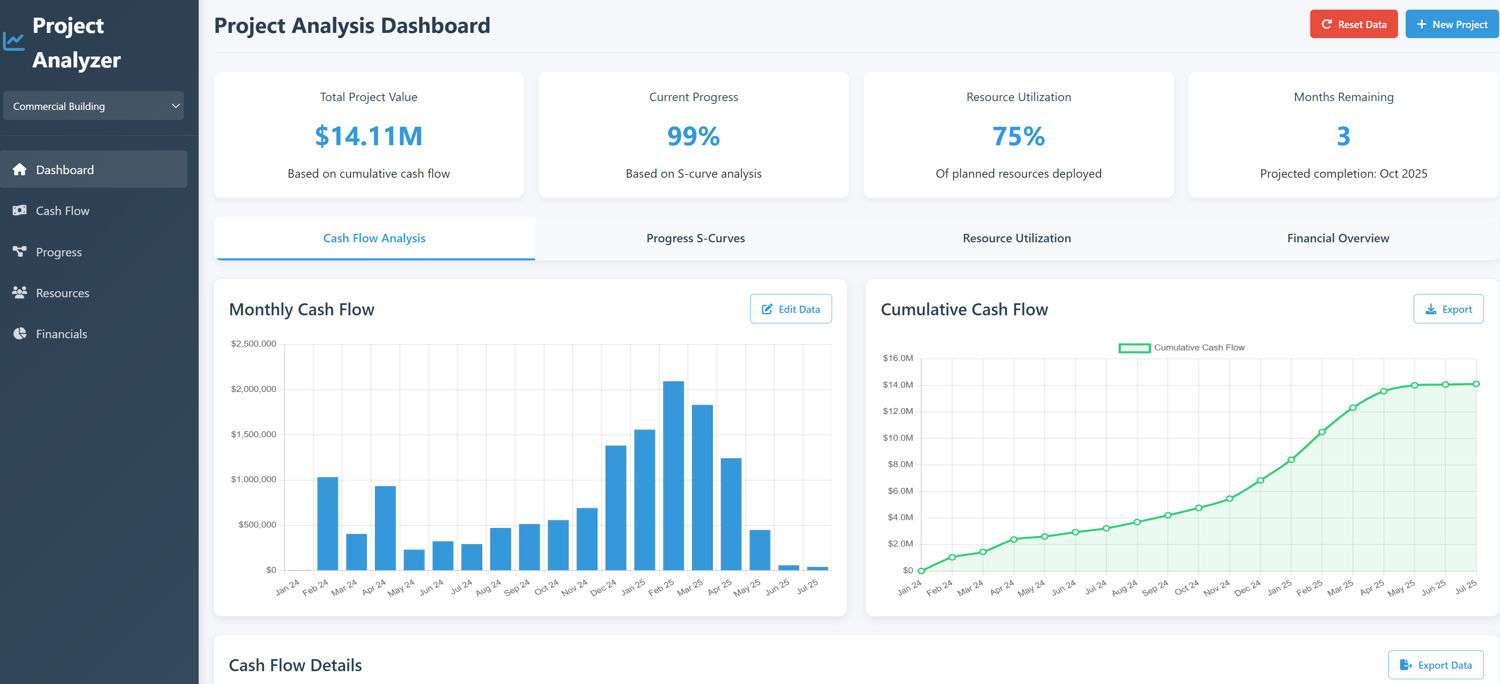
- View Data: The dashboard shows cash flow, progress S-curves, resource utilization, and financial overview
- Reset Data: Click the "Reset Data" button to set all values to zero
- Create New Project: Use "New Project" to start with a clean slate
- Edit Data: Click "Edit Data" buttons in each section to modify values
- Add Resources: In the resource modal, you can add new resources
- Switch Tabs: Navigate between different analysis sections using the top tabs
The dashboard is now fully functional and ready for any project analysis you need to perform. You can easily reset all values to zero and start fresh with a new project whenever needed.
Key Features of the Dashboard
1. Data Reset Capability:
o "Reset Data" button to zero out all values
o "New Project" button to create a fresh project with all zeros
2. Data Editing:
o Edit buttons for each section (Cash Flow, Progress, Resources)
o Intuitive forms for modifying project data
o Real-time preview of changes
3. Interactive Charts:
o Monthly and cumulative cash flow charts
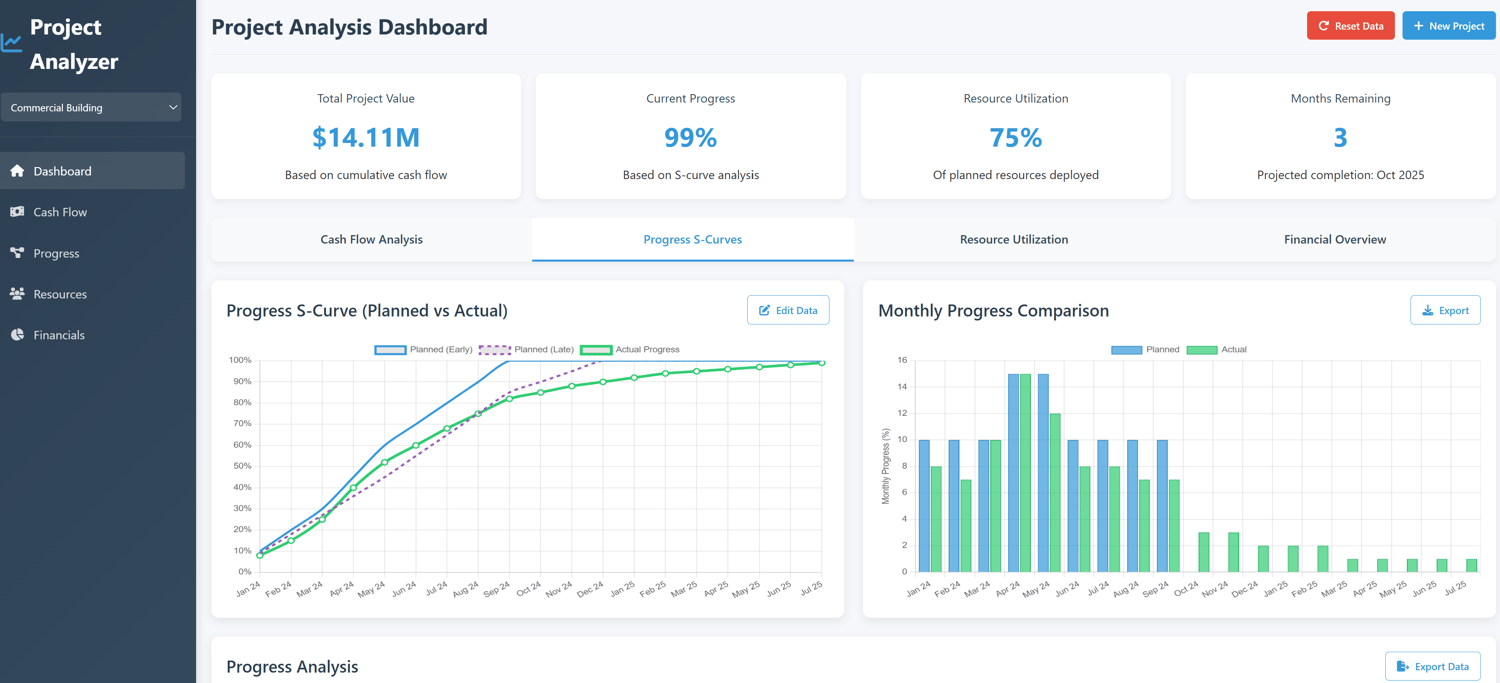
o Progress S-curves comparing planned vs actual
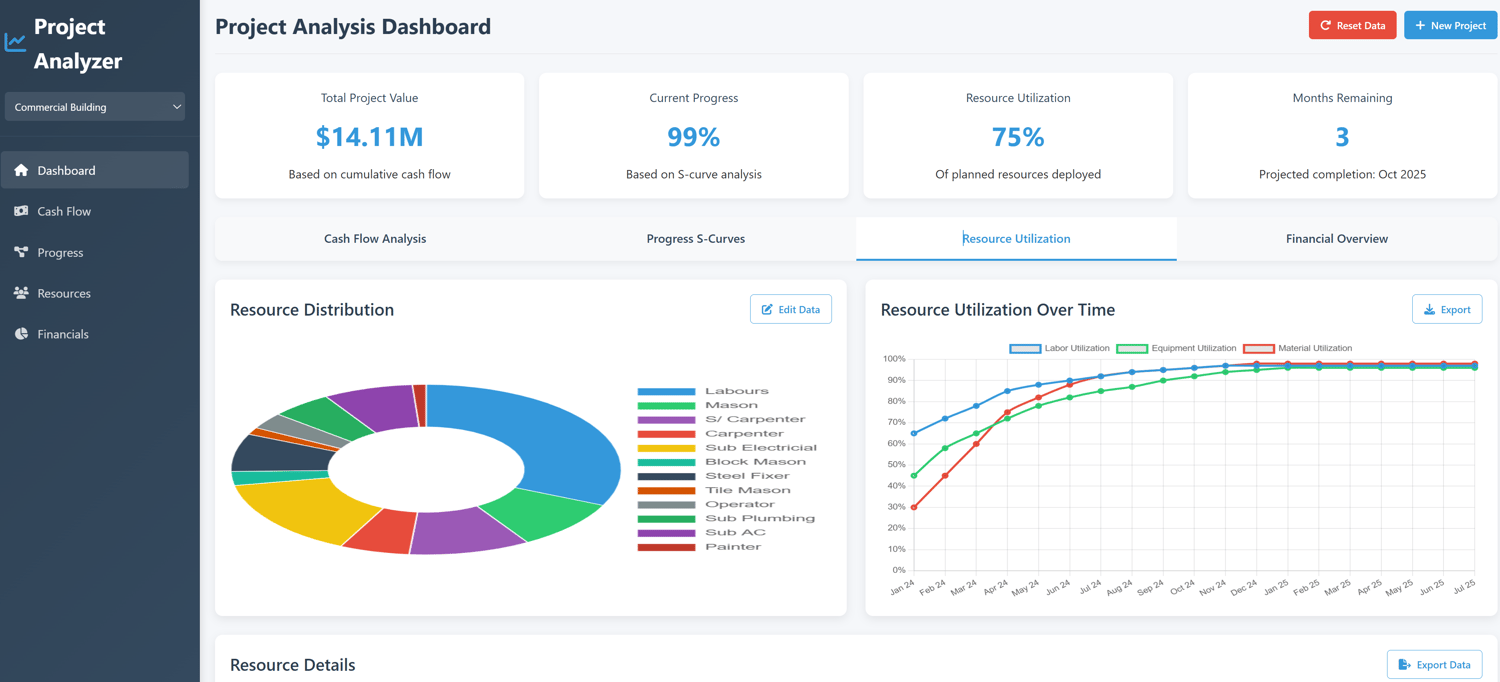
o Resource distribution and timeline charts
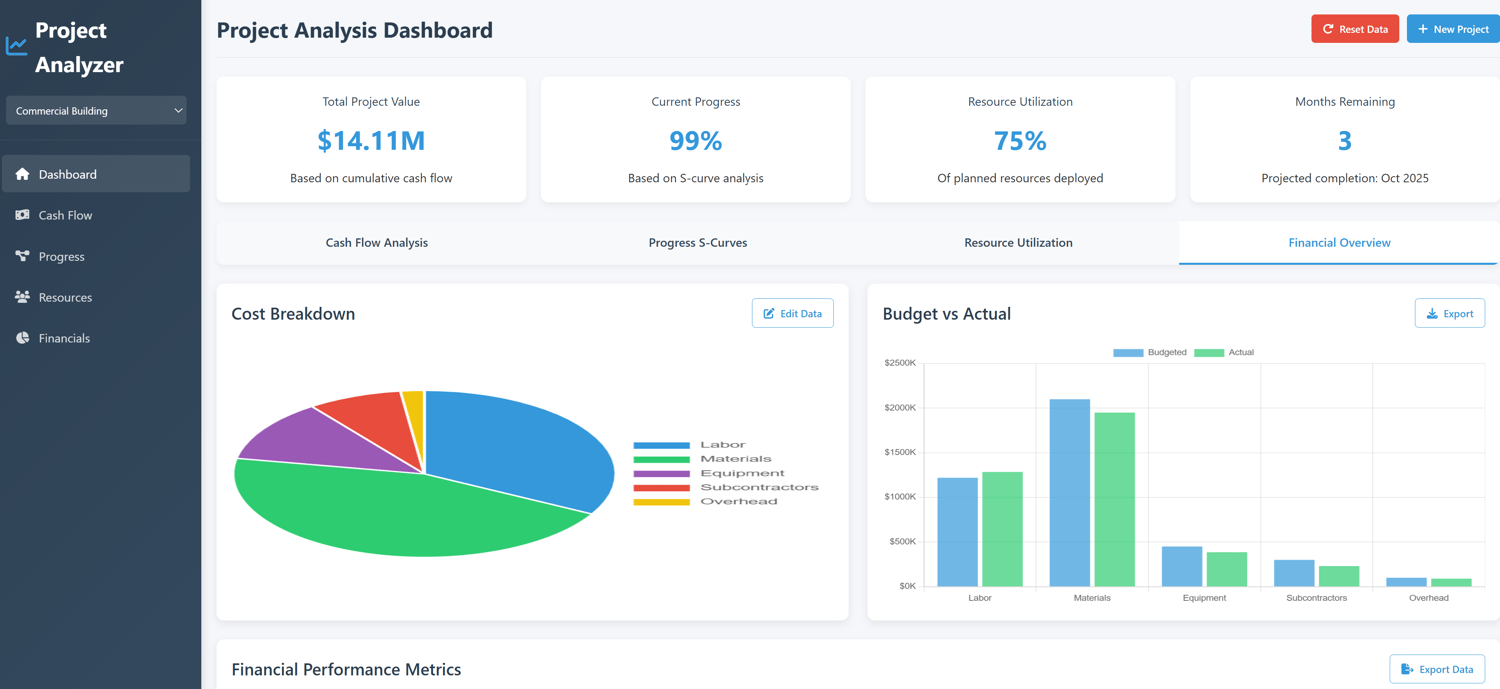
o Financial breakdown charts
4. Comprehensive Analysis:
o Detailed tables showing all project data
o Progress tracking with variance indicators
o Resource utilization metrics
5. Project Management:
o Project selector for switching between projects
o Save and load functionality (in-memory for this demo)
o Responsive design that works on all devices
6. User-Friendly Interface:
o Clean, modern dashboard layout
o Intuitive navigation with sidebar
o Clear visual indicators and progress bars
To use this application:
- Click "Edit Data" buttons to modify project information
- Use "Reset Data" to clear all values to zero
- Create a new project with "New Project" button
- Explore different tabs for various analyses
- Export data using the export buttons
The dashboard calculates all cumulative values automatically and updates charts in real-time as you make changes. You can use this for any project by simply updating the data fields.
How to Use the Dashboard - Quick Guide
Resetting Data to Zero
- Cash Flow: Click the red "Reset" button in the Cash Flow section
- Progress: Click the red "Reset" button in the Progress S-Curves section
- Resources: Click the red "Reset" button in the Resource Utilization section
- Financials: Click the red "Reset" button in the Financial Overview section
Navigating the Dashboard
- Use the tabs at the top to switch between analysis sections:
- Cash Flow Analysis: Monthly and cumulative cash flow charts
- Progress S-Curves: Planned vs actual progress visualization
- Resource Utilization: Resource distribution and timeline
- Financial Overview: Cost breakdown and budget comparisons
Key Features
- Interactive Charts: Hover over data points for detailed information
- Detailed Tables: View all data in table format with progress indicators
- Export Options: Use the export buttons to save data
- Quick Help: Click the blue question mark button in the bottom-right for a quick tutorial
This dashboard is ready to use for any project - just reset the sections you want to start with a clean slate, then input your own data through the browser's developer tools or by modifying the JavaScript directly.