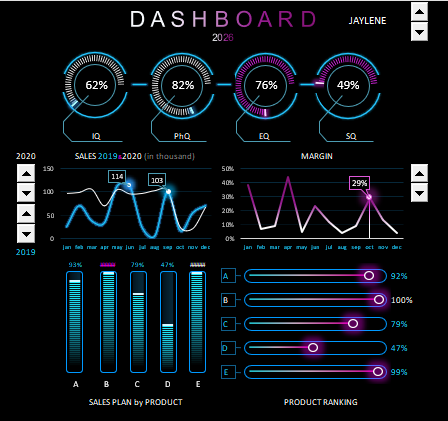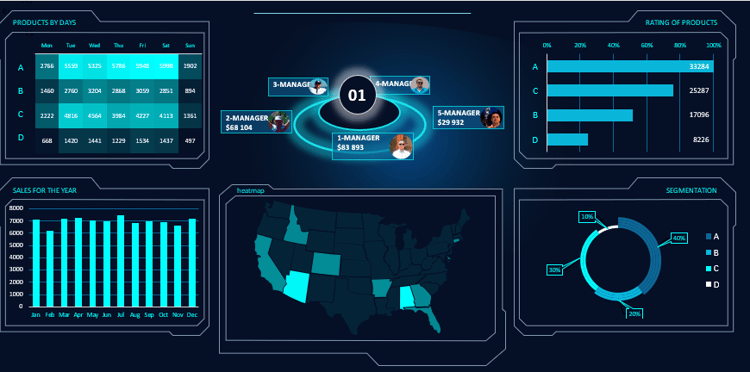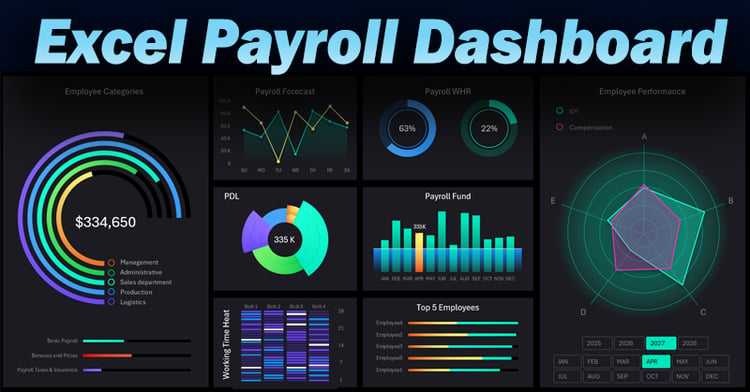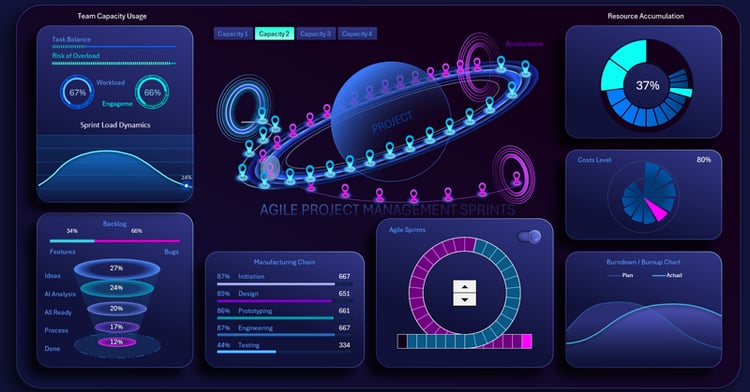


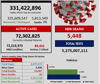
COVID-19 Interactive Dashboard | Real-Time Analytics & Visual Insights
On Sale
$30.00
$30.00
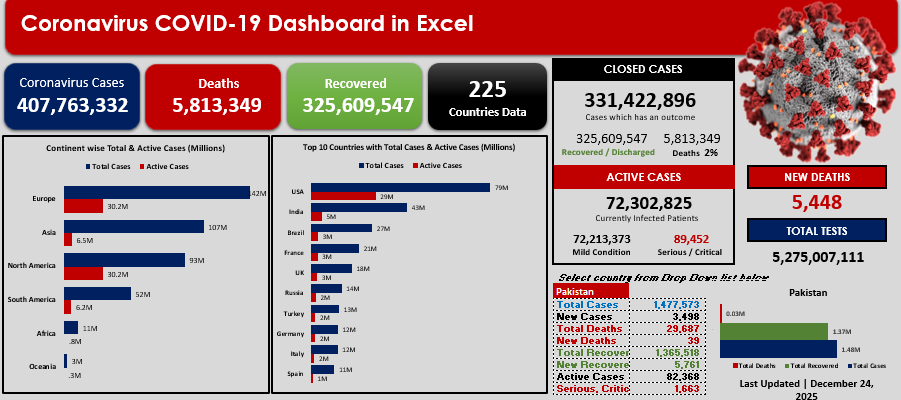
Stay on top of the COVID-19 situation with a fully interactive and professional Excel dashboard designed to transform raw data into clear, actionable insights.
This dashboard provides a comprehensive overview of coronavirus statistics, helping analysts, researchers, decision-makers, and students quickly understand trends and key indicators — all in one clean, visual layout.
🔍 Key Features:
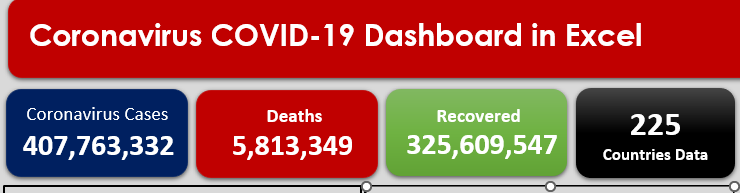
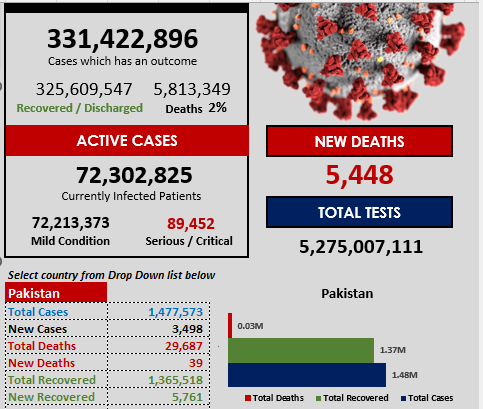
- 📊 Interactive KPIs for confirmed cases, recoveries, deaths, and active cases
- 🌍 Dynamic filters by country, region, and time period
- 📈 Trend analysis charts to track daily and cumulative changes
- 🗓️ Time-based insights (daily, monthly, yearly views)
- ⚡ Auto-updating structure – easy to customize with your own data
- 🎯 Clean, modern design suitable for reports & presentations
🎯 Who is this dashboard for?
- Data Analysts & BI Professionals
- Healthcare & Research Teams
- Students & Educators
- Business & Government Reporting
- Anyone who wants clear COVID-19 insights without complex tools
💡 Why choose this dashboard?
✔ No coding required
✔ Built with performance & clarity in mind
✔ Saves hours of manual analysis
✔ Ready-to-use & fully customizable