Vacation Rental Portfolio Performance Dashboard: Occupancy, ADR and RevPAR Tracker for 10 Units
Full description
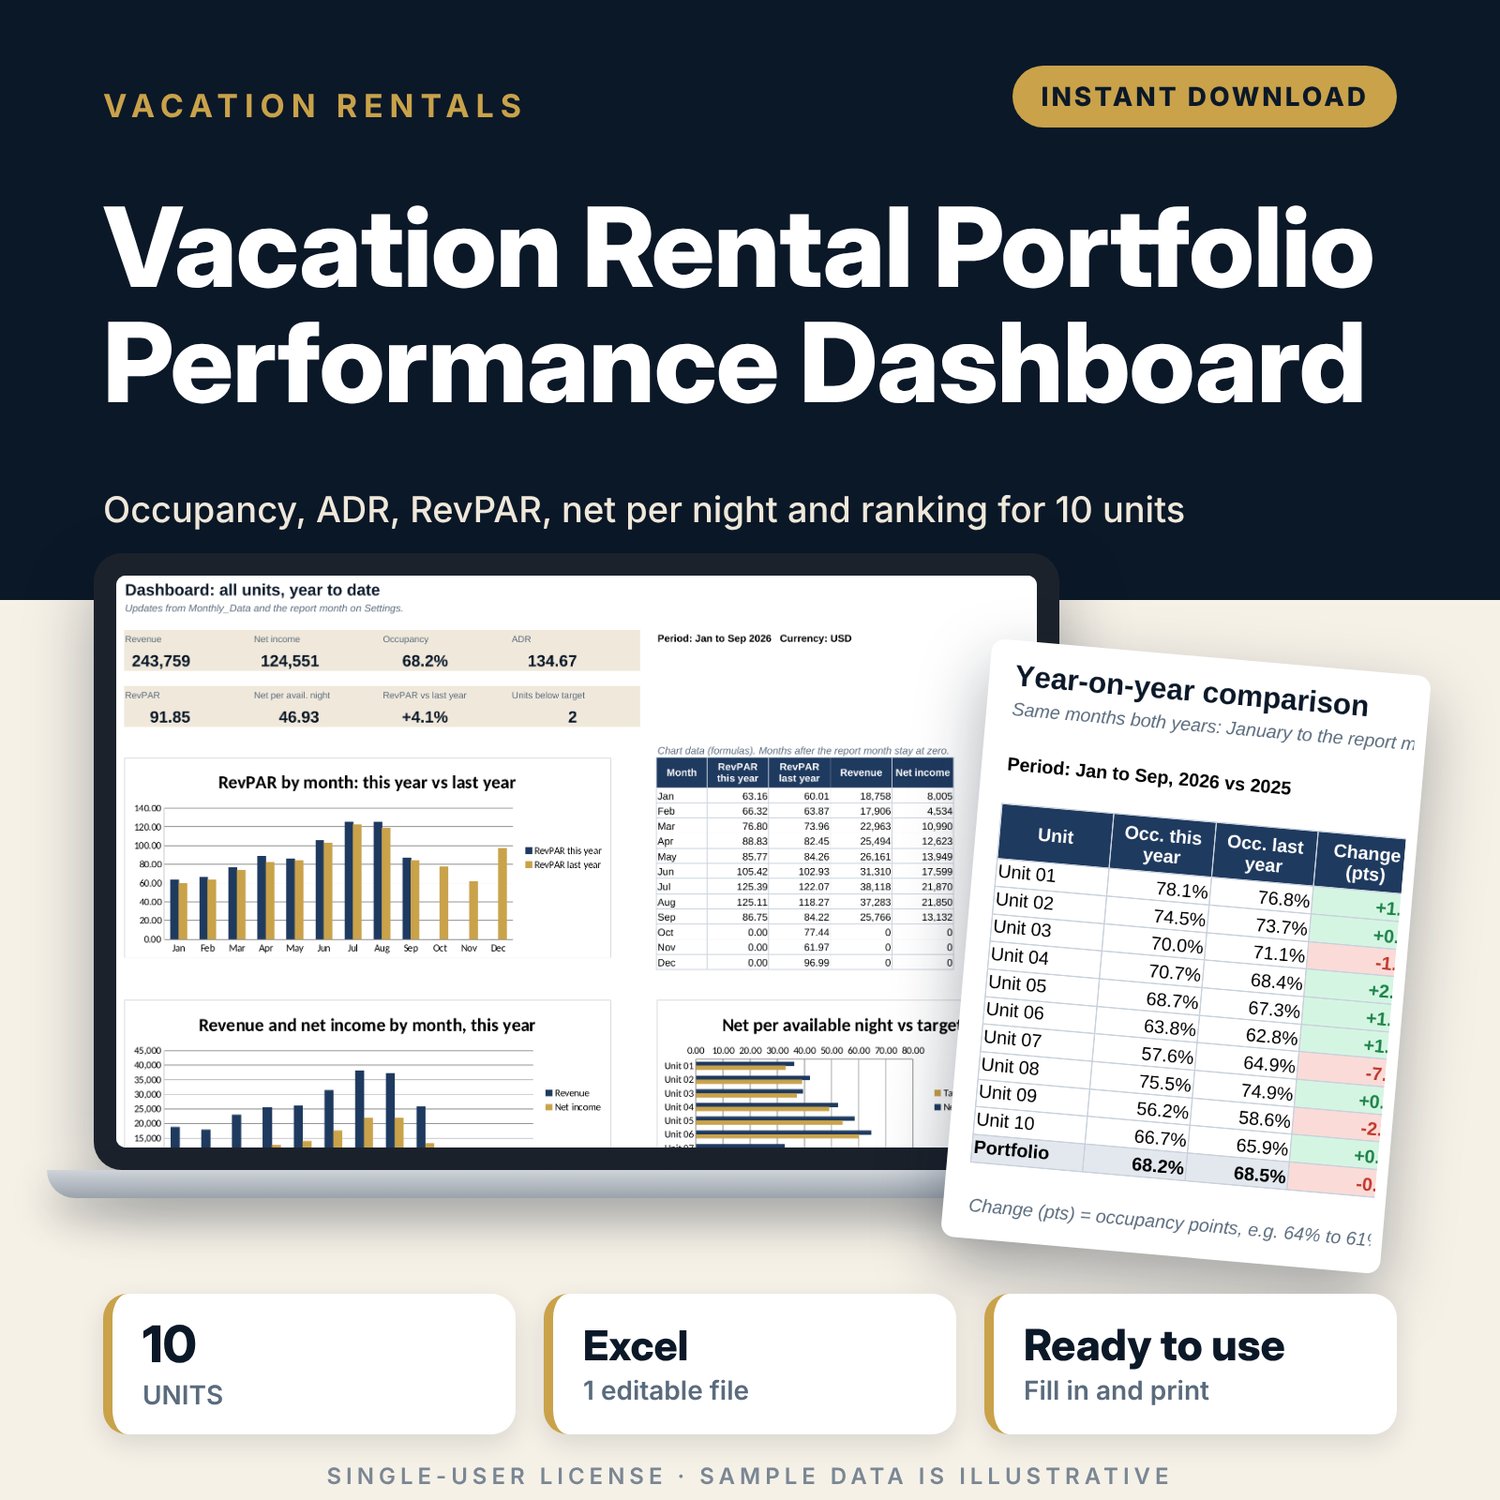
For property managers and hosts who run several vacation rental units and need one view of how each unit performs. You enter one row per unit per month: blocked nights, nights sold, revenue, channel fees and operating costs. The workbook calculates occupancy, ADR, RevPAR and net per available night, ranks the units, compares the year to date with the same months last year and flags any unit that misses its target.
Save with a bundle: this template is also in the Vacation Rental Business Bundle, 10 templates for $29 instead of $69. All 141 templates are in the All-Access Hospitality Template Library for $79.
What is inside
- Vacation_Rental_Portfolio_Dashboard.xlsx: 7 tabs, 4,702 formulas, 5 native charts, 9 drop-down or number rules.
- Settings: year, report month, currency label, portfolio targets, and 10 unit rows with type, sleeps, target occupancy, target ADR and target net per available night.
- Monthly_Data: room for 600 unit-month rows (210 sample rows: 12 months of last year and 9 months of this year for 10 units). Nights available, occupancy, ADR, RevPAR, net income, net per available night and a status flag calculate.
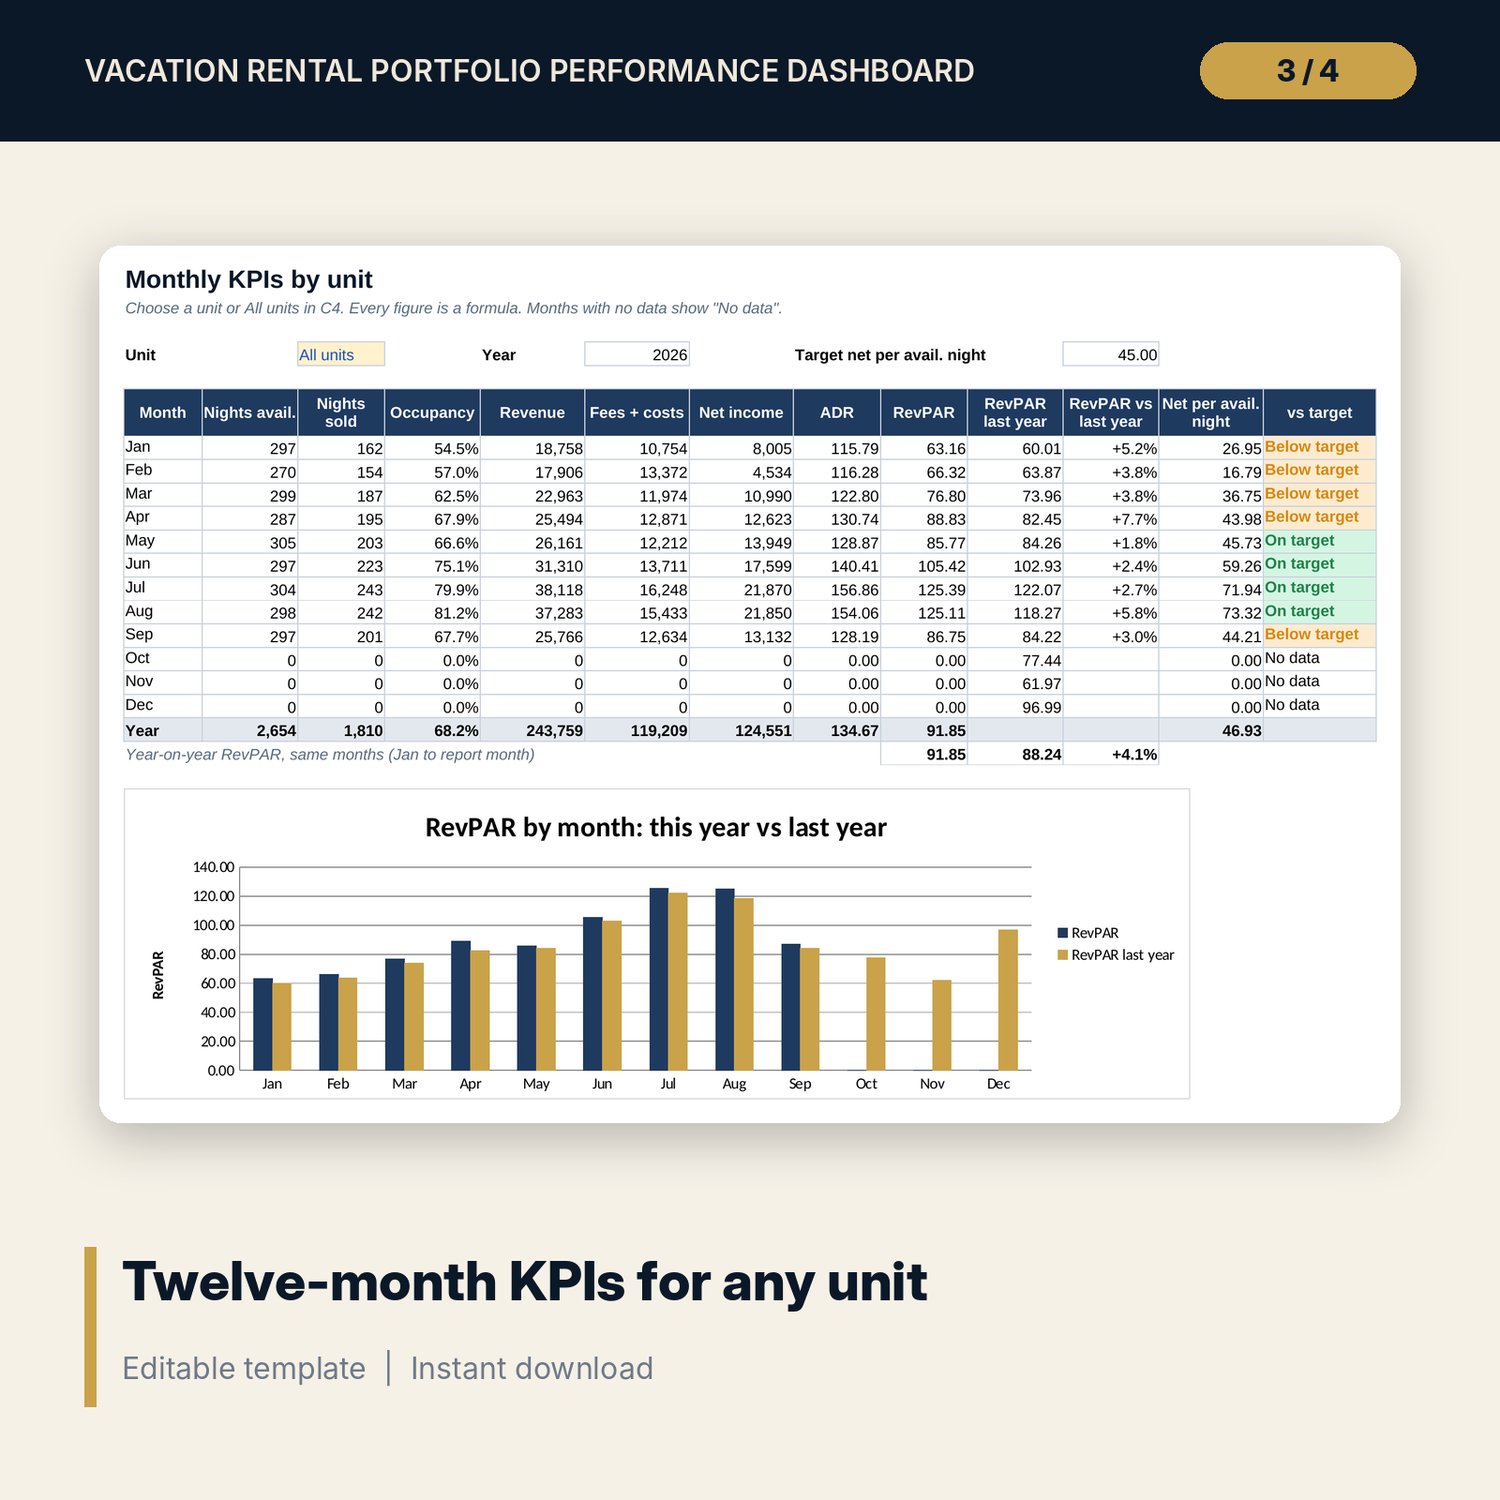
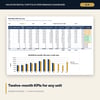
- Monthly_KPIs: pick one unit or All units. Twelve months of KPIs, last year's RevPAR beside this year's, a target flag and a chart.
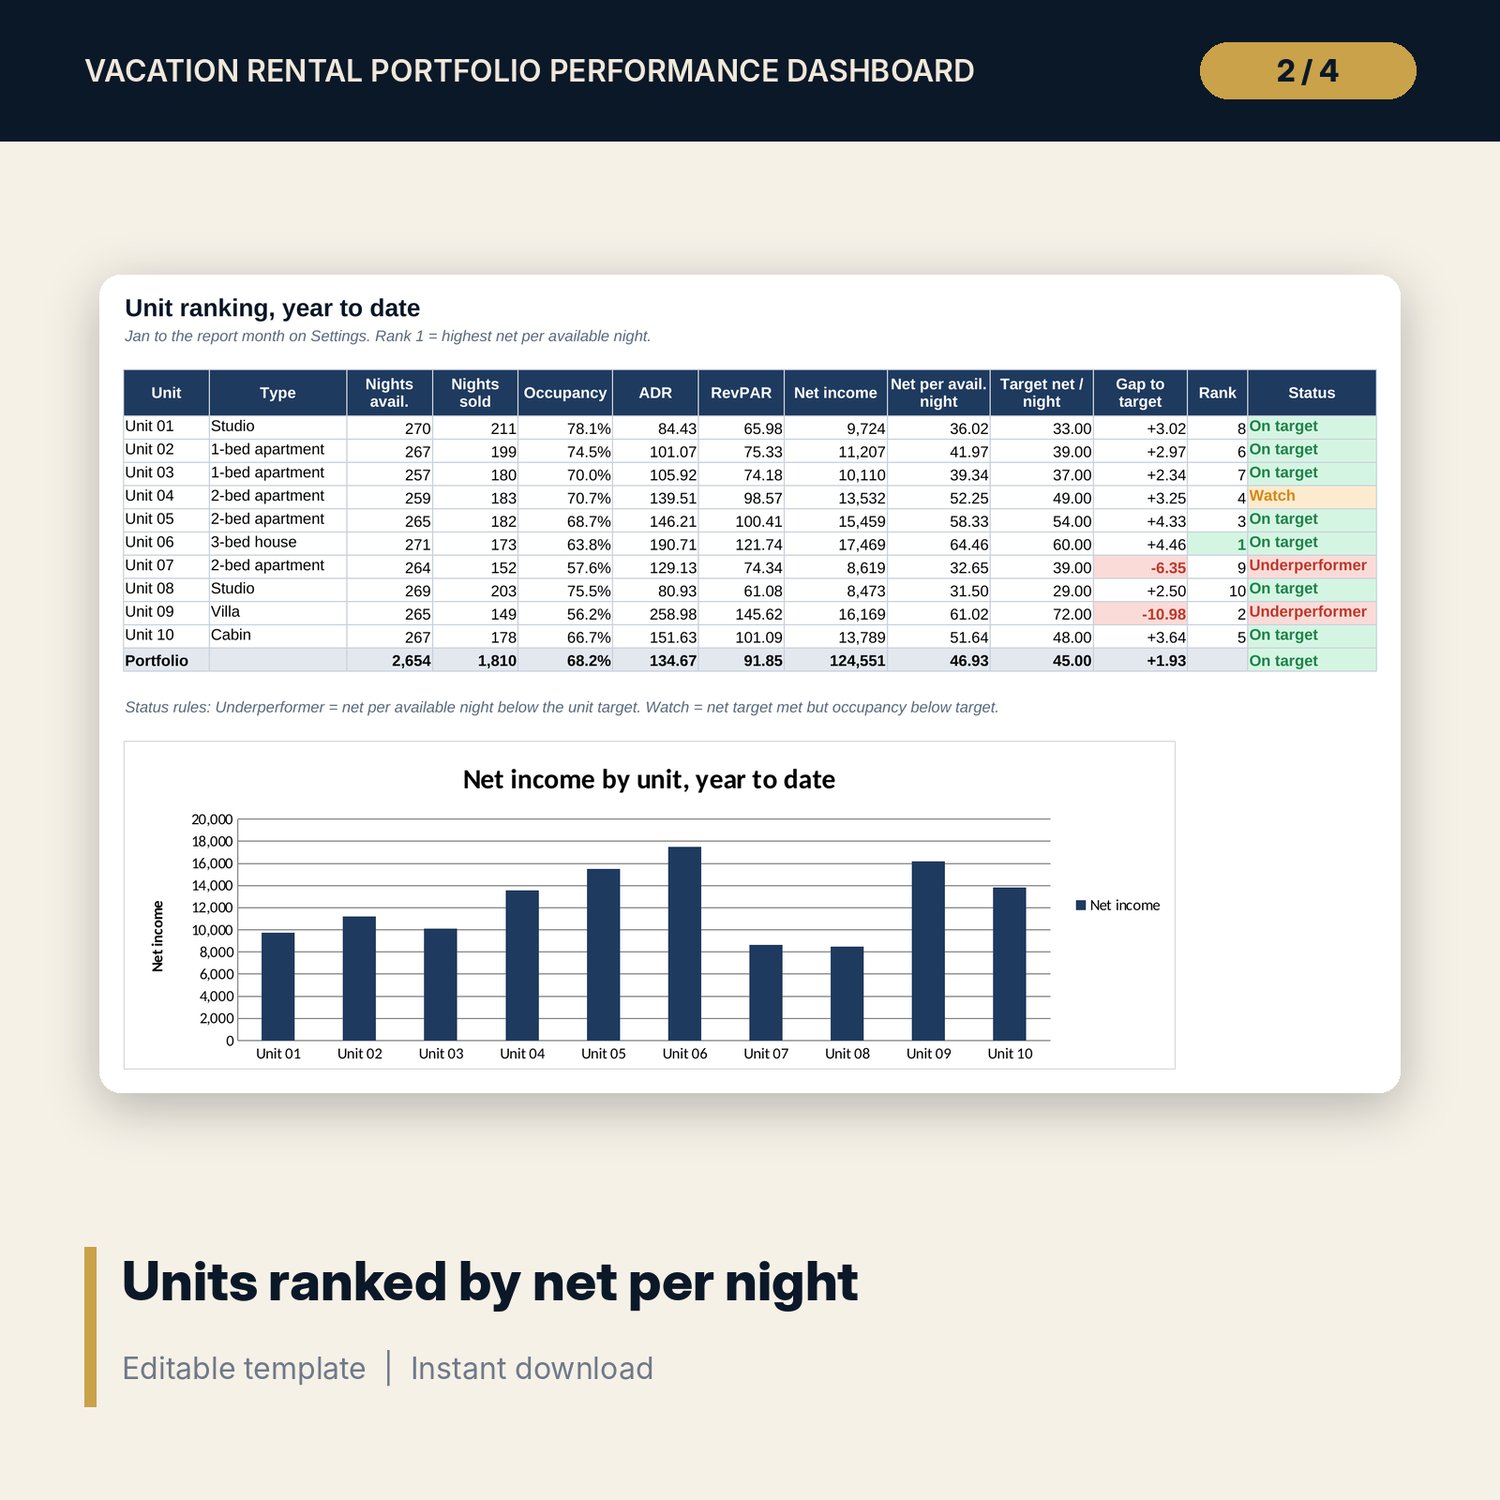
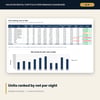
- Unit_Ranking: year-to-date results per unit, rank by net per available night, gap to target and an Underperformer, Watch or On target status, with a chart.
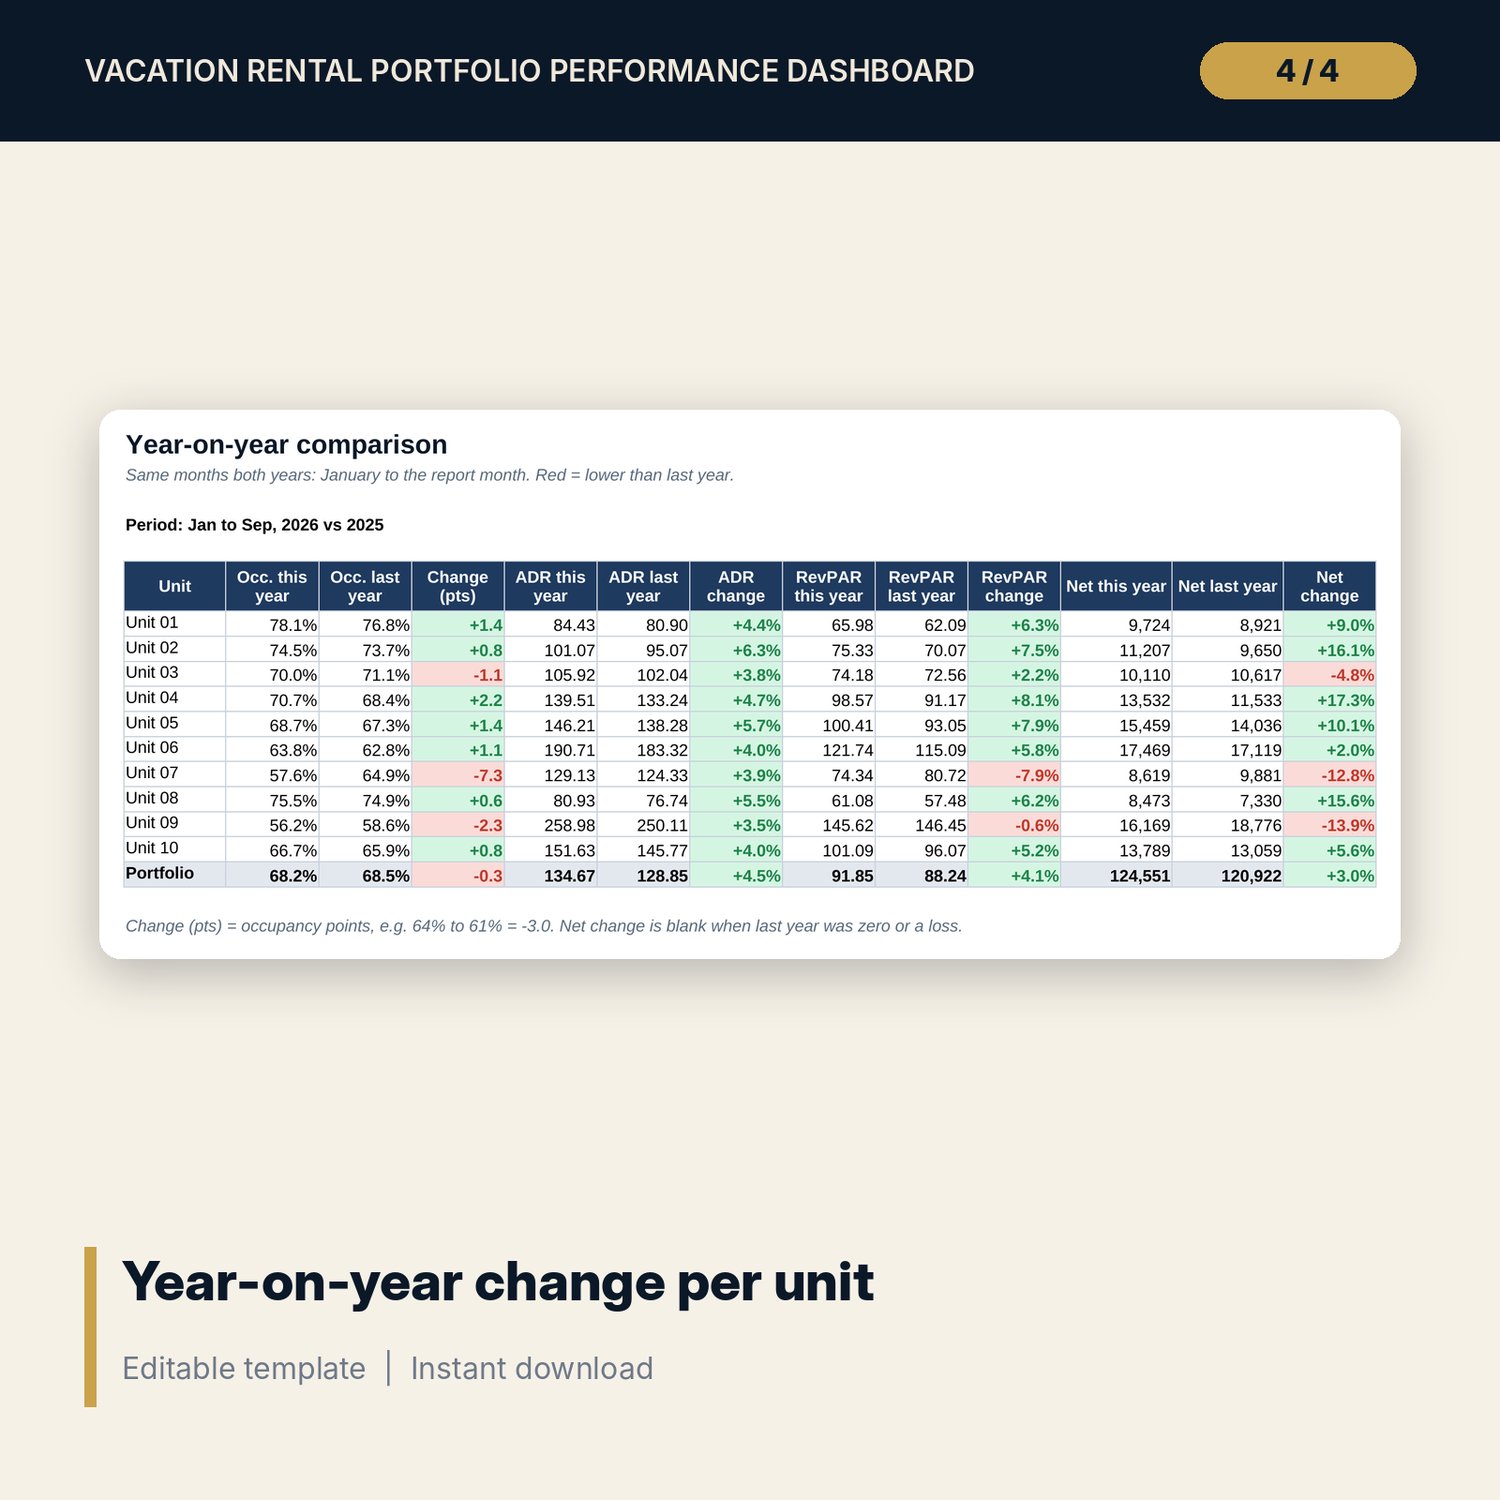
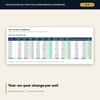
- YoY_Comparison: occupancy, ADR, RevPAR and net income for the same months this year and last year, per unit and for the portfolio.
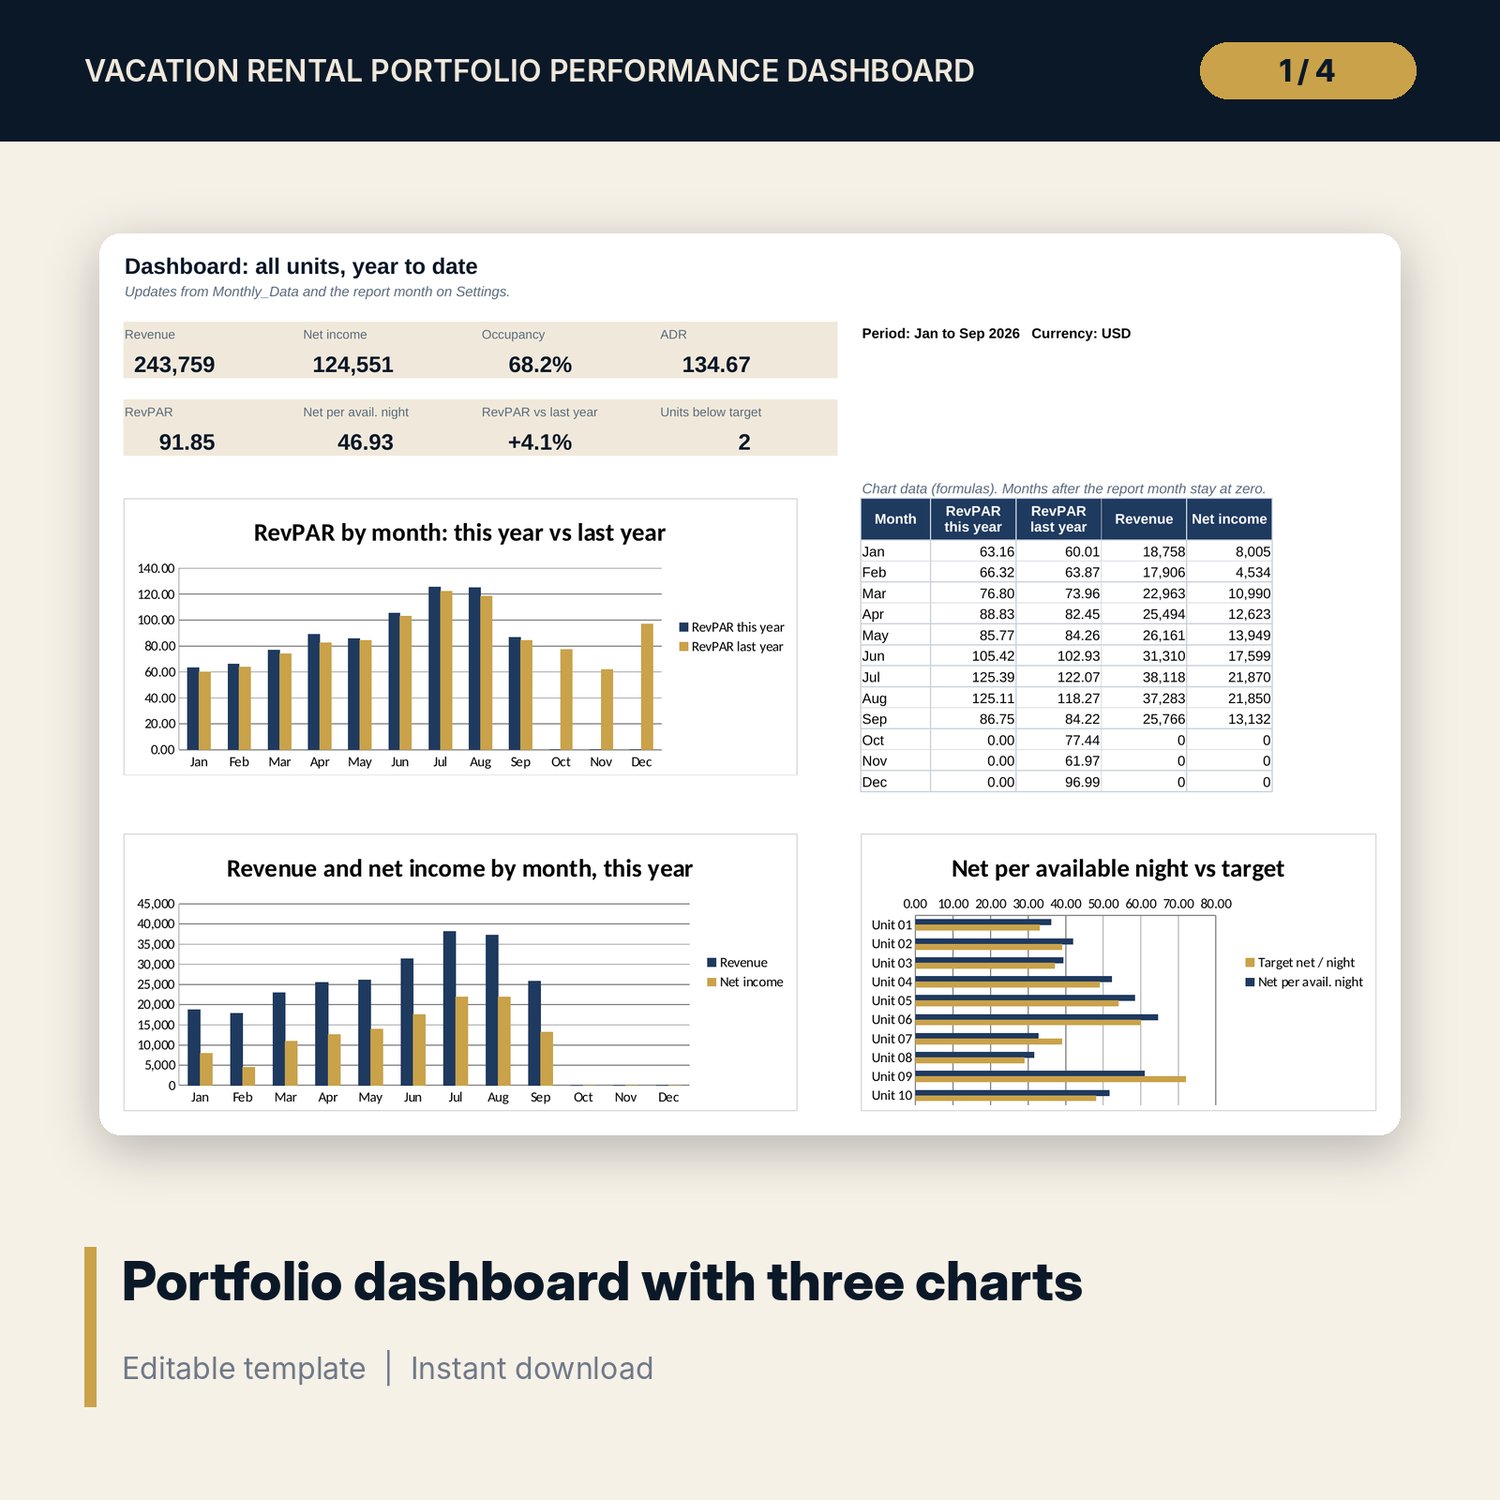
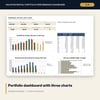
- Dashboard: 8 KPI tiles and 3 charts on one printable page.
- README.txt and LICENSE-and-Terms.txt.
How it works
- Enter the year, report month, currency label and your unit codes and targets on Settings.
- Clear the sample rows and enter one row per unit per month for this year and last year.
- Each month, add the new rows and move the report month forward by one.
- Read the Dashboard and Unit_Ranking, then use Monthly_KPIs and YoY_Comparison to find the cause of a gap.
Details
- Format: Excel workbook (.xlsx). No macros.
- Language: English. Currency is a label you choose.
- Software: Excel 2016 or later, or a spreadsheet program that opens .xlsx files.
- Delivery: instant digital download. Nothing is shipped.
Good to know
- All sample units, rates, costs and targets are illustrative. Replace them with your own data.
- Net income here is revenue minus channel fees and operating costs, before loan, rent and tax.
- The workbook is a reporting tool, not financial or tax advice.
- Single-user license. Do not share or resell the files.
FAQ
Do I need special software?
Excel 2016 or later works best. Other spreadsheet programs that open .xlsx files also work.
Does it work in Google Sheets?
It opens in Google Sheets and the formulas calculate. Check the drop-downs and charts after import.
I have fewer than 10 units. Is that a problem?
No. Leave the spare unit rows blank on Settings. Blank units drop out of the ranking and totals.
I have no data for last year. What happens?
This year's KPIs still work. The year-on-year columns stay blank until last year's rows are entered.
Is this a physical product?
No. It is a digital download. Refund terms follow the store policy at the time of purchase.