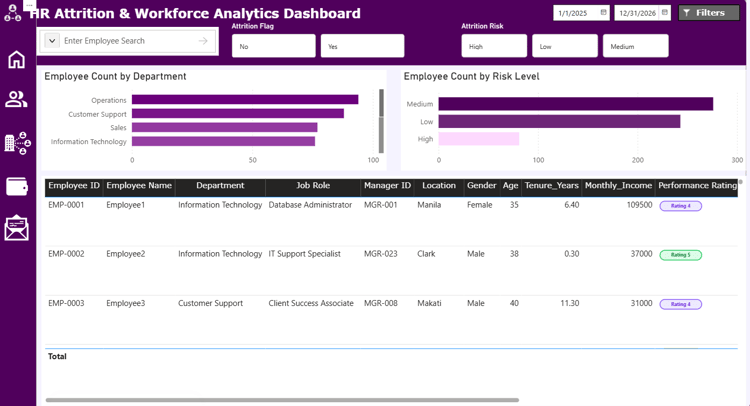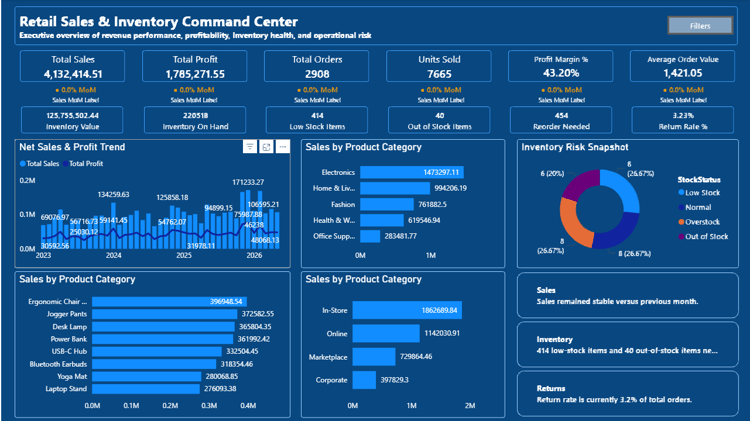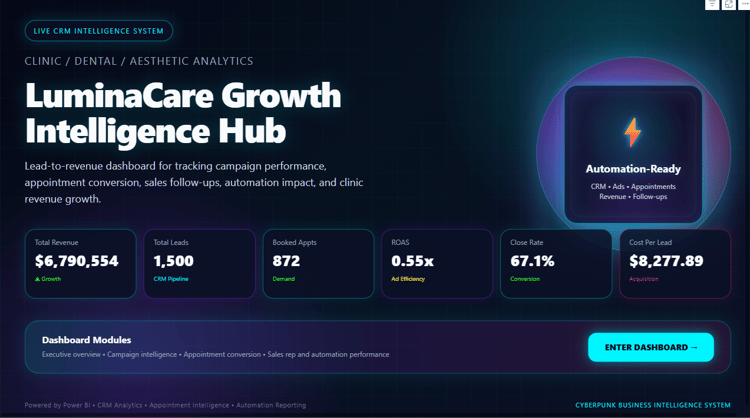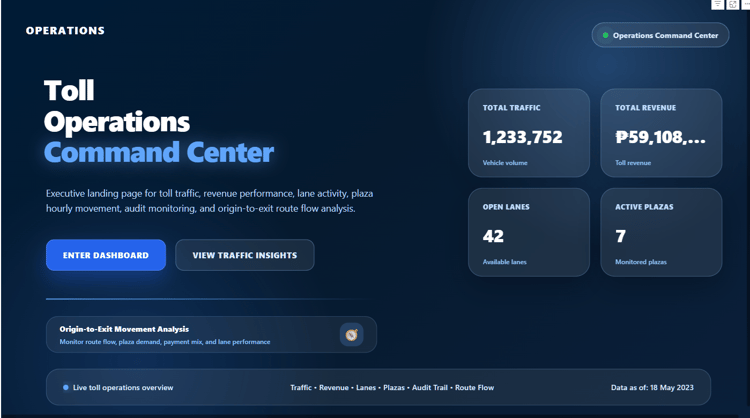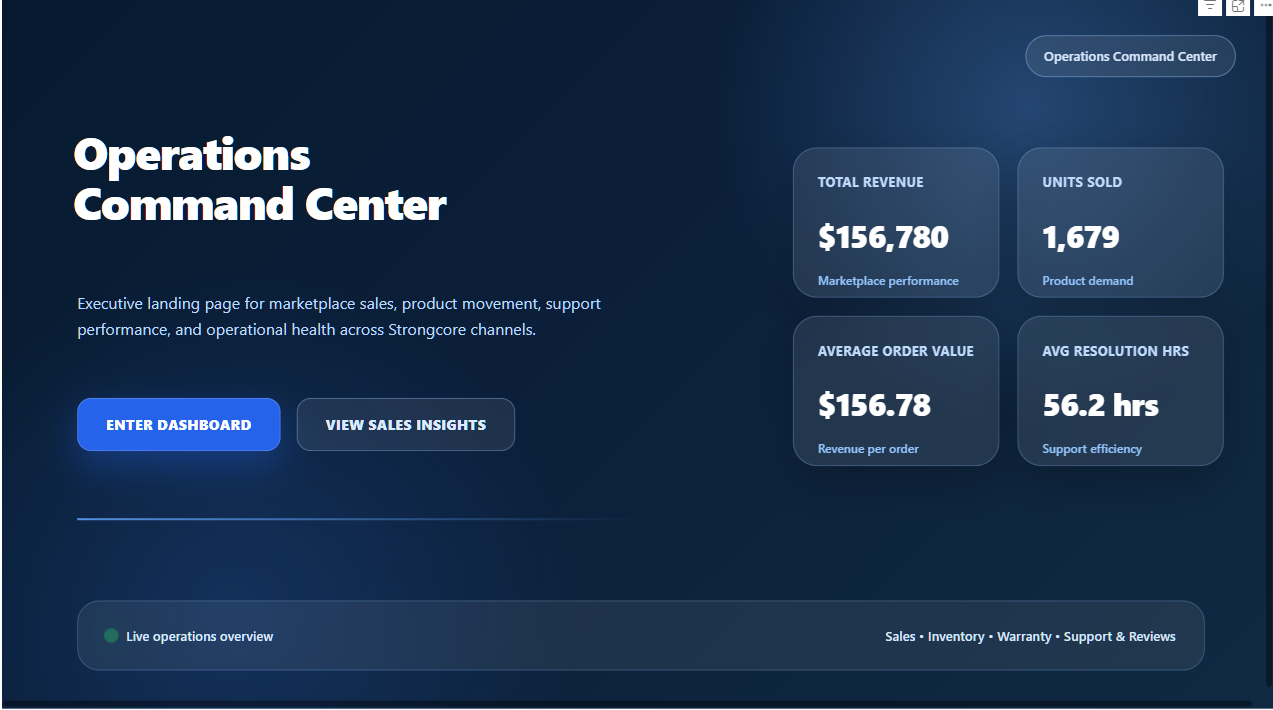
Operations Performance Command Center | Power BI Dashboard Template
Operations Performance Command Center
Turn operational data into clear, actionable business insights.
The Operations Performance Command Center is a professionally designed Power BI dashboard template created to help analysts, managers, and business teams monitor operational performance through one centralized and interactive report.
Use the dashboard to identify trends, compare performance, highlight areas requiring attention, and support faster data-driven decisions.
What You Can Analyze
- Total operational volume
- Completed and pending activities
- Overall completion rate
- Productivity and efficiency
- Performance against targets
- Workload by team, location, or category
- Monthly and daily operational trends
- Status and issue breakdowns
- Processing or resolution time
- High-performing and underperforming areas
- Operational exceptions and bottlenecks
- Key performance indicators across selected periods
Dashboard Features
- Interactive KPI cards
- Dynamic date filtering
- Team, location, category, and status slicers
- Operational trend analysis
- Target-versus-actual comparisons
- Status and workload breakdowns
- Performance-ranking visuals
- Drill-down reporting
- Professional page navigation
- Editable visuals, filters, colors, and measures
- Power Query data-preparation structure
- DAX measures for operational reporting
What You’ll Receive
- One editable Power BI .pbit dashboard file
- Sample operational data
- Interactive dashboard pages
- Editable Power Query steps and DAX measures
- Instant digital download after purchase
Who This Template Is For
- Operations managers
- Data and business analysts
- Business owners
- Performance-monitoring teams
- Power BI developers
- Freelancers and consultants
- Students building Power BI portfolios
- Professionals improving internal reporting
Suggested Data Fields
The template works best with data containing fields similar to:
- Date
- Department or team
- Location
- Activity or transaction type
- Status
- Assigned employee
- Target
- Actual result
- Completed quantity
- Pending quantity
- Processing time
- Issue category
- Priority level
Different datasets may require adjustments to Power Query steps, table names, relationships, column names, and DAX measures.
Software Requirement
Microsoft Power BI Desktop is required to open and edit the dashboard.
Basic familiarity with Power BI, Power Query, relationships, and DAX is recommended when connecting a different data source.
Important Notes
This is a digital product. No physical item will be shipped.
The dashboard uses fictional sample information for demonstration and educational purposes. It does not represent the performance of an actual organization.
Connecting your own dataset may require modifications to the data model, queries, relationships, measures, data types, and file paths.
Custom data integration and dashboard modifications are not included with the standard purchase.
License
The purchase includes a single-user license for personal, educational, portfolio, internal business, or customized client-project use.
The original files may not be resold, redistributed, publicly shared, uploaded to another marketplace, or claimed as the buyer’s original creation.
Custom Dashboard Services
Need a dashboard designed around your own workflow, operational KPIs, or dataset?
Contact Insight Flow Studio for custom Power BI dashboard development, report improvement, data visualization, and workflow automation.