Your Cart
Loading

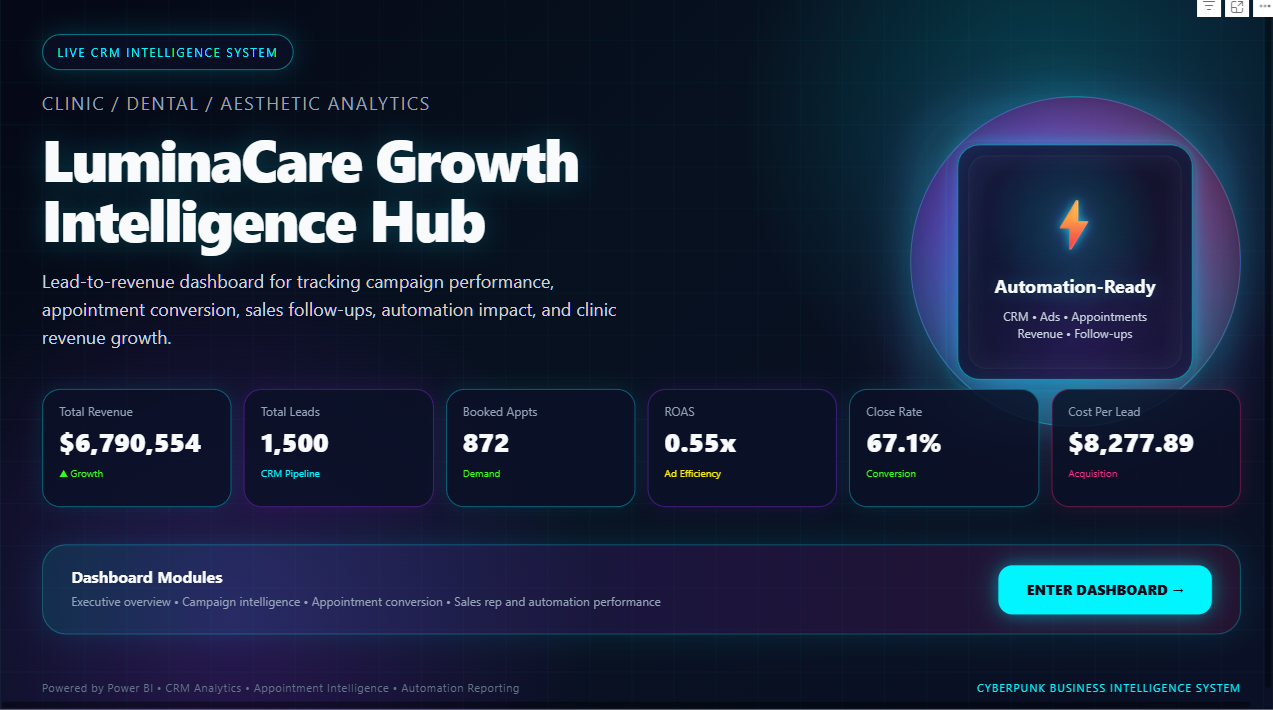
Lead-to-Revenue Command Center

On Sale
PHP1500.00
PHP1,500.00
Added to cart

Power BI Sales Funnel, Lead Conversion & Revenue Dashboard Template


Turn raw sales and lead data into a clear, decision-ready Power BI dashboard.


The Lead-to-Revenue Command Center is designed for sales teams, business owners, analysts, and consultants who need to monitor the complete customer journey—from initial lead generation to conversion and revenue.


Instead of reviewing disconnected spreadsheets and reports, this dashboard brings important sales and pipeline metrics together in one interactive view.'


What You Can Analyze


  • Total leads and qualified opportunities
  • Lead-to-customer conversion performance
  • Sales pipeline movement
  • Revenue generated
  • Lead sources and channel performance
  • Conversion rates across different stages
  • Monthly sales and revenue trends
  • High-performing products, teams, or segments
  • Areas where potential customers drop out of the funnel


What You’ll Receive


  • One ready-to-use Power BI .pbit template file
  • Professionally designed dashboard pages
  • Interactive filters and slicers
  • KPI cards and sales-performance visuals
  • Sample data for exploring the report
  • Editable Power BI visuals, measures, and formatting


Who This Template Is For


  • Power BI beginners looking for a professional dashboard example
  • Data analysts building their portfolio
  • Sales and marketing teams
  • Freelancers and dashboard designers
  • Business owners tracking leads and revenue
  • Consultants creating sales-performance reports


Software Requirement


You will need Microsoft Power BI Desktop to open and edit the .pbit file.

Power BI Desktop can be downloaded separately from Microsoft.


Important Notes


This is a digital product. No physical item will be shipped.

The dashboard currently contains sample data for demonstration and learning purposes. You can replace the sample data with your own dataset, but some Power Query, data model, or DAX adjustments may be required depending on your column names and data structure.

Basic knowledge of Power BI is recommended.


License


Your purchase includes a single-user license for personal, educational, portfolio, or internal business use.

You may customize the dashboard for your own projects or organization.

You may not resell, redistribute, share, or upload the original .pbit file as your own product.


Support


For questions about accessing the file or understanding the dashboard structure, contact Insight Flow Studio through the store contact page.

Custom dashboard development and data-model adjustments are not included with this product but may be requested separately.
You will get a PBIT (319KB) file
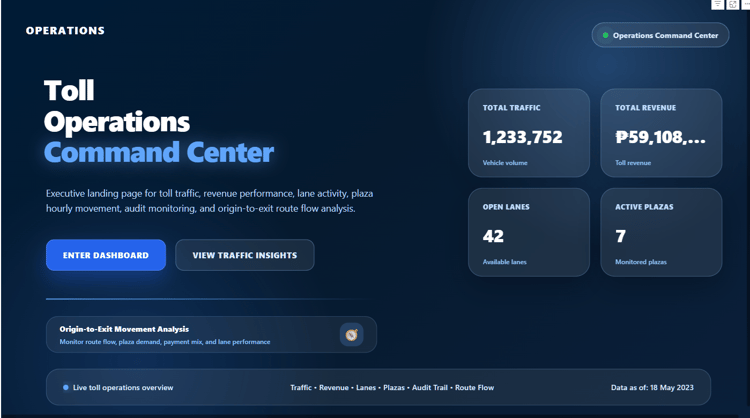
Toll Operations Command Center | Power BI Dashboard Template
On Sale
PHP2000.00
PHP2,000.00
Added to cart

Toll Operations Command Center


Transform toll transaction data into a clear, interactive operations dashboard.


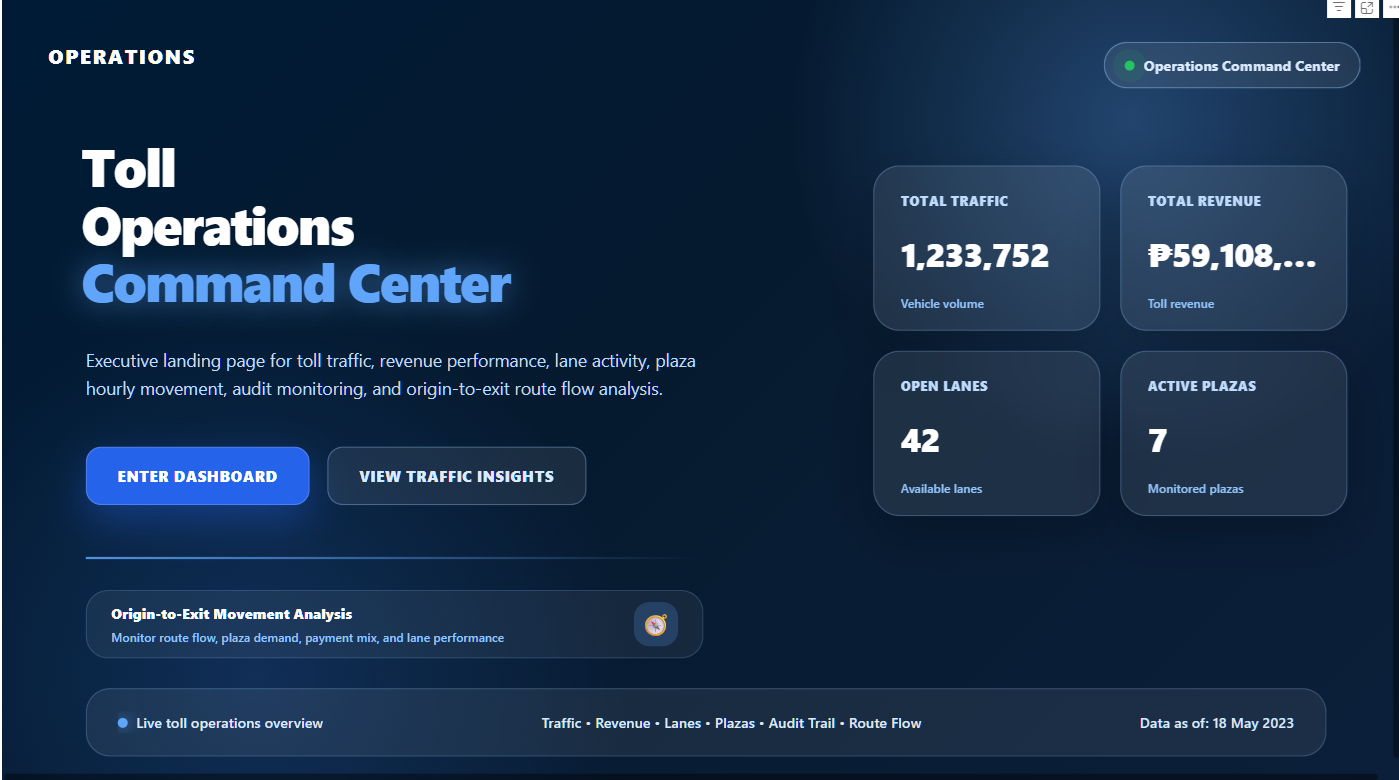
The Toll Operations Command Center is a professionally designed Power BI template built for monitoring traffic movement, toll revenue, plaza performance, lane activity, vehicle classifications, payment behavior, and operational trends.


Instead of reviewing multiple spreadsheets and disconnected reports, this dashboard brings essential tollway performance indicators into one centralized reporting experience.


What You Can Analyze


  • Total traffic volume
  • Total collected fare and revenue
  • Average toll fare
  • Average daily traffic
  • ETC and electronic-payment penetration
  • Traffic and revenue by plaza
  • Lane-level operating performance
  • Entry and exit activity
  • Traffic by vehicle class
  • Payment-method distribution
  • Operational mode performance
  • Traffic by direction or bound
  • Daily, monthly, and time-based traffic patterns
  • High-performing and underperforming plazas
  • Revenue and traffic comparisons across selected periods


Dashboard Features


  • Interactive KPI cards
  • Dynamic date filtering
  • Plaza and lane slicers
  • Vehicle-class analysis
  • Payment-type analysis
  • Revenue and traffic trends
  • Entry and exit comparisons
  • Operational-mode monitoring
  • Professionally designed navigation
  • Editable visuals, colors, filters, and measures
  • Power Query data-preparation structure
  • DAX measures for operational reporting


What You’ll Receive


  • One editable Power BI .pbit report with sample data
  • One reusable Power BI .pbit template
  • One sample Excel toll-operations dataset
  • One quick-start setup guide
  • Instant digital download after purchase


Power BI template files contain the report pages, visuals, model definitions, relationships, measures, and queries, but the .pbit version does not store the underlying dataset. Buyers connect the template to their own data after opening it in Power BI Desktop.


Who This Template Is For


  • Toll-road and expressway operations teams
  • Transportation and infrastructure analysts
  • Power BI developers
  • Data analysts
  • Operations managers
  • Business-intelligence consultants
  • Students and professionals building Power BI portfolios
  • Freelancers developing transportation dashboards


Suggested Data Fields


For best results, the buyer’s data should contain fields similar to:


  • Transaction or operational date
  • Plaza name
  • Entry and exit location
  • Lane number
  • Direction or bound
  • Vehicle class
  • Payment type
  • Operational mode
  • Traffic count
  • Toll fare
  • Revenue or collection amount


Column names and data structures may be different, but Power Query or model adjustments may be required.


Software Requirement


Microsoft Power BI Desktop is required to open and edit the included Power BI files.

Basic knowledge of Power BI, Power Query, data relationships, and DAX is recommended when connecting a different dataset.


Important Notes


This is a digital product. No physical item will be shipped.

The included report uses fictional sample data for demonstration and educational purposes. Results shown in the dashboard do not represent an actual toll-road operator.

Connecting a different dataset may require modifications to:


  • Power Query steps
  • Table and column names
  • Relationships
  • Measures
  • Data types
  • File paths

Custom data integration and dashboard modification are not included in the standard product purchase.


License

Your purchase includes a single-user license for:


  • Personal use
  • Educational use
  • Portfolio use
  • Internal business reporting
  • Customized client projects


You may customize the dashboard for your own organization or client.


You may not:


  • Resell the original files
  • Redistribute or publicly share the files
  • Upload the product to another marketplace
  • Claim the original template as your own creation
  • Include the unchanged template in another commercial bundle


Custom Dashboard Services


Need a toll-operations dashboard designed around your own KPIs, report structure, or dataset?

Contact Insight Flow Studio for custom Power BI dashboard development, data modeling, report improvement, and automation services.

You will get a PBIT (533KB) file
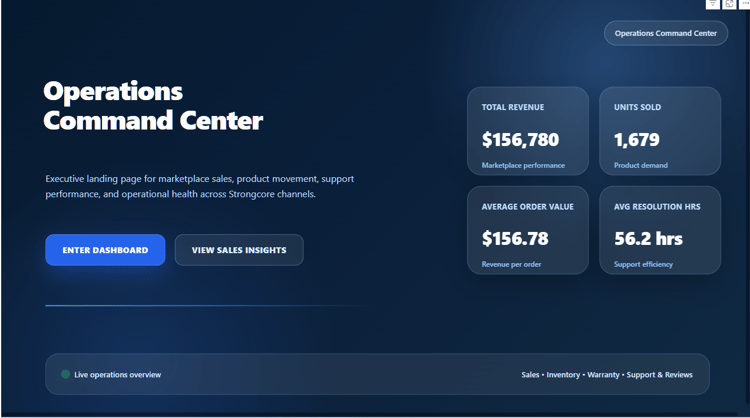
Operations Performance Command Center | Power BI Dashboard Template
On Sale
PHP1800.00
PHP1,800.00
Added to cart

Operations Performance Command Center


Turn operational data into clear, actionable business insights.


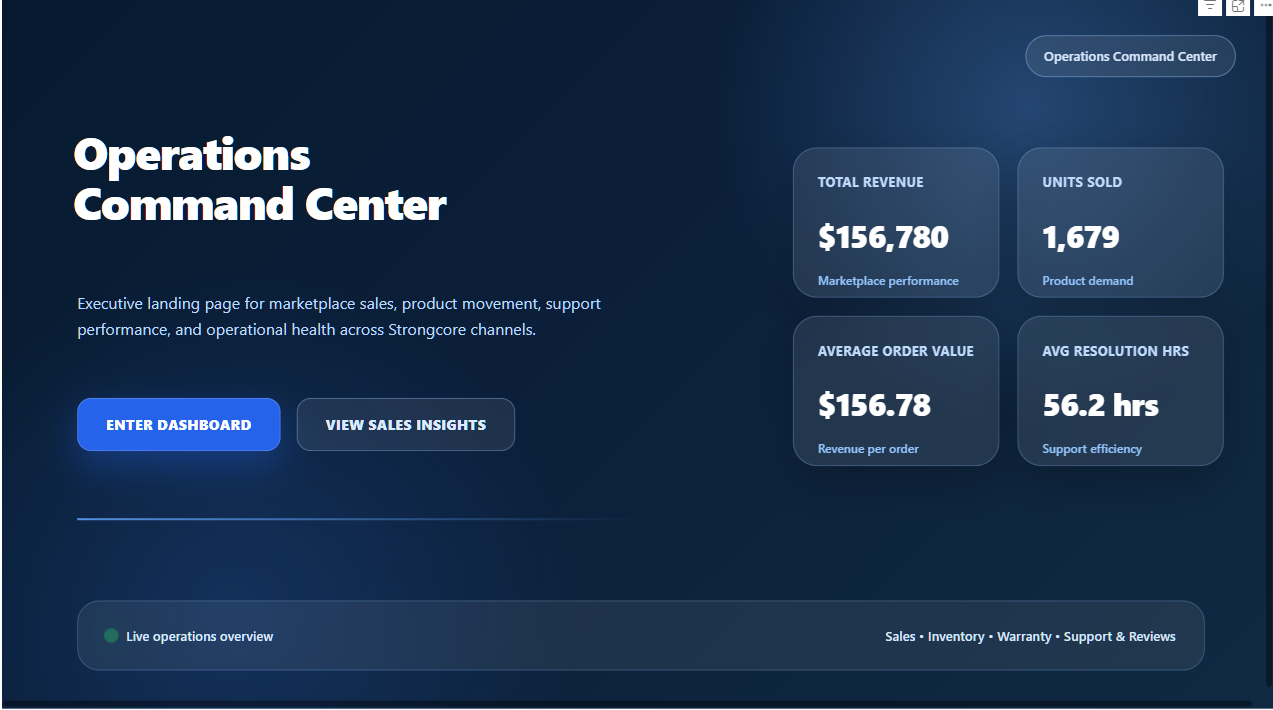
The Operations Performance Command Center is a professionally designed Power BI dashboard template created to help analysts, managers, and business teams monitor operational performance through one centralized and interactive report.


Use the dashboard to identify trends, compare performance, highlight areas requiring attention, and support faster data-driven decisions.


What You Can Analyze


  • Total operational volume
  • Completed and pending activities
  • Overall completion rate
  • Productivity and efficiency
  • Performance against targets
  • Workload by team, location, or category
  • Monthly and daily operational trends
  • Status and issue breakdowns
  • Processing or resolution time
  • High-performing and underperforming areas
  • Operational exceptions and bottlenecks
  • Key performance indicators across selected periods


Dashboard Features


  • Interactive KPI cards
  • Dynamic date filtering
  • Team, location, category, and status slicers
  • Operational trend analysis
  • Target-versus-actual comparisons
  • Status and workload breakdowns
  • Performance-ranking visuals
  • Drill-down reporting
  • Professional page navigation
  • Editable visuals, filters, colors, and measures
  • Power Query data-preparation structure
  • DAX measures for operational reporting


What You’ll Receive


  • One editable Power BI .pbit dashboard file
  • Sample operational data
  • Interactive dashboard pages
  • Editable Power Query steps and DAX measures
  • Instant digital download after purchase


Who This Template Is For


  • Operations managers
  • Data and business analysts
  • Business owners
  • Performance-monitoring teams
  • Power BI developers
  • Freelancers and consultants
  • Students building Power BI portfolios
  • Professionals improving internal reporting


Suggested Data Fields


The template works best with data containing fields similar to:


  • Date
  • Department or team
  • Location
  • Activity or transaction type
  • Status
  • Assigned employee
  • Target
  • Actual result
  • Completed quantity
  • Pending quantity
  • Processing time
  • Issue category
  • Priority level


Different datasets may require adjustments to Power Query steps, table names, relationships, column names, and DAX measures.


Software Requirement


Microsoft Power BI Desktop is required to open and edit the dashboard.

Basic familiarity with Power BI, Power Query, relationships, and DAX is recommended when connecting a different data source.


Important Notes


This is a digital product. No physical item will be shipped.

The dashboard uses fictional sample information for demonstration and educational purposes. It does not represent the performance of an actual organization.

Connecting your own dataset may require modifications to the data model, queries, relationships, measures, data types, and file paths.

Custom data integration and dashboard modifications are not included with the standard purchase.


License


The purchase includes a single-user license for personal, educational, portfolio, internal business, or customized client-project use.

The original files may not be resold, redistributed, publicly shared, uploaded to another marketplace, or claimed as the buyer’s original creation.


Custom Dashboard Services


Need a dashboard designed around your own workflow, operational KPIs, or dataset?

Contact Insight Flow Studio for custom Power BI dashboard development, report improvement, data visualization, and workflow automation.

You will get a PBIT (596KB) file
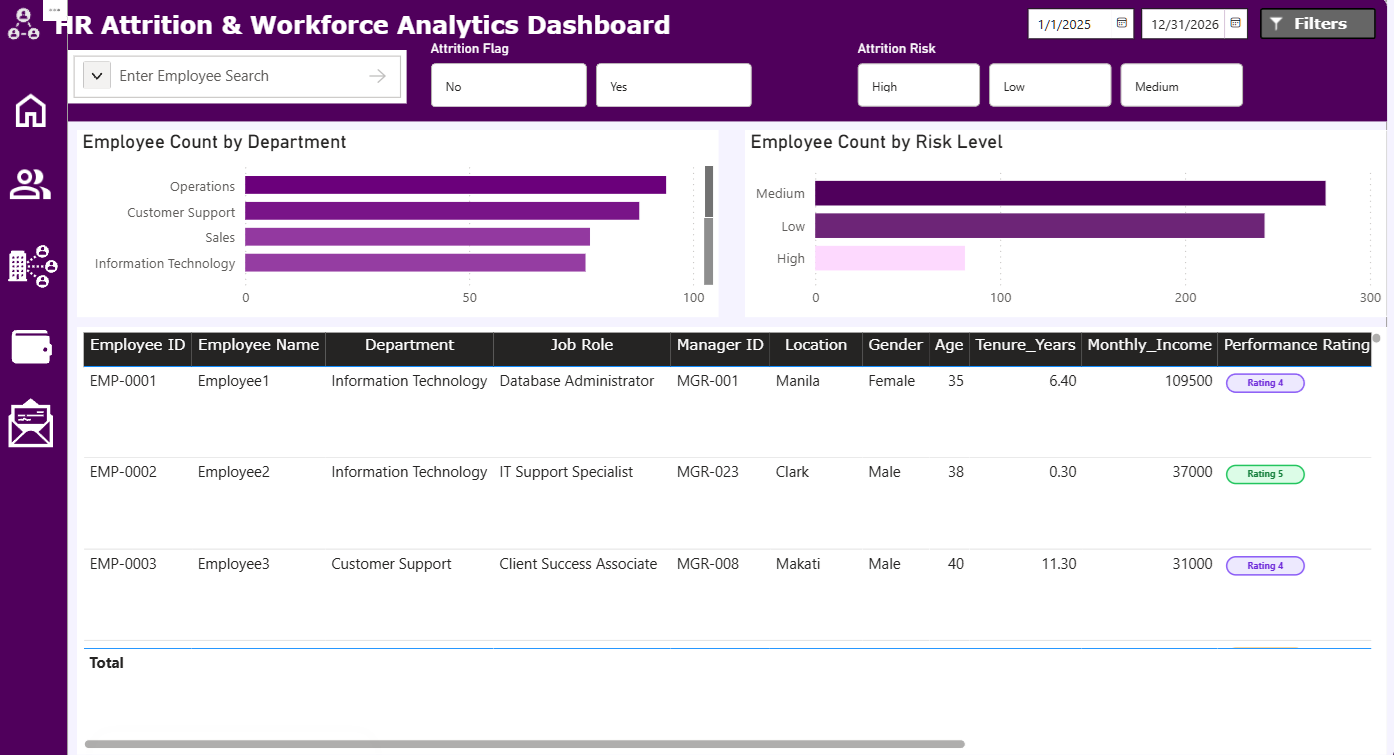
HR Attrition & Workforce Analytics | Power BI Template
On Sale
PHP1500.00
PHP1,500.00
Added to cart

HR Attrition & Workforce Analytics Dashboard


Understand employee turnover, retention patterns, and workforce trends through a professionally designed Power BI template.


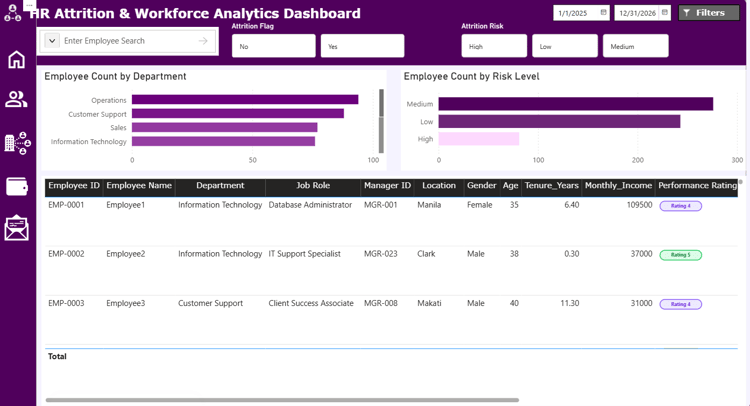
The HR Attrition & Workforce Analytics Dashboard helps HR professionals, analysts, managers, and business leaders explore the factors associated with employee attrition and identify workforce areas that may require attention.

Instead of reviewing employee information across multiple spreadsheets, this interactive dashboard brings important workforce indicators together in one clear reporting experience.


What You Can Analyze


  • Total employee headcount
  • Active and inactive employees
  • Employee attrition count
  • Overall attrition rate
  • Employee retention trends
  • Attrition by department
  • Attrition by job role
  • Attrition by age group
  • Attrition by gender
  • Attrition by education level
  • Attrition by tenure
  • Attrition by salary range
  • Overtime and attrition patterns
  • Job satisfaction and work-life balance
  • High-risk workforce segments


Dashboard Features


  • Interactive HR KPI cards
  • Dynamic filters and slicers
  • Department and job-role analysis
  • Employee demographic breakdowns
  • Attrition and retention insights
  • Tenure and experience analysis
  • Salary and compensation comparisons
  • Workforce trend visuals
  • Editable colors, charts, measures, and filters
  • Professional dashboard navigation
  • Power Query transformation structure
  • DAX measures for workforce analytics


What You’ll Receive


  • One reusable Power BI .pbit template file
  • Professionally designed dashboard pages
  • Editable report visuals
  • Editable Power Query structure
  • Editable data model and DAX measures
  • Instant digital download after purchase


Important PBIT Information


This product is delivered as a Power BI Template file with the .pbit extension, not as a .pbix report.

A PBIT file contains the report layout, visuals, queries, data-model definitions, relationships, parameters, and measures, but does not store the underlying report data. When the buyer opens the template, Power BI may ask them to enter parameters or connect to a compatible data source.


Who This Template Is For


  • HR professionals
  • People and workforce analysts
  • Data analysts
  • HR managers
  • Business owners
  • Power BI beginners
  • Power BI developers
  • Freelancers and consultants
  • Students building portfolio projects
  • Professionals learning HR analytics


Suggested Data Fields


The buyer’s employee dataset should contain fields similar to:


  • Employee ID
  • Employment status
  • Attrition status
  • Department
  • Job role
  • Gender
  • Age
  • Education
  • Marital status
  • Monthly income
  • Years at company
  • Total working years
  • Overtime status
  • Job satisfaction
  • Environment satisfaction
  • Work-life balance
  • Performance rating
  • Date hired
  • Date of separation


The buyer’s column names and data structure may differ. Power Query, relationships, data types, parameters, and DAX measures may need to be adjusted before using a different dataset.


Software Requirement


Microsoft Power BI Desktop is required to open and customize the .pbit file.

The template can be opened by double-clicking the file or through:

Power BI Desktop → File → Import → Power BI Template

Microsoft documents both methods for opening PBIT templates.

Basic familiarity with Power BI, Power Query, data modeling, and DAX is recommended.


Important Notes


This is a digital product. No physical item will be shipped.


The template is intended for educational, analytical, portfolio, and internal business-reporting purposes.

Connecting your own employee dataset may require changes to:


  • Data-source locations
  • Power Query steps
  • Table and column names
  • Data types
  • Model relationships
  • Parameters
  • DAX measures


Custom data integration, troubleshooting, and dashboard modification are not included with the standard purchase unless stated separately.


License


Your purchase includes a single-user license for:

  • Personal use
  • Educational use
  • Portfolio use
  • Internal business use
  • Customized client projects


You may customize the template for yourself, your employer, or a client.


You may not:

  • Resell the original template
  • Redistribute or publicly share the file
  • Upload it to another marketplace
  • Claim the original design as your own
  • Include the unchanged file in another commercial bundle
  • Share the template with multiple unrelated users


Custom Dashboard Services


Need an HR dashboard designed around your own workforce data, KPIs, or reporting requirements?

Contact Insight Flow Studio for custom Power BI dashboard development, data visualization, report improvement, and workflow automation.

You will get a PBIT (441KB) file
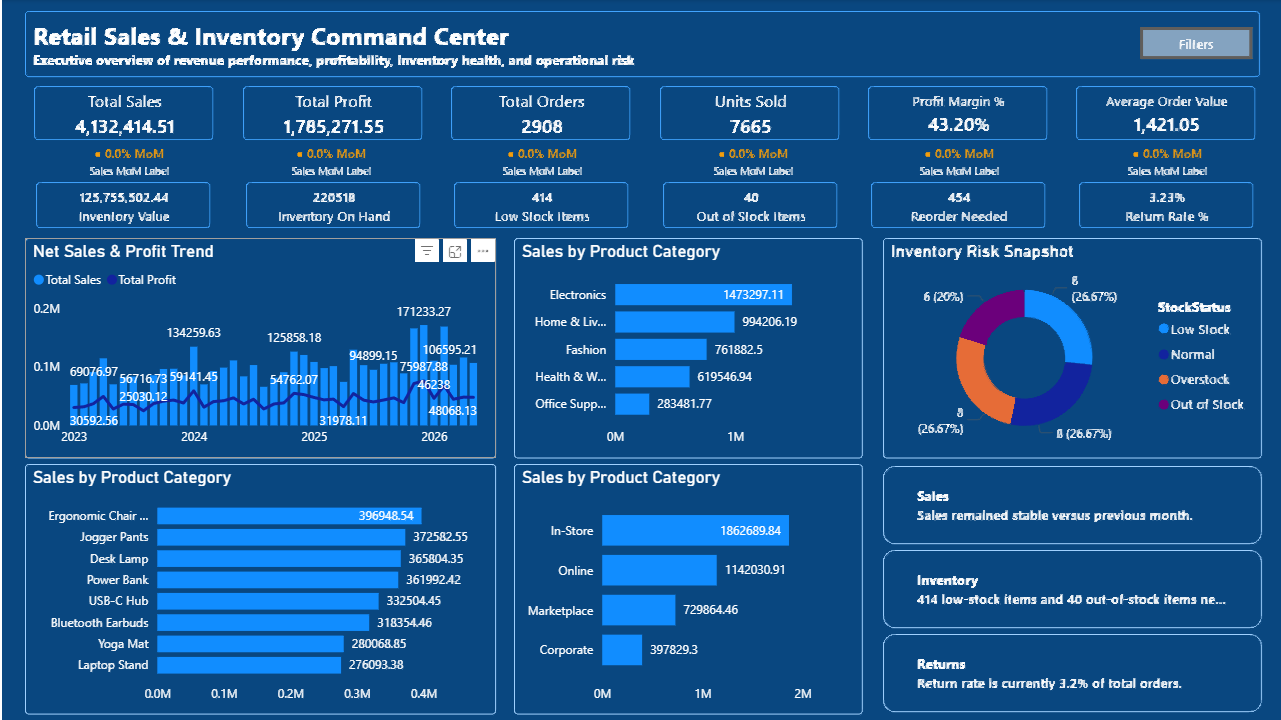
Retail Sales & Inventory Command Center | Power BI Template
On Sale
PHP1900.00
PHP1,900.00
Added to cart

Retail Sales & Inventory Command Center


Transform retail transaction and inventory data into clear, actionable business insights.


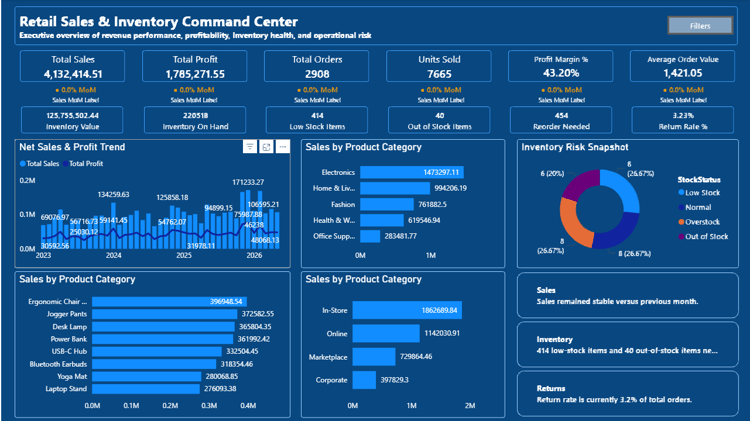
The Retail Sales & Inventory Command Center is a professionally designed Power BI template for monitoring sales performance, profitability, product demand, store activity, customer segments, returns, and stock availability.


Instead of reviewing sales and inventory information across multiple spreadsheets, this interactive dashboard brings essential retail KPIs together in one centralized reporting experience.


What You Can Analyze


  • Gross sales and net sales
  • Total profit and profitability
  • Cost of goods sold
  • Units sold
  • Sales and profit trends
  • Sales by region, city, and store
  • Online and physical-store channel performance
  • Product and product-category performance
  • Customer-segment performance
  • Payment-method distribution
  • Discount impact on sales and profit
  • Product returns and return amounts
  • Current inventory on hand
  • Reorder levels
  • In-stock, low-stock, and out-of-stock products
  • Delivery-status performance
  • Campaign performance
  • Top-performing and underperforming products


Dashboard Features


  • Interactive retail KPI cards
  • Dynamic date filters and slicers
  • Monthly, quarterly, and yearly analysis
  • Store and regional comparisons
  • Product-category and product-level analysis
  • Sales-channel performance
  • Customer-segment insights
  • Gross sales, net sales, COGS, and profit tracking
  • Returns monitoring
  • Inventory-on-hand analysis
  • Reorder-level monitoring
  • Stock-status indicators
  • Delivery-performance analysis
  • Editable visuals, filters, measures, and formatting
  • Power Query transformation structure
  • DAX measures for retail and inventory reporting


What You’ll Receive


  • One reusable Power BI .pbit template
  • Professionally designed dashboard pages
  • Editable report visuals and formatting
  • Editable Power Query structure
  • Editable data model, relationships, and DAX measures
  • Instant digital download after purchase


Important PBIT Information


This product is delivered as a Power BI Template file with the .pbit extension, not as a .pbix report.

The template contains the report pages, visual configurations, query definitions, data-model structure, relationships, and measures. It does not contain the underlying retail transaction data. Buyers must connect the template to a compatible data source or adjust the existing Power Query connection.


Who This Template Is For


  • Retail business owners
  • Sales and operations managers
  • Inventory-management teams
  • Retail and commercial analysts
  • Data analysts
  • Power BI developers
  • E-commerce professionals
  • Freelancers and consultants
  • Students building Power BI portfolios
  • Professionals learning retail analytics


Suggested Data Fields


The template works best with data containing fields similar to:


  • Transaction ID
  • Order date
  • Year, quarter, month, and week
  • Region
  • City
  • Store
  • Sales channel
  • Customer segment
  • Product category
  • Product
  • Payment method
  • Units sold
  • Unit price
  • Discount percentage
  • Gross sales
  • Net sales
  • Cost of goods sold
  • Profit
  • Return status
  • Return amount
  • Inventory on hand
  • Reorder level
  • Stock status
  • Delivery status
  • Campaign


Different datasets may require changes to the column names, table names, data types, Power Query steps, relationships, or DAX measures.


Software Requirement


Microsoft Power BI Desktop is required to open and customize the .pbit template.

Basic familiarity with Power BI, Power Query, data modeling, relationships, and DAX is recommended when connecting a different retail dataset.


Important Notes


This is a digital product. No physical item will be shipped.


The template is intended for analytical, educational, portfolio, and internal business-reporting purposes.


Connecting your own data may require modifications to:


  • Data-source locations
  • Power Query steps
  • Table and column names
  • Data types
  • Relationships
  • Parameters
  • DAX measures


Custom data integration, troubleshooting, and dashboard modification are not included with the standard purchase unless stated separately.


License


Your purchase includes a single-user license for:


  • Personal use
  • Educational use
  • Portfolio use
  • Internal business reporting
  • Customized client projects


You may customize the template for yourself, your employer, or a client.


You may not:


  • Resell or redistribute the original template
  • Upload the template to another marketplace
  • Publicly share the original file
  • Claim the original design as your own
  • Include the unchanged template in another commercial bundle
  • Share one purchase with multiple unrelated users


Custom Dashboard Services


Need a retail dashboard designed around your own products, stores, inventory rules, KPIs, or dataset?

Contact Insight Flow Studio for custom Power BI dashboard development, data visualization, reporting improvements, and workflow automation.

You will get a PBIT (266KB) file