Menu Price Increase Simulator: Test Three Price Plans on 80 Items Before You Reprice the Menu
Full description
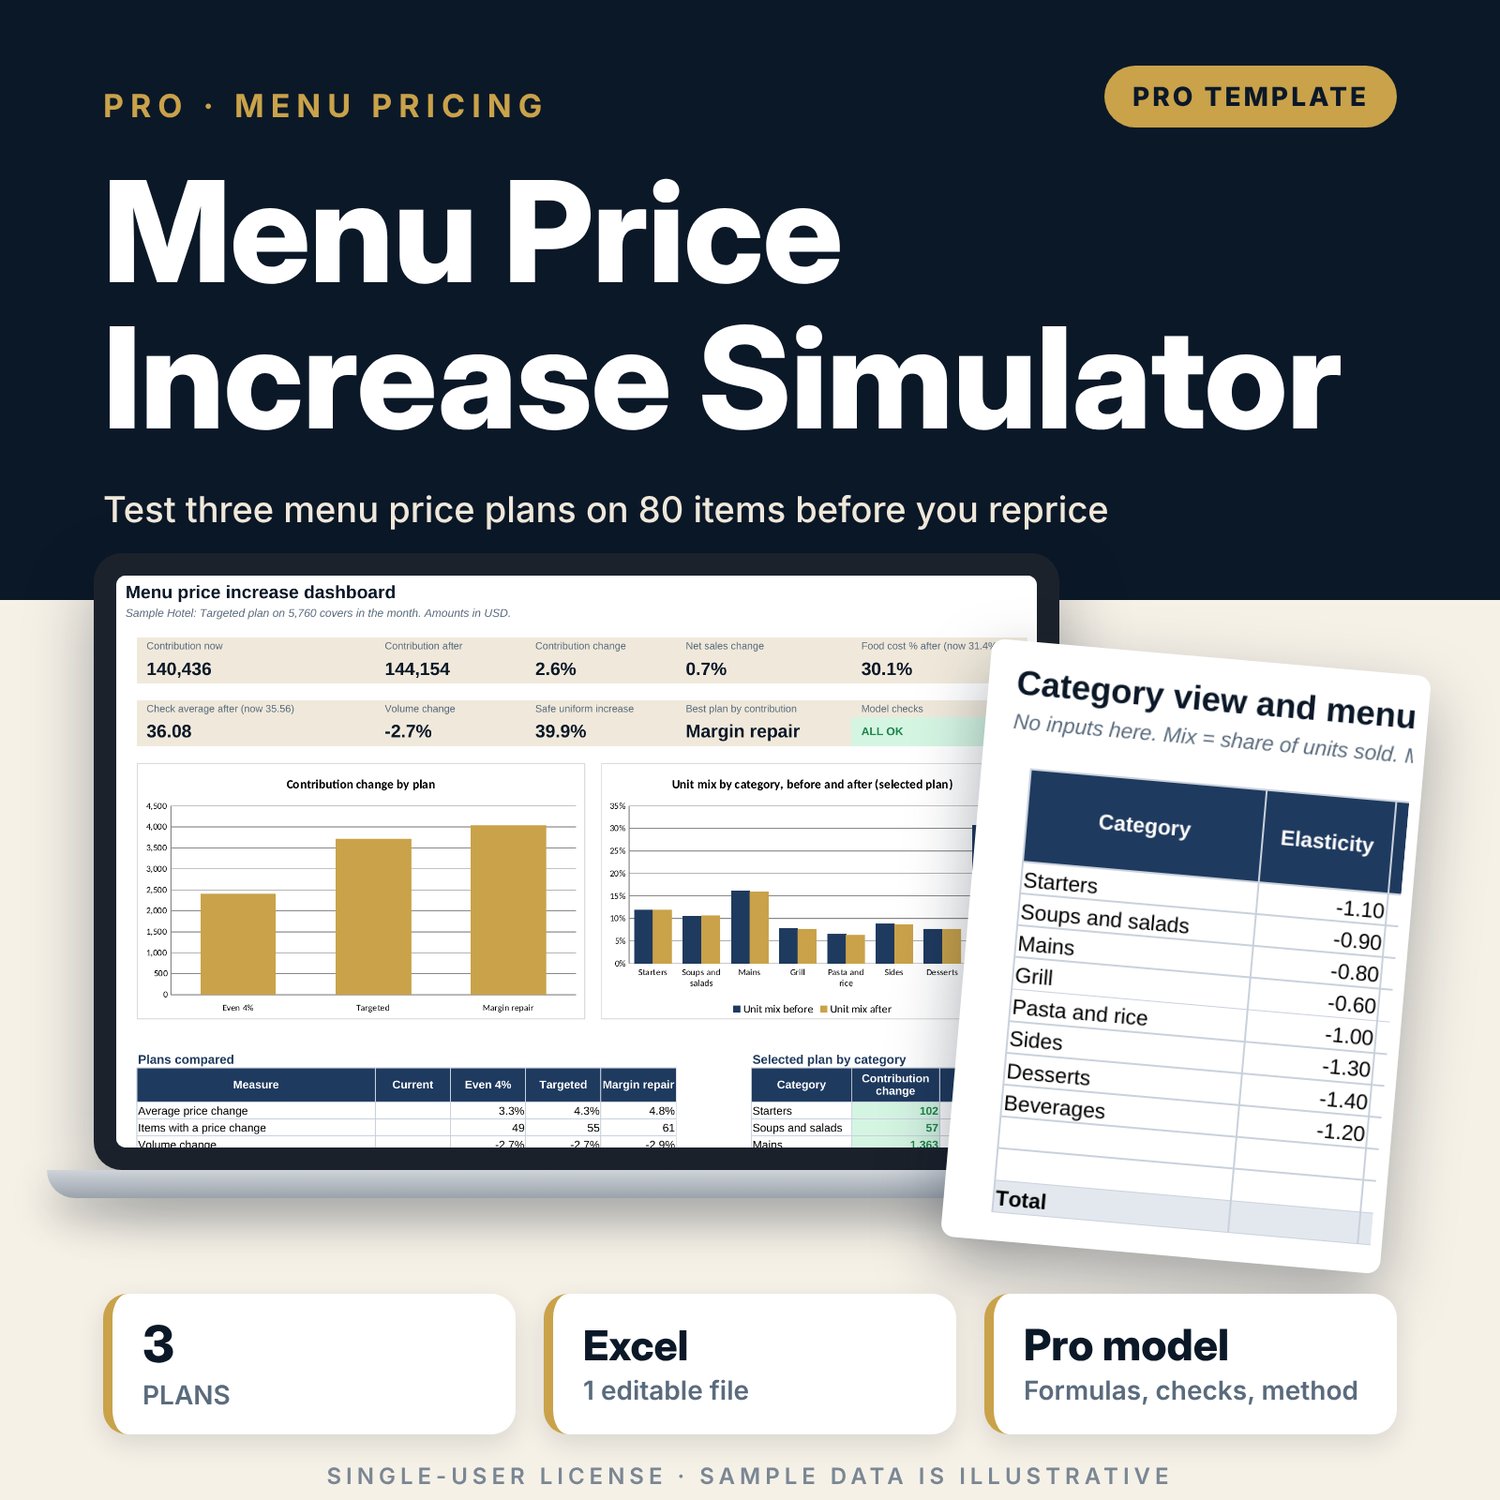
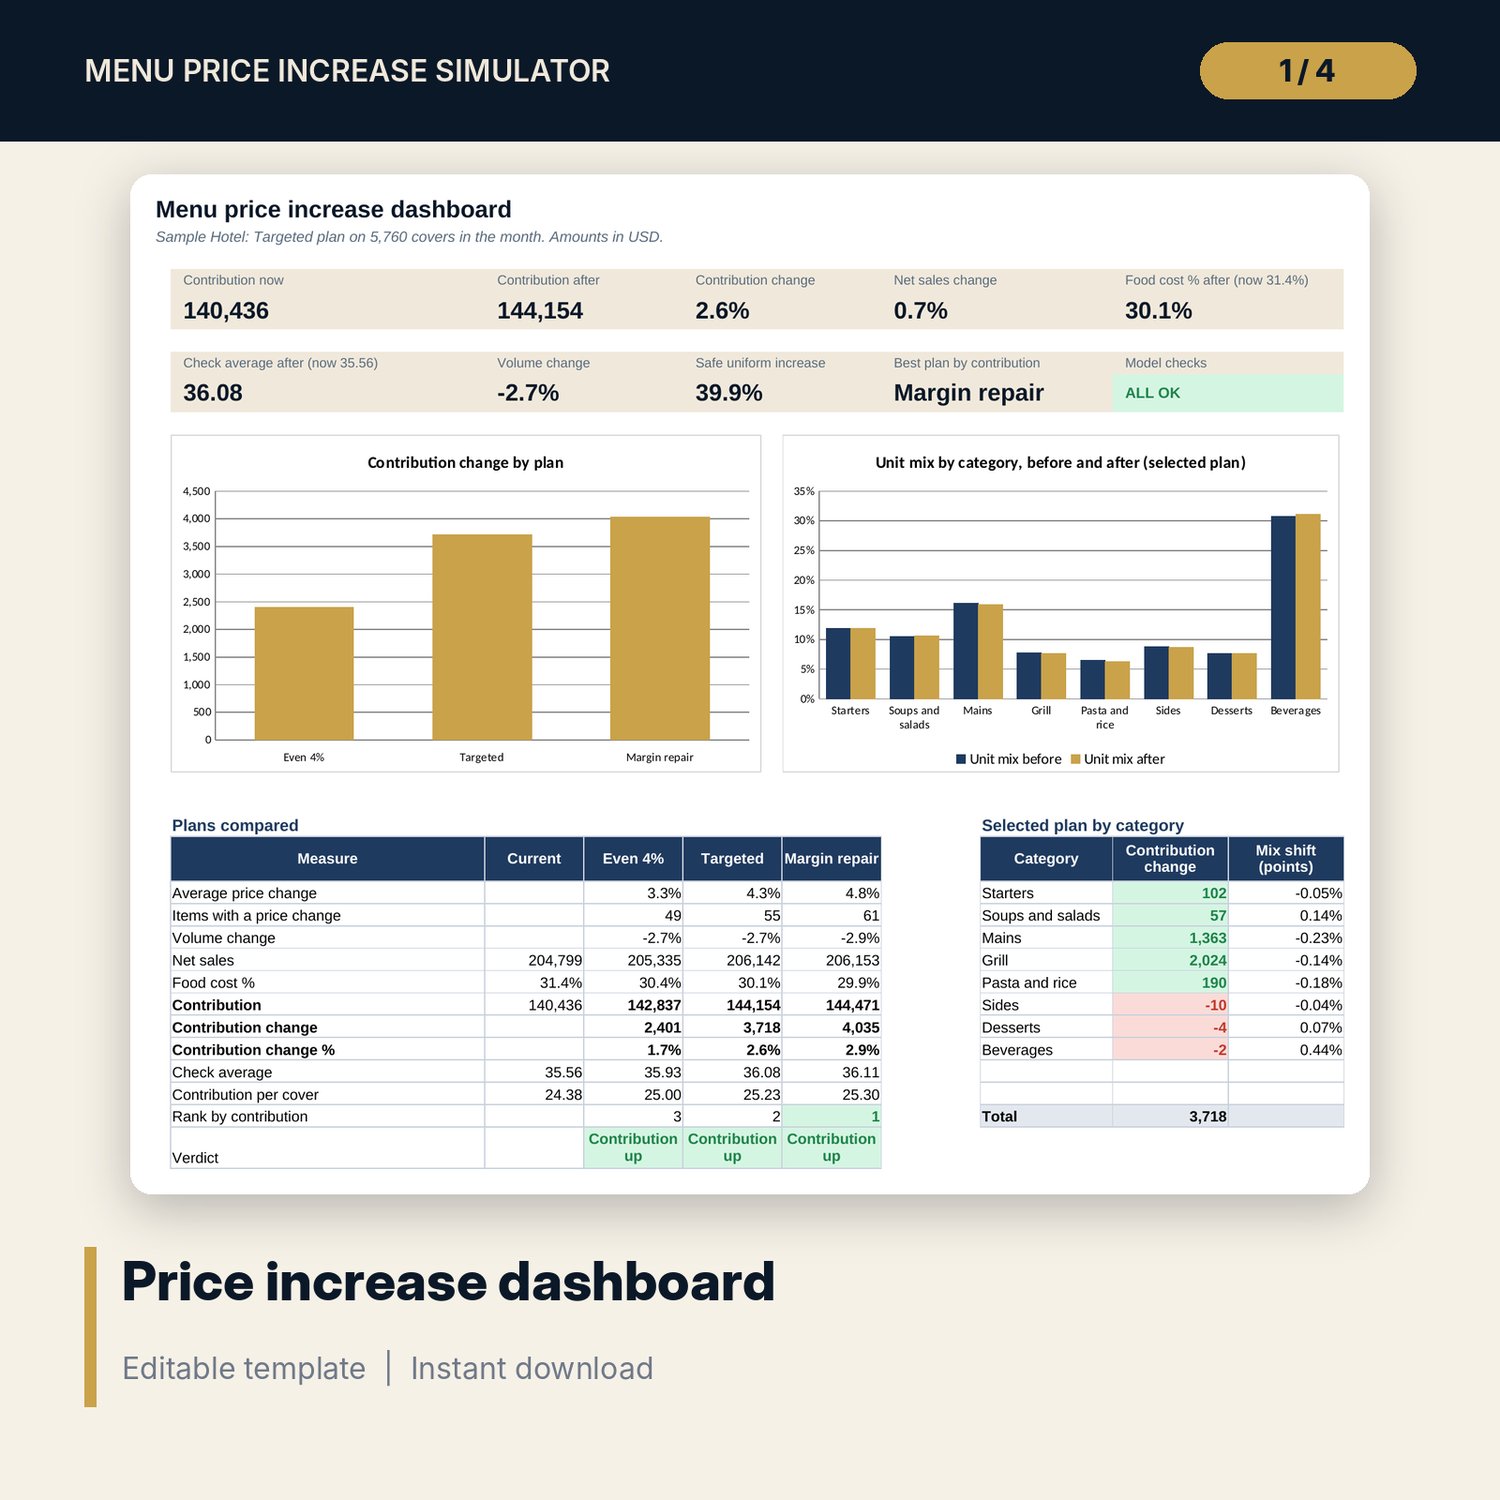
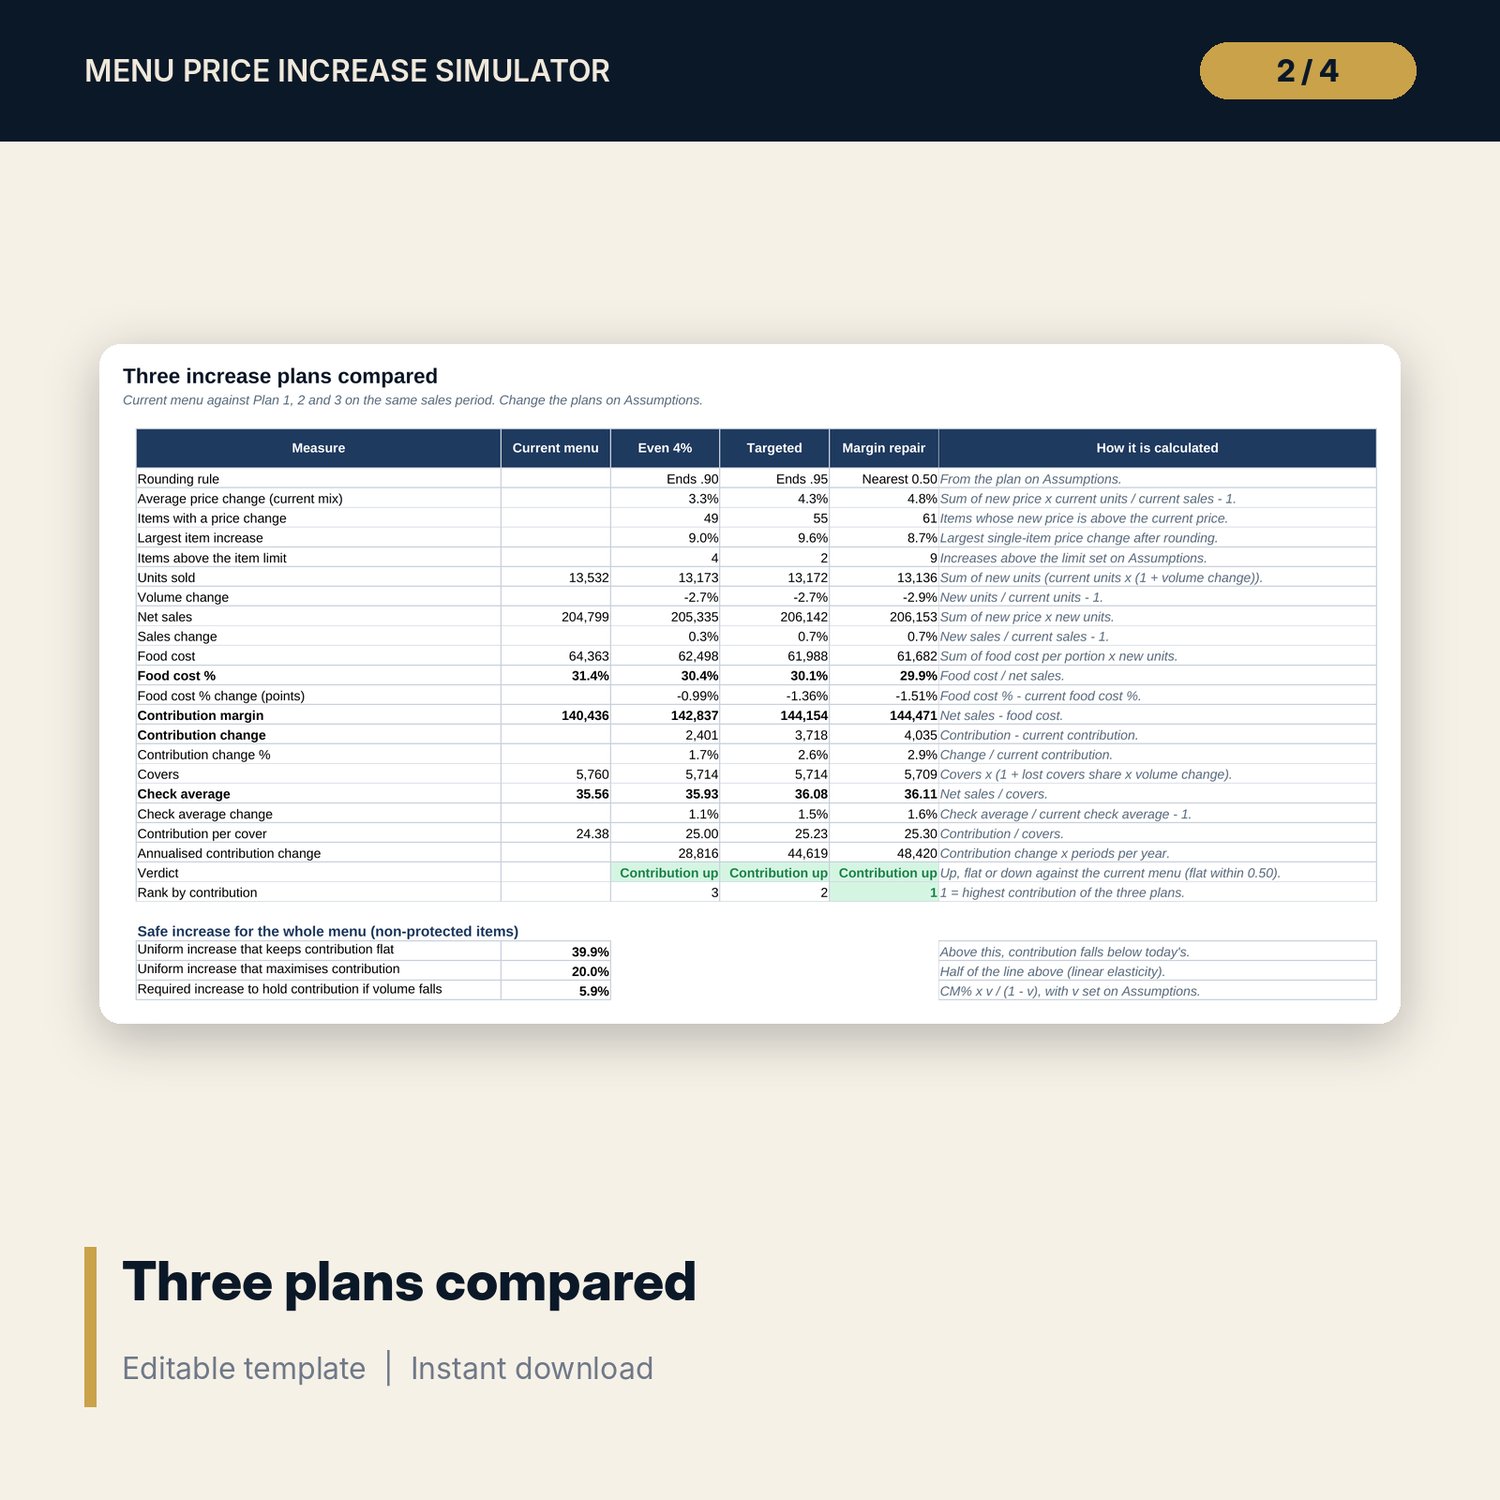
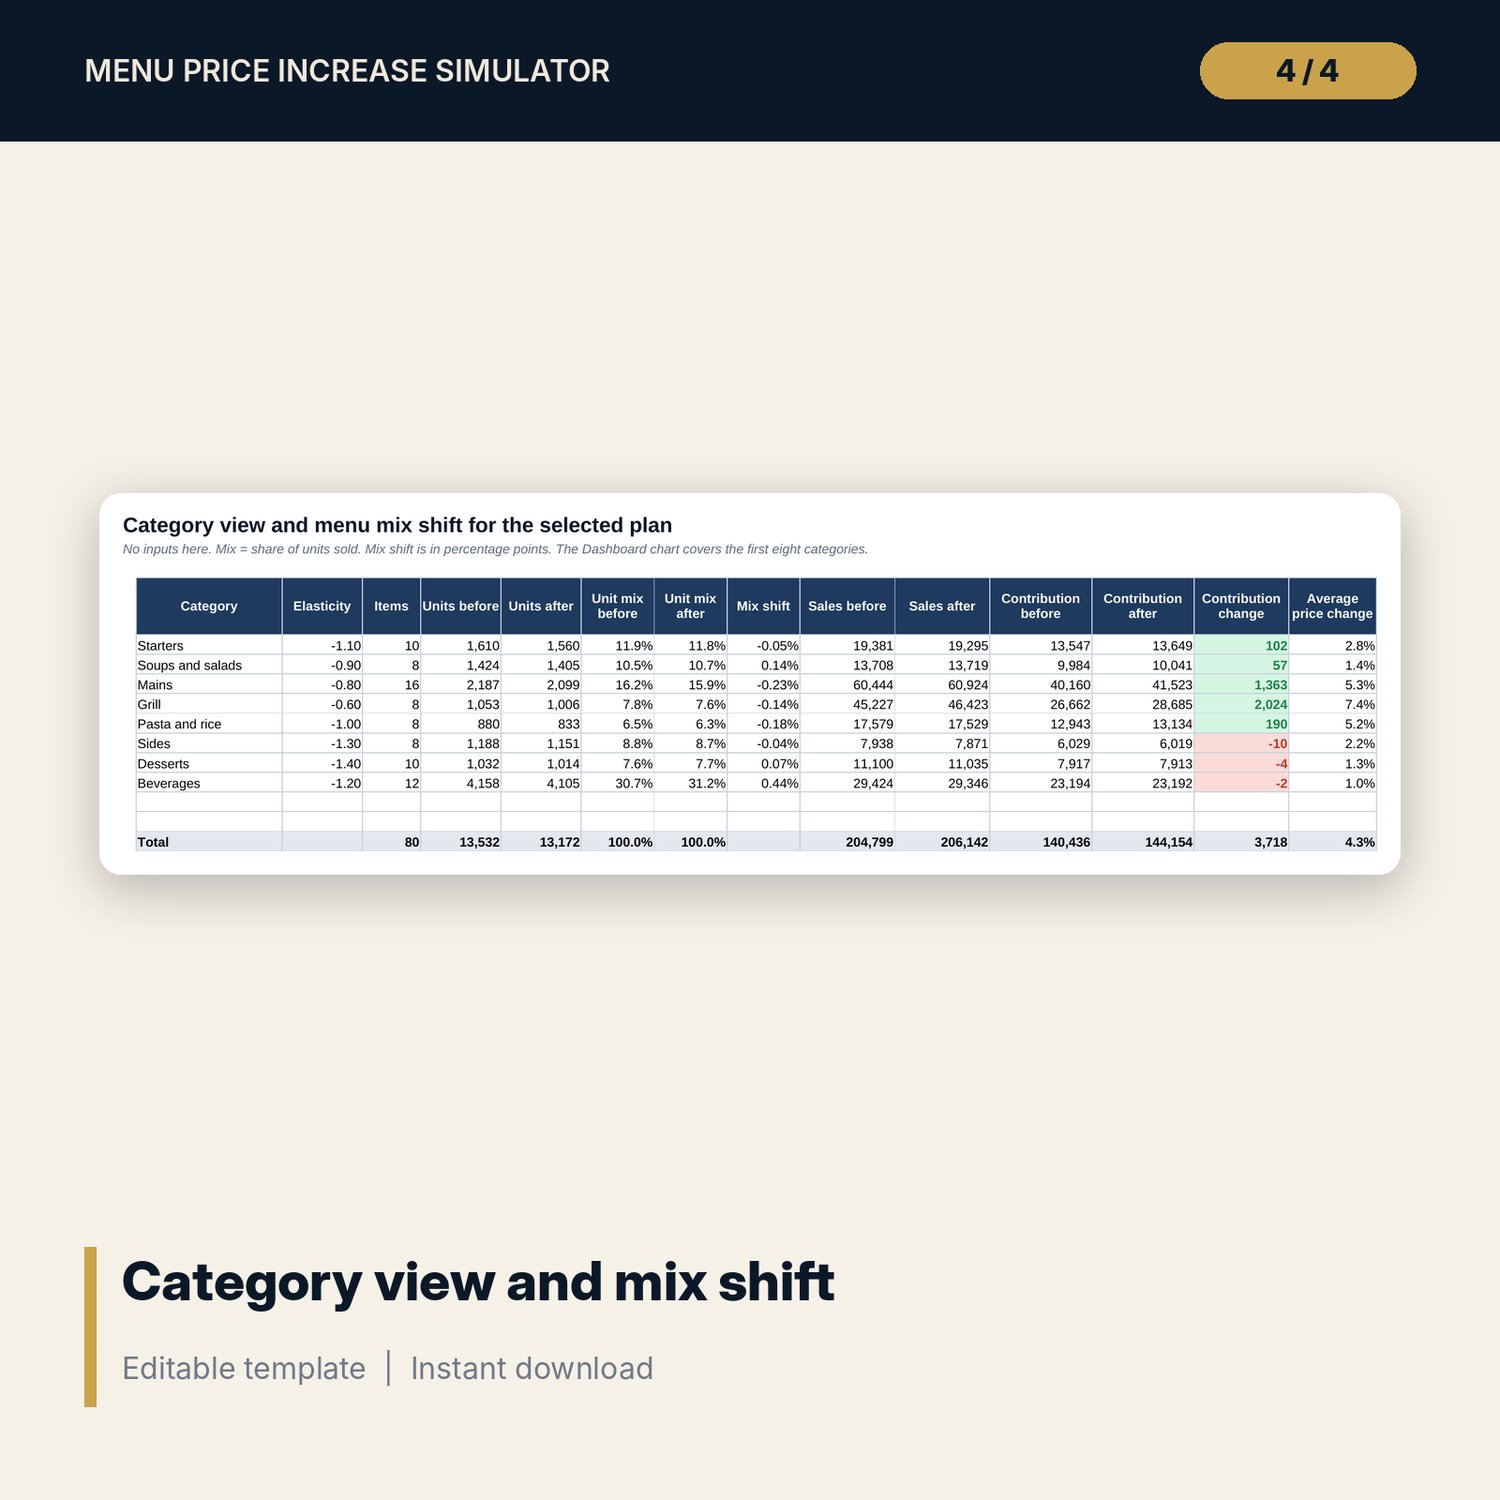
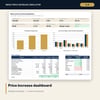
For restaurant managers, F&B directors, hotel general managers and controllers who plan a menu price increase. The workbook holds 80 sample menu items with price, food cost per portion and units sold. You set an elasticity by category and three increase plans. Each plan sets an increase for each category, an extra increase for items above your target food cost %, and a rounding rule such as ends .90 or nearest 0.50. The simulator returns the new price, the expected volume change and the effect on sales, food cost and contribution margin for every item and in total. It shows the shift in menu mix, the food cost % and check average after the change, and the increase that keeps contribution flat if volume falls. Protected items keep their price.
Save with a bundle: this workbook is also in the F&B Control & Audit Pro Bundle, 25 workbooks for $59 instead of $310. All 100 Pro workbooks are in the Pro Library for $119, and all 241 templates and workbooks are in the Ultimate Hospitality Library for $149.
What is inside
- Menu_Price_Increase_Simulator.xlsx: 11 tabs, 7,251 formulas, 2 native charts, 10 drop-down and input rules
- Menu: 80 sample items across 8 categories, room for 100 items
- Assumptions: elasticity for 10 category slots, 8 rounding rule slots and three plans
- Engine: every plan calculated step by step for each item
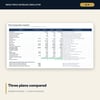
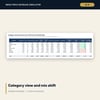
- Item_Effects (selected plan, with required increase, highest safe increase and a flag), Plans (three plans against the current menu), Category (mix shift)
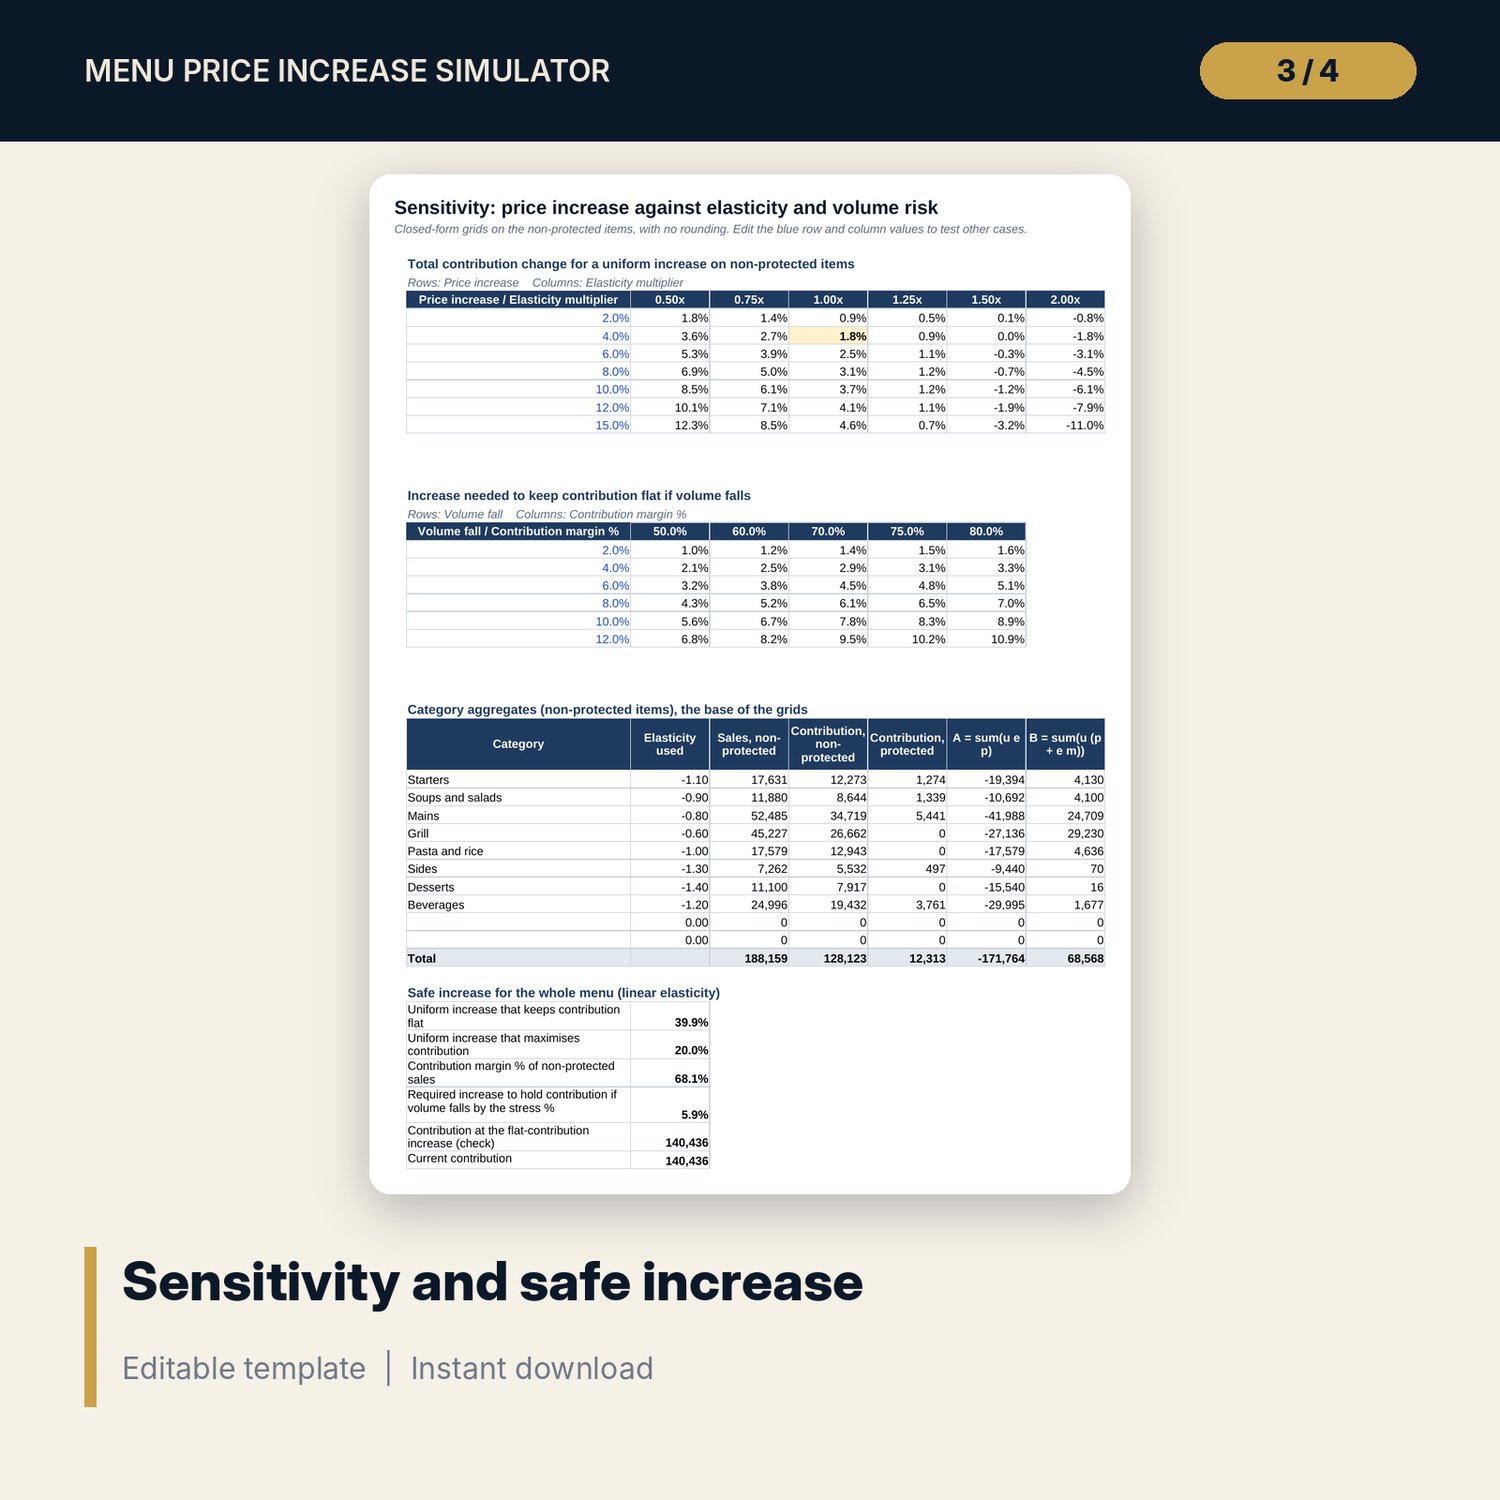
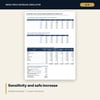
- Sensitivity: contribution change by increase and elasticity, and the increase that holds contribution if volume falls
- Dashboard (one printed page), 14 integrity checks and a Method tab with 17 documented calculations
- README.txt and LICENSE-and-Terms.txt
How it works
- Set covers, the target food cost % and the elasticity of each category on Assumptions.
- Replace the sample items with your menu: price, food cost per portion, units sold and protected items.
- Define up to three plans: increase by category, extra increase above target food cost %, and a rounding rule.
- Compare the plans on Plans and the Dashboard, then pick one plan to study item by item.
- Check the safe increase on Sensitivity and confirm that Checks shows ALL OK.
Details
- Format: one .xlsx workbook, English
- Software: Excel 2016 or later, or LibreOffice Calc 7 or later
- No macros, no external links, no add-ins, no array formulas
- Instant digital download
Good to know
- Sample data is illustrative. Replace the items, units and elasticities with your own figures.
- Elasticity is an estimate. The model is linear and suits small price changes. Test an increase on a few items before you apply it everywhere.
- Rounding rules, limits and targets are editable inputs. Verify how local rules treat tax and service charges in displayed prices.
- Single-user license. Do not redistribute.
FAQ
How is the volume change estimated?
Volume change % = elasticity x price change %. You enter one elasticity per category. A value of -1.00 means a 1% price rise loses 1% of units.
What does Protected mean?
A protected item keeps its current price in every plan. Use it for signature items or items under contract.
How does the rounding work?
Each plan picks a rule with an ending and a step. The planned price is rounded to the nearest price with that ending. A rule never lowers a price.
What is the safe increase?
It is the increase at which contribution equals today's. Above it, the volume you lose costs more than the price gain adds. The workbook shows it for each item and for the whole menu.
Does it need macros or add-ins?
No. Every result is a standard worksheet formula.